1-s2.0-s0013794409002914-main
DESCRIPTION
paper on mode 1 mode 2 delaminationTRANSCRIPT

Engineering Fracture Mechanics 77 (2010) 128–143
Contents lists available at ScienceDirect
Engineering Fracture Mechanics
journal homepage: www.elsevier .com/locate /engfracmech
Mode I and II fracture behavior of adhesively-bonded pultrudedcomposite joints
Ye Zhang, Anastasios P. Vassilopoulos, Thomas Keller *
Composite Construction Laboratory (CCLab), Ecole Polytechnique Fédérale de Lausanne (EPFL), Station 16, Bâtiment BP, CH-1015 Lausanne, Switzerland
a r t i c l e i n f o
Article history:Received 27 March 2009Received in revised form 1 September 2009Accepted 28 September 2009Available online 7 October 2009
Keywords:Polymer matrix compositesFracture mechanicsCrack growthCivil engineering structuresBonded joints
0013-7944/$ - see front matter � 2009 Elsevier Ltddoi:10.1016/j.engfracmech.2009.09.015
* Corresponding author. Tel.: +41 21 6933226; faE-mail address: [email protected] (T. Keller)
a b s t r a c t
The Mode I and II fracture behaviors of adhesively-bonded joints composed of pultrudedglass fiber-reinforced polymer (GFRP) laminates were experimentally investigated usingDouble-Cantilever-Beam (DCB) and End-Loaded-Split (ELS) specimens. The large specimendimensions on the full-scale level and asymmetric crack propagation in the laminatesimposed deviations from the standardized specimens. For crack length measurement, inaddition to visual observation, a video extensometer was used. Similar strain energyrelease rate values were obtained from all standardized methods as well as from 3D finiteelement models, with the exception of Simple Beam Theory. The applicability of existingstandards for interpretation of the fracture data for the fracture mechanics joints usedwas proved.
� 2009 Elsevier Ltd. All rights reserved.
1. Introduction
Only a limited number of standards and testing protocols exist for the fracture mechanics testing of composite materialsand joints [1–6]. They concern either the fracture of the adhesives in joints [1,2], or determination of the interlaminar frac-ture toughness of unidirectional composite laminates in the case of Mode I, Mode II or mixed-mode fracture [3–6], see Table1. Depending on the examined fracture mode, different specimen types are proposed, and different methods are adopted forcalculation of the strain energy release rate (SERR), see Table 1. For Mode I, Double-Cantilever-Beam (DCB) and Tapered-DCB(TDCB) specimens are employed, Mixed-Mode-Bending (MMB) specimens are proposed for mixed-mode fracture [5], whileEnd-Loaded-Split (ELS) or 4-Point End-Notched-Flexure (4ENF) specimens are used for Mode II fracture [6]. The use of a trav-eling microscope is suggested for Mode II [6], since it is difficult to measure crack length purely on the basis of visualobservation.
Basically four methods are used for calculation of the Mode I and II SERR: the Simple Beam Theory (SBT), the CorrectedBeam Theory (CBT), the Experimental Compliance Method (ECM) and the Modified Compliance Calibration (MCC), see Table1. For 4ENF specimens (Mode II), the Compliance Calibration Method (CCM) is proposed instead of the aforementioned meth-ods. Irrespective of the calculation method used, SERR values are usually plotted against the corresponding crack lengths toform a resistance curve (R-curve). The ideal R-curve presents an initially increasing SERR before reaching a plateau, althoughits shape is strongly dependent on the material and joint configuration [7]. If large-scale fiber bridging occurs as mentioned in[8], that is, if the bridging length is comparable to or exceeds a specimen dimension, the R-curve behavior may depend onspecimen dimensions. Since the use of materials other than standardized laminates may cause doubt regarding the applica-bility of data reduction schemes based on linear-elastic fracture mechanics, an objectives of several studies was the validation
. All rights reserved.
x: +41 21 6936240..

Nomenclature
a crack lengtha0 initial crack lengthac corrected crack lengthB specimen widthC specimen complianceC0 specimen compliance before crack initiationD distance between dots marked on ELS specimensEs tensile modulus or flexural modulus of adherendEf back-calculated tensile modulus or flexural modulus of adherendF correction factor for large displacementFx, Fy nodal force at crack tipG strain energy release rateGC critical strain energy release rateGI strain energy release rate for Mode IGII strain energy release rate for Mode IIGIC critical strain energy release rate for Mode IGIIC critical strain energy release rate for Mode IIh half specimen thicknessL free lengthm slope of a plot (BC)1/3 vs. a/2h (determined from Mode I experiment)m slope of a plot C vs. a3 (determined from Mode II experiment)m* slope of a plot C vs. ac
3 (determined from Mode II experiment)N correction factor for loading blocksn power fitting parameter of C vs. aP applied loadPmax maximum applied loadux, uy nodal displacement adjacent to crack tipDa crack increment in finite element analysisDclamp correction for clamp length (determined from Mode II experiment)DI crack length correction (determined from Mode I experiment)DII crack length correction (determined from Mode II experiment)d displacement of the cross-head of testing machine4ENF 4-Point End-Notched-FlexureC105 onset of 5%-compliance increaseCBT Corrected Beam TheoryCBTE Corrected Beam Theory with Effective crack lengthCCM Compliance Calibration MethodCFRP Carbon Fiber-Reinforced PolymerDCB Double-Cantilever-BeamECM Experimental Compliance MethodELS End-Loaded-SplitFEA finite element analysisGFRP glass fiber-reinforced polymerMAX onset of maximum load on the load–displacement curveMCC Modified Compliance CalibrationMMB Mixed-Mode-BendingNL onset of the derivation from linear load–displacement responseSERR strain energy release rateSBT Simple Beam TheoryTDCB Tapered Double-Cantilever-BeamVCCT Virtual Crack Closure TechniqueVIS onset of the visual observation of crack initiation
Y. Zhang et al. / Engineering Fracture Mechanics 77 (2010) 128–143 129
of standard procedures for calculation of the Mode I [9–16] and Mode II [17–21] SERR for specific non-standardized materialsand joints, as summarized in Tables 2 and 3.
Independent of fracture mode, the SERRs for crack initiation and crack propagation are defined on the basis of the load–displacement curve and resulting R-curve. Three different SERR values can be assigned to crack initiation: (a) the non-linear(NL) value, corresponding to the critical load and displacement associated with the deviation from linear response, (b) the

Table 1Standards and protocols for Mode I, Mode II and mixed-mode fracture.
Standards and protocols Fracture Specimen type G calculation method Fitting range
ASTM D3433 – 99 (2005) [1] Mode I Joint: DCB, TDCB SBT –ESIS TC4 Protocol (2000) [2] Mode I Joint: DCB, TDCB SBT, CBT, ECM Only propagationASTM D5528 – 01 (2007) [3] Mode I Laminate: DCB CBT, ECM, MCC VIS + propagationISO 15024:2000(E) [4] Mode I Laminate: DCB CBT, MCC VIS + propagationASTM D6671/D6671 M-06 (2006) [5] Mixed Laminate: MMB SBT –ESIS TC4 Protocol (2006) [6] Mode II Laminate: ELS, NF CBT, ECM, CCM VIS + propagation or only propagation
Table 3Determination of G for crack initiation and propagation for Mode II fracture.
References Specimen Material(adhesive)
Method Choice of GIIC forinitiation
Choice of GIIC for propagation
[17] Laminate: 3ENF Graphite/epoxy
SBT – Mean of all points corresponding to propagation
[18] Joint: 4ENF CFRP (epoxy) SBT, FEA VIS Mean of all points corresponding to propagation[19] Laminate: ELS, SLB (single-leg
bending)GFRP/polyester
SBT, CBT,FEA
– Mean of visually determined plateau
[20] Joint: ELS CFRP (epoxy) SBT, CBT,ECM
NL, VIS, MAX/C105 Mean of visually determined plateau (75–100 mm crack length)
[21] Joint: ELS CFRP (epoxy) SBT, CBT,ECM
NL, VIS, MAX/C105 Mean of all points corresponding to propagation
Table 2Determination of G for crack initiation and propagation for Mode I fracture.
References Specimen Material(adhesive)
Method Choice of GIC forinitiation
Choice of GIC for propagation
[9] Joint: DCB CFRP (epoxy) SBT – Mean of visually determined plateau[10] Joint: DCB CFRP (epoxy) SBT, CBT – Mean of visually determined plateau[11] Laminate:
DCBE-glass/vinylester
CBT (designated MBT), ECM(designated CC)
VIS Mean of visually determined plateau(>20 mm crack length)
[12] Joint: DCB,TDCB
Metal(epoxy)
SBT, CBT, ECM NL, VIS, MAX/5% Mean of visually determined plateau
[13] Laminate:DCB
E-glass/polyester
SBT, ECM VIS –
[14] Laminate:DCB
Twintex CBT – Mean of visually determined plateau (butno value provided)
[15] Laminate:DCB
E-glass/polyester
CBT (designated MBT), ECM(designated CC), MCC
NL, VIS, MAX/5% Mean of visually determined plateau
[16] Laminate:DCB
CFRP, GFRP CBT VIS, MAX/5% –
130 Y. Zhang et al. / Engineering Fracture Mechanics 77 (2010) 128–143
visual (VIS) value derived from visual observation of crack initiation and (c) the maximum (MAX) value or 5%-complianceincrease (C105) value, corresponding to the maximum load reached or the load that causes a 5% increase in compliance,whichever occurs first. In reality, however, it is not always possible to determine all these values, see Tables 2 and 3. Thederivation of all three values for crack initiation was not possible in [9–11,13,14,17–19]. The VIS value was therefore attrib-uted to the first measurable crack length in [11,13,18] and assumed as being the critical SERR, GC, for initiation.
The determination of the critical SERR for crack propagation is based on the R-curve and is more difficult since an idealplateau region is often not observed. Depending on the form of the R-curve, different values were selected to represent thecritical SERR for crack propagation, see Tables 2 and 3. The mean value of the plateau-like region [9–12,14,15,19,20], or themean value of all data points corresponding to crack propagation [17,18,21] were selected.
Previous studies conducted for the aerospace or automotive industries mainly focused on the delamination resistance ofCarbon Fiber-Reinforced Polymer (CFRP) laminates and/or the fracture behavior of joints according to available standards.However, in civil engineering structures, joint dimensions are significantly larger mainly due to the pultruded structuralglass fiber-reinforced polymer (GFRP) adherends of thicknesses above 5 mm and adhesive layer thicknesses of between 1and 3 mm to compensate for tolerances. Furthermore, fiber-tear failure, which is the most common failure mode for thesejoints, occurs in the GFRP adherends in a plane away from the joint symmetry axis [22]. Such asymmetry was found to intro-duce a Mode II component in Mode I fracture in [7]. Due to these deviations from standardized specimens, validation of thesteps involved in the calculation of the SERR for the material and joint configuration examined here is necessary before frac-ture mechanics is applied in this field of engineering.

Y. Zhang et al. / Engineering Fracture Mechanics 77 (2010) 128–143 131
In the present work, adhesively-bonded pultruded GFRP fracture mechanics joints (DCB and ELS) were examined to ob-tain fracture mechanics data. Specimen configuration, experimental setup and procedures for calculation of the SERR werechosen to correspond with existing standards as far as possible. An alternative video extensometer method was used for themeasurement of crack length. The SERR was calculated based on all the available standard methods. Additionally, 3D finiteelement models were developed for the numerical derivation of the Mode I and Mode II SERR. The theoretical results werecompared to the corresponding experimental data to evaluate the applicability of the available methods to the new fracturemechanics joints.
2. Theoretical background
The methods and equations used in the present work for the analysis of the fracture mechanics data from the investigatedDCB and ELS specimens are summarized in this section. In linear-elastic fracture mechanics (LEFM), the SERR is directly de-rived from:
G ¼ P2
2BdCda
ð1Þ
where B is the specimen width, a the crack length obtained with the applied load P and corresponding displacement d, and Cthe specimen compliance. Standard methods for the SERR calculation are based on this equation, the difference betweenthem basically being the way in which the derivative dC/da is obtained.
SBT was developed based on the shear-corrected beam analysis as presented in [23] and incorporated into ASTM D3433[1]. The closed-form solution of the compliance is expressed as:
C ¼ 8a
EsBh2 ða2 þ h2Þ ð2Þ
where 2h is the thickness of the joint specimen, and Es is the axial tensile Young’s modulus or flexural modulus of the adher-end. Since the pultruded GFRP adherends used are non-homogeneous and their flexural modulus differs significantly fromthe tensile modulus (14.2 GPa derived from 4-point bending vs. 31.4 GPa derived from tensile tests), the flexural moduluswas used. By substituting the derivative, dC/da, in Eq. (1), the Mode I fracture energy, GI, is calculated as:
GI ¼4P2
EsB2
3a2
h3 þ1h
� �ð3Þ
As experimental efforts have demonstrated that SBT may lead to erroneous results, CBT was introduced [24]. In CBT, threecorrection factors take the following effects into account in the calculation of the SERR: the root rotation (factor DI), the stiff-ening of the loading blocks (factor N), and the moments resulting from large displacements (factor F) [24]. The procedures forthe estimation of these factors according to [2,3] were applied and the compliance and Mode I SERR were calculated basedon:
C ¼ 8
EsBh2 ðaþ jDIjÞ3 ð4Þ
GI ¼3Pd
2Bðaþ jDIjÞFN
ð5Þ
The stiffness of the adherends was cross-checked (back-calculated) as follows [12]:
Ef ¼8ðaþ jDIjÞ3
ðC=NÞBh3 ð6Þ
Experimental results showed that the back-calculated value of Ef is slightly higher than the measured value [12,16]. How-ever, large deviations may indicate erroneous results.
In ECM, the measured compliance (C = d/P) is usually fitted to the measured crack length by a power-law equation of theform: C = k an, and the SERR is calculated as:
GI ¼nPd2Ba
ð7Þ
Correction factors F and N, which can be applied (as in Eq. (5)), were not used.The MCC method differs from ECM only in the fitting of the compliance against the crack length, which is normalized by
the specimen thickness (2h) in this case to exclude its effect on the SERR [4,7]:
GI ¼3m
2ð2hÞPB
� �2 BCN
� �2=3
F ð8Þ

132 Y. Zhang et al. / Engineering Fracture Mechanics 77 (2010) 128–143
where m is the slope of the straight line calculated after fitting (BC)1/3 against a/2h.SBT and CBT are based on an analytical calculation of the compliance (Eqs. (2) and, (4)), while results from ECM and MCC
depend on the quality of the fitting of the measured compliance (Eqs. (7) and, (8)). However, similar results are expectedfrom CBT and MCC since the correction factor DI in CBT (Eq. (5)) and the exponent m in MCC (Eq. (8)) are obtained by fitting(C)1/3 against the crack lengths, a and a/2h respectively. MCC is therefore not considered in [2] for Mode I fracture. In thepresent work, however, both methods were applied.
The SBT, CBT and ECM procedures were also used for calculation of the Mode II fracture energy, GII. For an ELS specimen,the compliance based on the SBT is calculated as:
C ¼ 3a3 þ L3
2Bh3Es
ð9Þ
and the derived equation for the SERR is then:
GII ¼9P2a2
4B2h3Es
ð10Þ
where L is the free length.Similarly to Mode I, more accurate results are obtained from CBT with a corrected crack length being calculated as
ac = a + DII If DI is available (which is the case here), the correction factor DII can be assumed as being equal to 0.42DI
[25] and the compliance is calculated as:
C ¼ 3ðaþ DIIÞ3 þ ðLþ 2DIÞ3
2Bh3Es
ð11Þ
By incorporating dC/da into Eq. (1), GII is calculated as:
GII ¼9P2a2
c
4B2h3Es
¼ 9P2ðaþ DIIÞ2
4B2h3Es
ð12Þ
If no information is available concerning DI, an alternative process for calculation of the corrected crack length can beused [26]. The pre-cracked part of the ELS specimen is clamped and a load applied to the free end. The compliance of thespecimen is measured for different free lengths and its cubic root, (C)1/3, is fitted against the free length, L, by a straight line.The intersection of this line with the abscissa (x-axis) is designated Dclamp. The corrected crack length can then be calculatedas:
ac ¼ aþ DII ¼13
2Bh3EsCN
� ðLþ DclampÞ3 ! !1=3
ð13Þ
CBT of this type is referred to as Corrected Beam Theory with Effective crack length (CBTE) [26] and is independent ofcrack length, which is often difficult to measure. According to CBTE, the compliance can be calculated using Eq. (11) if param-eter DI is replaced by Dclamp/2.
ECM can be applied for either the measured or the corrected crack length. It is assumed that the compliance of the spec-imen is a linear function of a3 or a3
c [20]:
C ¼ C0 þma3; or C ¼ C0 þm�a3c ð14Þ
where C0 is the compliance of the specimen before crack initiation and m and m* are the slopes of the lines that fit the mea-sured compliance against the measured and corrected crack lengths respectively. This approach leads to:
GII ¼3P2ma2
2Bor GII ¼
3P2m�a2c
2Bð15Þ
Fitting C against a3 makes ECM equivalent to MCC for Mode II. Therefore, MCC is not referred to in any standards or pro-tocols for Mode II and was not applied here.
Finite element analysis has also been used to calculate the SERR [27,28]. The Virtual Crack Closure Technique (VCCT) ap-plied here relies on the accurate numerical calculation of the nodal forces at the crack tip (Fxi and Fyi) and the displacementsof the adjacent nodes j and k, as shown in Fig. 1 for a 2-dimensional (2D) model. GI and GII are then calculated as:
GI ¼1
2Da½Fyiðuyj � uykÞ� ð16Þ
GII ¼1
2Da½Fxiðuxj � uxkÞ� ð17Þ
where Da is the increment of the crack which is equal to the element size at the crack tip. In the case of a 3D model, thecalculated GI and GII over the nodes through the width of the specimen are summed to calculate the SERR for the crackopening.

Fig. 1. Nodes at crack tip for VCCT in 2D finite element model.
Y. Zhang et al. / Engineering Fracture Mechanics 77 (2010) 128–143 133
3D finite element models were established for the DCB and ELS specimens using the software ANSYS (v. 10). In order toallow crack propagation inside the adherends (as observed during the experiments), the GFRP laminate was modeled as alayered solid, considering the roving, mat and veil layers of each laminate (see Section 3 for laminate composition). Themechanical properties of each layer were calculated based on the fiber volume fraction and estimated layer thickness. A typ-ical crack, as schematically illustrated in Fig. 1, was introduced in the FEA models between the outer layers of the adherendwhere crack propagation was observed. The element type SOLID45 was used and, based on a parametric study, a mesh size of5 mm for the crack increment (Da) was selected for both joint types. In order to avoid the mutual penetration of the adh-erends in Mode II fracture, the correlated contact (CONTA174) and target (TARGE170) elements were employed for thetwo crack surfaces. The DCB model comprised 3250 elements and the ELS model 5520 elements. The boundary conditionsof the testing configuration were simulated. A line load across the width was applied on the top of the upper adherend ofboth joint types. Experimental load values corresponding to arbitrarily selected crack lengths were used as input for calcu-lation of the corresponding nodal displacements and forces.
3. Experimental setup
DCB and ELS specimens composed of pultruded GFRP laminates bonded by an epoxy adhesive system were manufactured.The pultruded GFRP laminates (supplied by Fiberline A/S, Denmark) consisted of E-glass fibers embedded in an isophthalicpolyester resin and had a width of 50 mm and thickness of 6 mm. The GFRP laminate comprised a roving layer in the middlewith mat layers on each side, which consisted of a chopped strand mat (CSM) and a 0�/90� woven mat stitched together.Below the surface, a polyester veil (40 g/m2) had been added to protect against an aggressive environment. The fiber contentwas 48.5 vol.% or 69.4 wt.%. The mean tensile strength of the laminates was 283 MPa, the Young’s modulus 31.4 GPa, and theflexural modulus 14.2 GPa. The mean tensile strength of the epoxy adhesive (SikaDur 330, Sika AG Switzerland) was38.1 MPa, and the Young’s modulus 4.6 GPa.
The total lengths of the DCB and ELS specimens were 250 mm and 400 mm respectively, see Figs. 2 and 3. All bonded sur-faces were mechanically abraded with sandpaper (grit class P80) using a grinder and then chemically degreased using ace-tone. A special aluminum frame was designed to ensure a constant adhesive thickness of 2 mm and good alignment of the
Fig. 2. Geometrical configuration for DCB (dimensions in [mm]).

Fig. 3. Geometrical configuration for ELS (dimensions in [mm]).
134 Y. Zhang et al. / Engineering Fracture Mechanics 77 (2010) 128–143
laminates. All specimens, 5 DCBs and 5 ELSs, were cured under ambient laboratory conditions (approx. 23 �C and 50% RH) forten days.
A pair of steel piano-hinged loading blocks was bonded to the DCB specimens with a 0.5 mm-thick layer of the sameadhesive as that used for the specimens, see Figs. 2 and 4. A 25 mm pre-crack, a0, as measured from the loading axis, wascreated during specimen fabrication by inserting a 50 mm-long Teflon film of 0.05 mm thickness between the lower GFRPlaminate and the adhesive layer. Mode I tests were performed on a 5 kN testing rig under displacement control at a constantrate of 1 mm/min. Load, displacement and crack length were recorded.
The experimental setup for Mode II is shown in Figs. 3 and 5. The 150 mm-long end part of the ELS specimens wasclamped, allowing horizontal movement of the system during loading. A 40 mm-long loading block was bonded onto theupper surface by means of a 0.5 mm-thick adhesive layer. The free length, from the clamping edge to the loading axis,was 230 mm. A pre-crack of 140 mm length (designated a0 in Fig. 3) was created during specimen fabrication by insertinga 160 mm-long Teflon layer between the lower laminate and the adhesive. The experiments were carried out under displace-ment control at a loading rate of 1 mm/min. Load, displacement and crack length were recorded.
Two methods were used to measure the crack length: visual observation and a video extensometer. For the former, ver-tical lines were drawn at 5 mm intervals on the lateral surface of the specimen, which were intersected by the propagatingcrack and, thus allowing the crack length to be recorded. For the video extensometer method, pairs of black dots weremarked at equal intervals on the lateral surface of the specimen, see Fig 4. The displacement of these dots was recorded witha frequency of 1 Hz by a camera. Simple processing of the recorded data provided the estimation of the crack length as afunction of load and displacement. The video extensometer was employed for three DCB (DCB03-05) and three ELS(ELS03-05) joints while visual observation was used for the remaining two DCB (DCB01-02) and all ELS (ELS01-05) speci-mens. For technical reasons, it was not possible to use both methods together for the DCB specimens.
4. Experimental results
4.1. Failure modes
In Mode I fracture, the dominant failure was a fiber-tear failure in the mat layer of the GFRP laminates, as shown in Fig. 6.According to results presented in [29], fiber-tear failure in pultruded GFRP profiles occurs because the through-thickness
Fig. 4. Experimental setup for Mode I fracture (DCB03).

Fig. 5. Experimental setup for Mode II fracture (ELS03).
Fig. 6. Failure mode of DCB01.
Y. Zhang et al. / Engineering Fracture Mechanics 77 (2010) 128–143 135
tensile strength of the laminate is lower than that of the adhesive-laminate interface. As a result, the crack-bridging fibers ofthe woven or random chopped mat layer were pulled out of the polyester matrix.
The same failure mode was observed in most of the Mode II tests (ELS02, ELS03 and ELS05), see Fig. 7. The crack initiatedand propagated in the mat layer of the GFRP laminate almost up to the clamping region. In specimens ELS01 and ELS04, how-ever, the crack, after initiating in the mat layer, propagated deeper into the roving layer, as shown in Fig. 8. In view of thisdifferent failure mode, the results of these specimens were taken into account only for crack initiation.
4.2. Load–displacement response
The load–displacement response of the DCB specimens is shown in Fig. 9. The loading was manually stopped when thecrack length reached 150 mm. All curves followed a linearly increasing trend up to the maximum load and then decreased.The effect of fiber-bridging was expressed by a saw pattern of the descending branch. The alternating increasing anddecreasing segments of this pattern corresponded to alternating phases of crack initiation and crack arrest. There wasone exception (DCB04) where a sudden drop in load occurred when the displacement reached approximately 13 mm, afterwhich the crack propagated through the adhesive layer. Measurements for DCB04 after this 13 mm displacement were nottaken into account in the subsequent calculations.
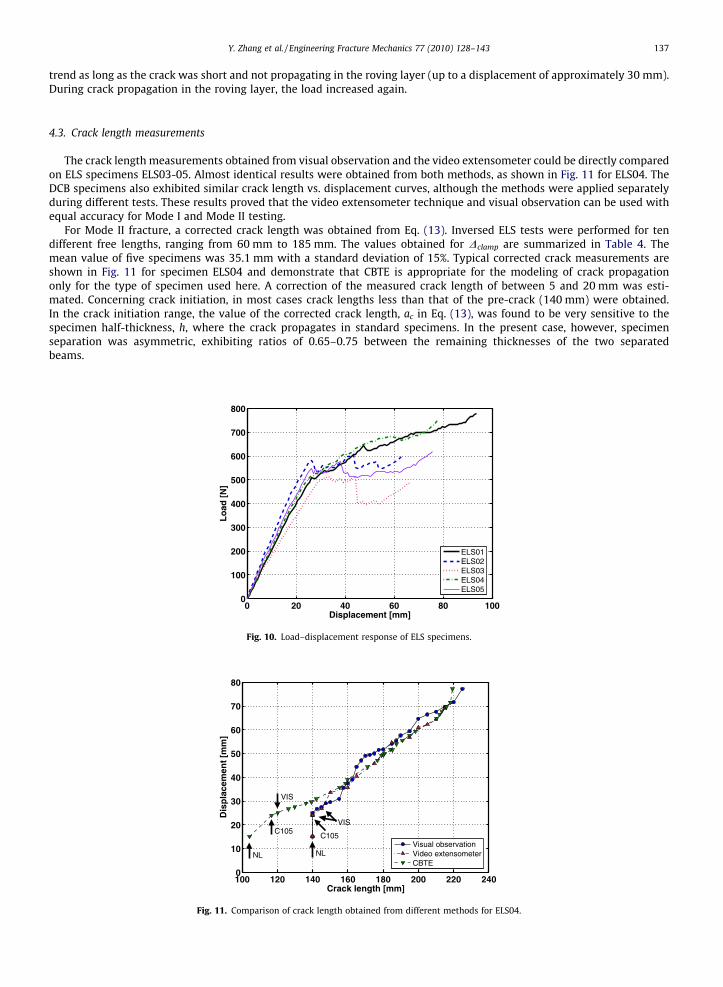
The load–displacement response of the ELS specimens is shown in Fig. 10. For specimens ELS02/03/05, where the crackpath remained in the mat layer, the response exhibited an almost linearly increasing trend until the maximum load wasreached. During crack propagation, the load fluctuated around 550 N and then increased again for displacements of morethan 55–60 mm because the crack tip approached the fixed end. Specimens ELS01/04 followed the same load–displacement

Fig. 7. Failure mode of ELS03 (crack in mat layer).
Fig. 8. Failure mode of ELS01 (crack in roving layer).
0 10 20 30 40 500
100
200
300
400
500
600
Displacement [mm]
Lo
ad [
N]
DCB01DCB02DCB03DCB04DCB05
Fig. 9. Load–displacement response of DCB specimens.
136 Y. Zhang et al. / Engineering Fracture Mechanics 77 (2010) 128–143
Y. Zhang et al. / Engineering Fracture Mechanics 77 (2010) 128–143 137
trend as long as the crack was short and not propagating in the roving layer (up to a displacement of approximately 30 mm).During crack propagation in the roving layer, the load increased again.
4.3. Crack length measurements
The crack length measurements obtained from visual observation and the video extensometer could be directly comparedon ELS specimens ELS03-05. Almost identical results were obtained from both methods, as shown in Fig. 11 for ELS04. TheDCB specimens also exhibited similar crack length vs. displacement curves, although the methods were applied separatelyduring different tests. These results proved that the video extensometer technique and visual observation can be used withequal accuracy for Mode I and Mode II testing.
For Mode II fracture, a corrected crack length was obtained from Eq. (13). Inversed ELS tests were performed for tendifferent free lengths, ranging from 60 mm to 185 mm. The values obtained for Dclamp are summarized in Table 4. Themean value of five specimens was 35.1 mm with a standard deviation of 15%. Typical corrected crack measurements areshown in Fig. 11 for specimen ELS04 and demonstrate that CBTE is appropriate for the modeling of crack propagationonly for the type of specimen used here. A correction of the measured crack length of between 5 and 20 mm was esti-mated. Concerning crack initiation, in most cases crack lengths less than that of the pre-crack (140 mm) were obtained.In the crack initiation range, the value of the corrected crack length, ac in Eq. (13), was found to be very sensitive to thespecimen half-thickness, h, where the crack propagates in standard specimens. In the present case, however, specimenseparation was asymmetric, exhibiting ratios of 0.65–0.75 between the remaining thicknesses of the two separatedbeams.
0 20 40 60 80 1000
100
200
300
400
500
600
700
800
Displacement [mm]
Lo
ad [
N]
ELS01ELS02ELS03ELS04ELS05
Fig. 10. Load–displacement response of ELS specimens.
100 120 140 160 180 200 220 2400
10
20
30
40
50
60
70
80
Crack length [mm]
Dis
pla
cem
ent
[mm
]
Visual observationVideo extensometerCBTE
NL NL
C105
VIS
C105
VIS
Fig. 11. Comparison of crack length obtained from different methods for ELS04.

Table 4Values of correction factors DI and Dclamp and back-calculated flexural modulus Ef .
Specimen number DCB ELS
DI (mm) Eqs. (4)–(6) Ef (GPa) Eq. (6) Dclamp (mm) Eq. (13)
1 25.7 23.2 29.32 15.2 14.3 43.33 19.8 16.2 32.34 10.9 12.4 37.35 15.6 14.2 33.5
Mean 17.4 ± 5.6 16.1 ± 4.2 35.1 ± 5.4
138 Y. Zhang et al. / Engineering Fracture Mechanics 77 (2010) 128–143
4.4. Effect of specimen asymmetry on fracture mode
The crack location was approximately 1.5 mm below the symmetry axis of the 14 mm-thick specimen (0.5 mm inside theadherend). The effect of this asymmetry on the fracture modes was qualitatively and quantitatively examined by using thevideo extensometer and FEA results for both facture modes.
The through-thickness relative displacement between the two beams of the joint is related to crack opening, i.e. to theMode I fracture component, while the in-plane relative displacement or sliding is related to the Mode II facture component.As shown in Fig. 12 for a representative DCB specimen, the change in the relative in-plane displacement (up to 0.5 mm) wasmuch smaller than the displacement increase in the through-thickness direction (up to 40 mm). Therefore, the Mode II frac-ture component can be considered negligible for DCB specimens.
0 50 100 150−5
0
5
10
15
20
25
30
35
40
45
50
Crack length [mm]
Dis
tan
ce b
etw
een
po
ints
[m
m]
HorizontalVertical
Fig. 12. Fracture mode components of DCB03 from video extensometer.
170 180 190 200 210 220 2307
7.2
7.4
7.6
7.8
8
8.2
8.4
8.6
8.8
9
Crack length [mm]
Dis
tan
ce b
etw
een
po
ints
[m
m]
d1
d2
Fig. 13. Fracture mode components of ELS03 from video extensometer.

Y. Zhang et al. / Engineering Fracture Mechanics 77 (2010) 128–143 139
Concerning Mode II, distances d1 and d2 between two adjacent pairs of dots were measured, see Fig. 13. Their difference(d1�d2) remained constant during crack propagation, indicating that no relative through-thickness displacement occurredbetween the two adjacent dots. The increase of the absolute distances d1 and d2 results from the sliding component. Accord-ingly, the Mode I fracture component can be disregarded for ELS specimens. FEA results based on Eqs. (16) and (17) con-firmed these results. The GII component for the DCB specimens and the GI component for the ELS specimens were foundto be less than 1%. This result, however, is in contradiction to the results in [7] for the delamination of thin glass/epoxy lam-inates. For a thickness ratio of 0.78 of the two beams of an asymmetric DCB specimen, the GII component, estimated from FEAanalysis, was approximately 8% of GI. However, as pointed out in [7], the results are strongly dependent on the examinedmaterial.
5. Experimental data reduction
5.1. Identification of crack initiation and propagation
Typical load displacement curves for DCB and ELS specimens are shown in Fig. 14. The loads corresponding to crack ini-tiation (NL, VIS, C105 and Max) are shown in Table 5. The NL and C105 values were directly derived from the load–displace-ment response, which was linear up to approximately 60% of the maximum load Pmax. The C105 value was obtained atapproximately 65% of Pmax for Mode I and 90% of Pmax for Mode II. C105 values were always lower than Pmax and were there-fore used for the calculation of GC. VIS values, corresponding to the first measureable crack length (either by visual observa-tion or video extensometer), were always higher than NL and C105 values and reached approximately 95% of Pmax for bothfracture modes. These results indicate that even very short and visually undetectable cracks can affect specimen stiffness.Values higher than the VIS values were attributed to crack propagation. For both Mode I and Mode II fractures, good corre-lation between the results for all specimens was observed with the highest standard deviation being of the order of 15%.
5.2. Calculation of compliance
The analytically and numerically calculated values for compliance from Eqs. (2), (4), (9), (11), (14) were compared to theexperimentally derived values for both Mode I and Mode II experiments. Typical results are shown in Figs. 15 and 16 for
0 10 20 30 40 50 60 700
100
200
300
400
500
600
Displacement [mm]
Lo
ad [
N]
ExperimentalCrack initiationCrack propagationMaximum
C105NL
MAX
VIS
C105
NL
MAXVIS
DCB03
ELS03
Fig. 14. Load–displacement response of DCB03/ELS03 with indicated crack initiation (from different methods) and propagation.
Table 5Comparison of mean loads corresponding to NL, C105, VIS and MAX for DCB and ELS tests (mean values and standard deviation for five specimens).
Load [N] at DCB ELS
NL 327.0 ± 36.2 354.0 ± 57.6C105 405.0 ± 60.0 493.0 ± 24.1VIS 501.0 ± 33.9a 523.1 ± 34.5a
462.4 ± 65.0b 511.8 ± 17.8b
MAX 505.1 ± 42.9 559.7 ± 34.2c
a Visual observation.b Video extensometer.c Based on specimens (ELS02, 03, 05).

0 50 100 150 2000
0.02
0.04
0.06
0.08
0.1
0.12
0.14
0.16
0.18
Crack length [mm]
Co
mp
lian
ce [
mm
/N]
ExperimentalSBTCBTECMMCCFEA
Fig. 15. Comparison between calculated compliance (from different methods) and experimental values for DCB03.
140 160 180 200 2200.02
0.04
0.06
0.08
0.10
0.12
0.14
0.16
Crack length [mm]
Co
mp
lian
ce [
mm
/N]
ExperimentalSBTCBTCBTEECMFEA
Fig. 16. Comparison between calculated compliance (from different methods) and experimental values for ELS05.
140 Y. Zhang et al. / Engineering Fracture Mechanics 77 (2010) 128–143
Mode I and II respectively. Compliance increases with increasing crack length. However, a different trend is exhibited in thetwo fracture modes. During Mode I fracture, the compliance increase accelerates with crack opening, whereas in Mode II thetrend is linear up to failure. A comparison of the applied theoretical methods shows that ECM and MCC always providedthe most accurate results, since these methods are based on the experimentally derived compliance. SBT always underesti-mated the measured values owing to the deficiencies of this method referred to above. The 3D FEA results were accurate forMode I fracture, but underestimated the results for Mode II, especially short crack lengths. For Mode II fracture (see Fig. 16),the values obtained from CBTE did not compare well to the experimental results because of the inaccurate crack lengthcalculation by CBTE.
For Mode I fracture, DI values for correction of the measured crack length and the back-calculated stiffness Ef are sum-marized in Table 4. In accordance with [12,16], a slightly higher value of Ef was observed when compared to the indepen-dently measured bending stiffness, Es, (16.1 vs. 14.2 GPa). Furthermore, higher values of DI were estimated for stifferspecimens. Table 4 further shows that Dclamp � 2DI (for mean values over five specimens). Although CBTE is based on thisrelationship, it was not always attained due to the different clamping conditions used for DCB and ELS specimens[19]. The correction factor for the measured crack length in CBT, DII = 0.42DI, was calculated using the mean value of DI
in Table 4.
5.3. Estimation of GI and GIC
The SERR values for Mode I fracture, GI, were calculated using Eqs. (3), (5), (7), (8), (16). A typical R-curve, obtained forDCB03, is shown in Fig. 17. GI increased with an increasing crack length of up to approximately 100 mm and then approacheda plateau for longer crack lengths. A critical SERR for propagation, GIC, was attributed to this plateau region. The resultingvalues of GIC for crack initiation and propagation are listed in Table 6. Similar values were obtained from CBT, ECM and

0 50 100 150 2000
500
1000
1500
2000
2500
3000
Crack length [mm]
Str
ain
en
erg
y re
leas
e ra
te [
J/m
2 ]
SBTCBTECMMCCFEA
Fig. 17. Comparison of strain energy release rates obtained from different methods for DCB03.
Table 6GIC for crack initiation (NL, C105 and VIS) and propagation using SBT, CBT, ECM, MCC and FEA (mean values and standard deviation for five DCB specimens).
GIC (J/m2) at SBT Eq. (3) CBT Eq. (5) ECM Eq. (7) MCC Eq. (8) FEA Eq. (16)
NL 68.2 ± 14.9 189.9 ± 60.2 250.7 ± 60.4 181.0 ± 46.6 116.1 ± 25.3C105 105.5 ± 32.4 333.3 ± 156.1 441.8 ± 190.4 303.7 ± 122.9 179.4 ± 55.0VISa 227.2 ± 30.7 684.7 ± 324.8 870.5 ± 340.5 602.4 ± 225.7 367.2 ± 49.6VISb 195.6 ± 53.0 575.3 ± 159.4 702.0 ± 178.0 517.8 ± 134.7 316.1 ± 85.7Propagation 1537.1 ± 535.7 1674.1 ± 372.2 1505.9 ± 330.1 1667.0 ± 375.2 1982.7 ± 688.6
a Visual observation.b Video extensometer.
Y. Zhang et al. / Engineering Fracture Mechanics 77 (2010) 128–143 141
MCC methods, while SBT showed significantly lower values as expected. The FEA results were situated between the firstgroup and SBT for crack initiation, but overestimated crack propagation values, mainly because the large displacements werenot taken into account in the FEA results.
Summarizing the results obtained from the five methods, the GIC values for crack initiation were between 70 J/m2 and250 J/m2 at NL, while two to three times higher values were obtained at C105 and VIS. Starting from VIS, GI values duringcrack propagation increased from approximately 230 J/m2 to 1980 J/m2. The values corresponding to the plateau-like region(crack lengths between 100 and 150 mm), were approximately 1670 ± 460 J/m2 (mean and standard deviation calculated byall methods).
5.4. Estimation of GII and GIIc
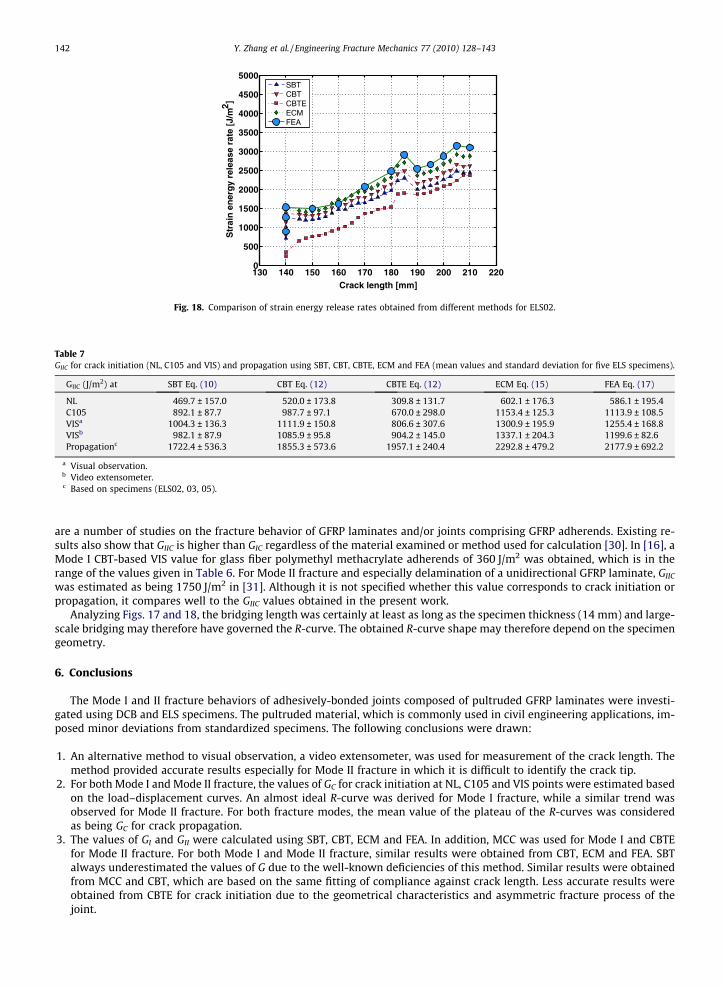
The SERR values for Mode II fracture, GII, were estimated from Eqs. (10), (12), (15), (17). Fig. 18 shows a typical R-curve,obtained for ELS02, which shows an increasing trend up to a crack length of approximately 185 mm and then seems to ap-proach a plateau. Crack lengths of up to 210 mm (of specimens ELS02/03/05, see Section 4.1) were considered, which wereassumed as not yet being affected by the clamp region. GIIC values for crack initiation and values obtained for the plateau-likeregion of the R-curve are listed in Table 7. Similar values were obtained from CBT and ECM. Although FEA produced lowervalues in terms of compliance (see Fig. 16), it provided the highest SERR values of all the methods due to the sharper slope ofthe compliance vs. crack length curve. SERR results obtained from CBTE were inaccurate for crack initiation, being much low-er than those derived from all other methods due to the erroneous crack length estimation. The crack propagation valueswere in the same range as all the other results however.
The GIIC values for crack initiation at NL values were in the range between 470 J/m2 and 600 J/m2 (see Table 7, excludingCBTE). Values approximately two times higher were obtained at C105 and VIS, whichever method was used. The value of GIIC
for propagation was 2000 ± 500 J/m2 (mean and standard deviation calculated by all methods).
5.5. Comparison of GIC, GIIC and results in literature
The comparison of Mode I and Mode II fracture energies shows that GIIC is always higher than GIC. For crack initiation, theratio between the two values is between 2 and 3, while for crack propagation the ratio is approximately 1.2. To the authors’knowledge, no other similar results (concerning the fracture of pultruded GFRP joints) exist in the literature. However, there
130 140 150 160 170 180 190 200 210 2200
500
1000
1500
2000
2500
3000
3500
4000
4500
5000
Crack length [mm]
Str
ain
en
erg
y re
leas
e ra
te [
J/m
2 ]
SBTCBTCBTEECMFEA
Fig. 18. Comparison of strain energy release rates obtained from different methods for ELS02.
Table 7GIIC for crack initiation (NL, C105 and VIS) and propagation using SBT, CBT, CBTE, ECM and FEA (mean values and standard deviation for five ELS specimens).
GIIC (J/m2) at SBT Eq. (10) CBT Eq. (12) CBTE Eq. (12) ECM Eq. (15) FEA Eq. (17)
NL 469.7 ± 157.0 520.0 ± 173.8 309.8 ± 131.7 602.1 ± 176.3 586.1 ± 195.4C105 892.1 ± 87.7 987.7 ± 97.1 670.0 ± 298.0 1153.4 ± 125.3 1113.9 ± 108.5VISa 1004.3 ± 136.3 1111.9 ± 150.8 806.6 ± 307.6 1300.9 ± 195.9 1255.4 ± 168.8VISb 982.1 ± 87.9 1085.9 ± 95.8 904.2 ± 145.0 1337.1 ± 204.3 1199.6 ± 82.6Propagationc 1722.4 ± 536.3 1855.3 ± 573.6 1957.1 ± 240.4 2292.8 ± 479.2 2177.9 ± 692.2
a Visual observation.b Video extensometer.c Based on specimens (ELS02, 03, 05).
142 Y. Zhang et al. / Engineering Fracture Mechanics 77 (2010) 128–143
are a number of studies on the fracture behavior of GFRP laminates and/or joints comprising GFRP adherends. Existing re-sults also show that GIIC is higher than GIC regardless of the material examined or method used for calculation [30]. In [16], aMode I CBT-based VIS value for glass fiber polymethyl methacrylate adherends of 360 J/m2 was obtained, which is in therange of the values given in Table 6. For Mode II fracture and especially delamination of a unidirectional GFRP laminate, GIIC
was estimated as being 1750 J/m2 in [31]. Although it is not specified whether this value corresponds to crack initiation orpropagation, it compares well to the GIIC values obtained in the present work.
Analyzing Figs. 17 and 18, the bridging length was certainly at least as long as the specimen thickness (14 mm) and large-scale bridging may therefore have governed the R-curve. The obtained R-curve shape may therefore depend on the specimengeometry.
6. Conclusions
The Mode I and II fracture behaviors of adhesively-bonded joints composed of pultruded GFRP laminates were investi-gated using DCB and ELS specimens. The pultruded material, which is commonly used in civil engineering applications, im-posed minor deviations from standardized specimens. The following conclusions were drawn:
1. An alternative method to visual observation, a video extensometer, was used for measurement of the crack length. Themethod provided accurate results especially for Mode II fracture in which it is difficult to identify the crack tip.
2. For both Mode I and Mode II fracture, the values of GC for crack initiation at NL, C105 and VIS points were estimated basedon the load–displacement curves. An almost ideal R-curve was derived for Mode I fracture, while a similar trend wasobserved for Mode II fracture. For both fracture modes, the mean value of the plateau of the R-curves was consideredas being GC for crack propagation.
3. The values of GI and GII were calculated using SBT, CBT, ECM and FEA. In addition, MCC was used for Mode I and CBTEfor Mode II fracture. For both Mode I and Mode II fracture, similar results were obtained from CBT, ECM and FEA. SBTalways underestimated the values of G due to the well-known deficiencies of this method. Similar results were obtainedfrom MCC and CBT, which are based on the same fitting of compliance against crack length. Less accurate results wereobtained from CBTE for crack initiation due to the geometrical characteristics and asymmetric fracture process of thejoint.

Y. Zhang et al. / Engineering Fracture Mechanics 77 (2010) 128–143 143
4. Calculated using the same method, the values of GIIC for crack initiation and propagation were always higher than thevalues of GIC. The values of GIC and GIIC were in agreement with similar results obtained in previous studies for comparablematerials.
5. The asymmetry of the cracked specimens did not affect the results, except for the calculation of the corrected crack lengthand the subsequent GII calculations based on the CBTE in the crack initiation range. Less than 1% of Mode II fracture com-ponent was found in DCB specimens and the same proportion of Mode I fracture component was found in ELS specimens.
6. Based on the aforementioned results, the applicability of existing standard methods and protocols for interpretation ofthe fracture mechanics data obtained from the fracture joints used in these experiments was validated. Due to large-scalebridging, however, the obtained R-curve shape may depend on specimen geometry.
Acknowledgements
The authors would like to thank the Swiss National Science Foundation (Grant No. 200020-111702/1), Sika AG, Zurich(adhesive supplier) and Fiberline Composites A/S, Denmark (pultruded laminate supplier) for their support of this research.
References
[1] ASTM D3433-99(2005). Standard test method for fracture strength in cleavage of adhesives in bonded metal joints, in annual book of ASTM standards:adhesive section 15.06.
[2] Blackman BRK, Kinloch AJ. Determination of the mode I adhesive fracture energy, GIC, of structural adhesives using the double cantilever beam (DCB)and the tapered double cantilever beam (TDCB) specimens. Version 00-06. ESIS(TC4) Protocol; 2000.
[3] ASTM D5528-01(2007). Standard test method for mode I interlaminar fracture toughness of unidirectional fiber-reinforced polymer matrixcomposites, in annual book of ASTM standards: adhesive section 15.03.
[4] ISO 15024:2000(E). Standard test method for the mode I interlaminar fracture toughness, GIIC, of unidirectional fibre-reinforced polymer matrixcomposites.
[5] ASTM, ASTM D6671/D6671M-06. Standard test method for mixed mode I–mode II interlaminar fracture toughness of unidirectional fiber reinforcedpolymer matrix composites, in annual book of ASTM standards: adhesive section 15.03.
[6] ESIS Protocol. Determination of the mode II delamination resistance (Critical Energy Release Rate GIIC) of unidirectional fiber-reinforced polymerlaminates using the end-loaded-split specimen (ELS). ESIS(TC4) protocol; 2006.
[7] Ducept F, Gamby D, Davies P. A mixed-mode failure criterion derived from tests on symmetric and asymmetric specimens. Compos Sci Technol1999;59(11):609–19.
[8] Sorensen BF, Jacobsen TK. Large-scale bridging in composites: R-curves and bridging laws. Composites: Part A 1998;29(11):1443–51.[9] Kinloch AJ, Osiyemi SO. Predicting the fatigue life of adhesively-bonded joints. J Adhes. 1993;43(1–2):79–90.
[10] Ashcroft IA, Hughes DJ, Shaw SJ. Mode I fracture of epoxy bonded composite joints: 1. Quasi-static loading. Int J Adhes Adhes 2001;21(2):87–99.[11] Suppakul P, Bandyopadhyay S. The effect of weave pattern on the mode-I Interlaminar fracture energy of E-glass/vinyl ester composites. Compos Sci
Technol 2002;62(5):709–17.[12] Blackman BRK, Kinloch AJ, Paraschi M, Teo WS. Measuring the mode I adhesive fracture energy, GIC, of structural adhesive joints: the results of an
international round-robin. Int J Adhes Adhes 2003;23(4):293–305.[13] Hodzic A, Kim JK, Lowe AE, Stachurski ZH. The effects of water aging on the interphase region and interlaminar fracture toughness in polymer–glass
composites. Compos Sci Technol 2004;64(13–14):2185–95.[14] Ferreira JM, Silva H, Costa JD, Richardson M. Stress analysis of lap joints involving natural fibre reinforced interface layers. Composites: Part B
2005;36(1):1–7.[15] Thanomsilp C, Hogg PJ. Interlaminar fracture toughness of hybrid composites based on commingled yarn fabrics. Compos Sci Technol
2005;65(10):1547–63.[16] Brunner AJ, Blackman BRK, Williams JG. Calculation a damage parameter and bridging stress from GIC delaminating tests on fibre composite. Compos
Sci Technol 2006;66(6):785–95.[17] Mall S. Characterization of debond growth mechanism in adhesively-bonded composites under mode II static and fatigue loadings. Engng Fract Mech
1988;31(5):747–58.[18] Martin RH, Davidson BD. Mode II fracture toughness evaluation using four point bend, end notched flexure test. Plast Rubber Compos
1999;28(8):401–6.[19] Szekrenyes A, Uj J. Beam and finite element analysis of quasi-unidirectional composite SLB and ELS specimens. Compos Sci Technol
2004;64(15):2393–406.[20] Blackman BRK, Kinloch AJ, Paraschi M. The determination of the mode II adhesive fracture resistance, GIIC, of structural adhesive joints: an effective
crack length approach. Engng Fract Mech 2005;72(6):877–97.[21] Blackman BRK, Brunner AJ, Williams JG. Mode II fracture testing of composites: a new look at an old problem. Engng Fract Mech 2006;73(16):2443–55.[22] Keller T. Recent all-composite and hybrid fiber reinforced polymer bridges and buildings. Prog Struct Engng Mater 2001;3(2):132–40.[23] Mostovoy S, Crosley PB, Ripling EJ. Use of crack-line loaded specimens for measuring plane-strain fracture toughness. J Mater 1967;2(3):661–81.[24] Williams JG. End corrections for orthotropic DCB specimens. Compos Sci Technol 1989;35(3):367–76.[25] Wang Y, Williams JG. Correction for mode II fracture toughness specimens of composite materials. Compos Sci Technol 1992;43(3):251–6.[26] Blackman BRK, Kinloch AJ, Paraschi M. The determination of the mode II adhesive fracture resistance, GIIC, of structural adhesive joints: an effective
crack length approach. Engng Fract Mech 2005;72(6):877–97.[27] Rybicki FE, Kaninen MF. A finite element calculation of stress intensity factor by a modified crack closure integral. Engng Fract Mech 1977;9(4):931–8.[28] Dakshina Moorthy CM, Reddy JN. Modelling of laminates using a layerwise element with enhanced strains. Int J Numer Meth Engng
1998;43(4):755–79.[29] Keller T, Vallée T. Adhesively bonded lap joints from pultruded GFRP profiles, Part I: stress–strain analysis and failure modes. Composites: Part B
2005;36(4):331–40.[30] Hashemi S, Kinloch AJ, Williams JG. The analysis of interlaminar fracture in uniaxial fibre-polymer composites. Proc R Soc Lond A
1990;427(1872):173–99.[31] Matsubara G, Ono H, Tanaka K. Mode II fatigue crack growth from delamination in unidirectional tape and satin-woven fabric laminates of high
strength GFRP. Int J Fatigue 2006;28(10):1177–86.