1 ruth weisberg this presentation is dedicated to my friend and neighbor ruth, who, along with many...
Post on 19-Dec-2015
216 views
TRANSCRIPT
1
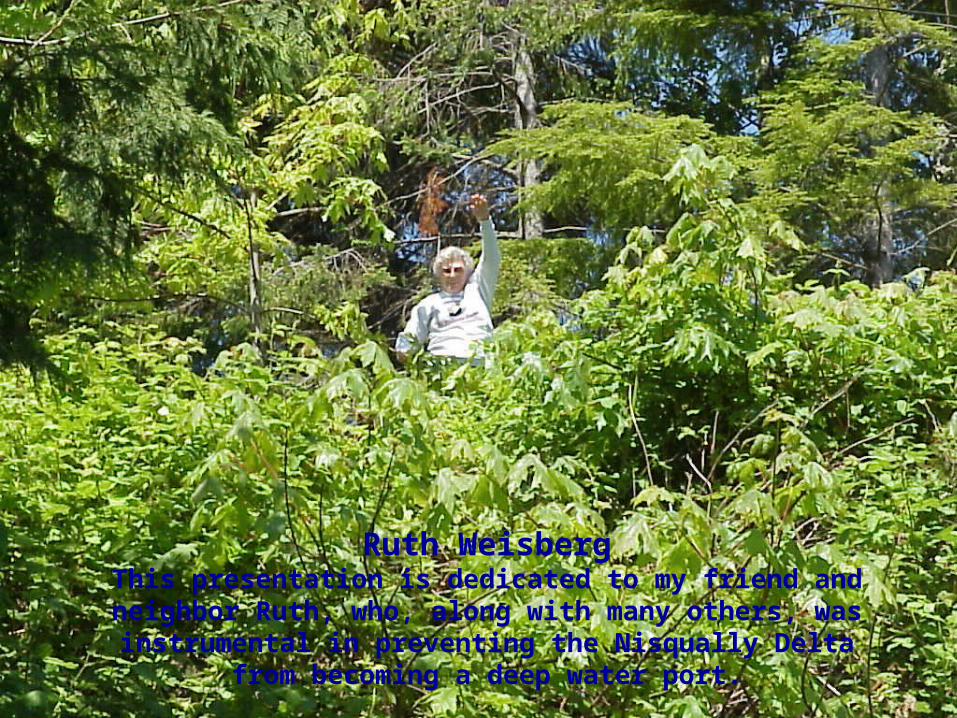
Ruth WeisbergThis presentation is dedicated to my friend and
neighbor Ruth, who, along with many others, was instrumental in preventing the Nisqually Delta from
becoming a deep water port.
2
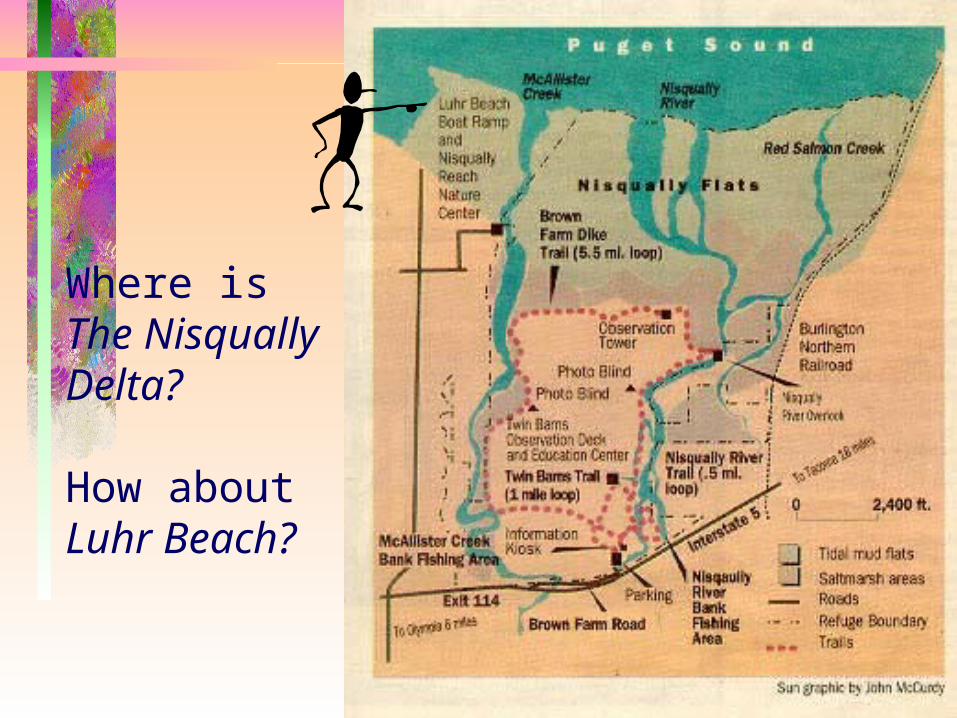
Where isThe Nisqually Delta?
How aboutLuhr Beach?

3
The Nisqually Delta from Luhr Beach
Low tide at one of the last intact estuaries in Puget Sound
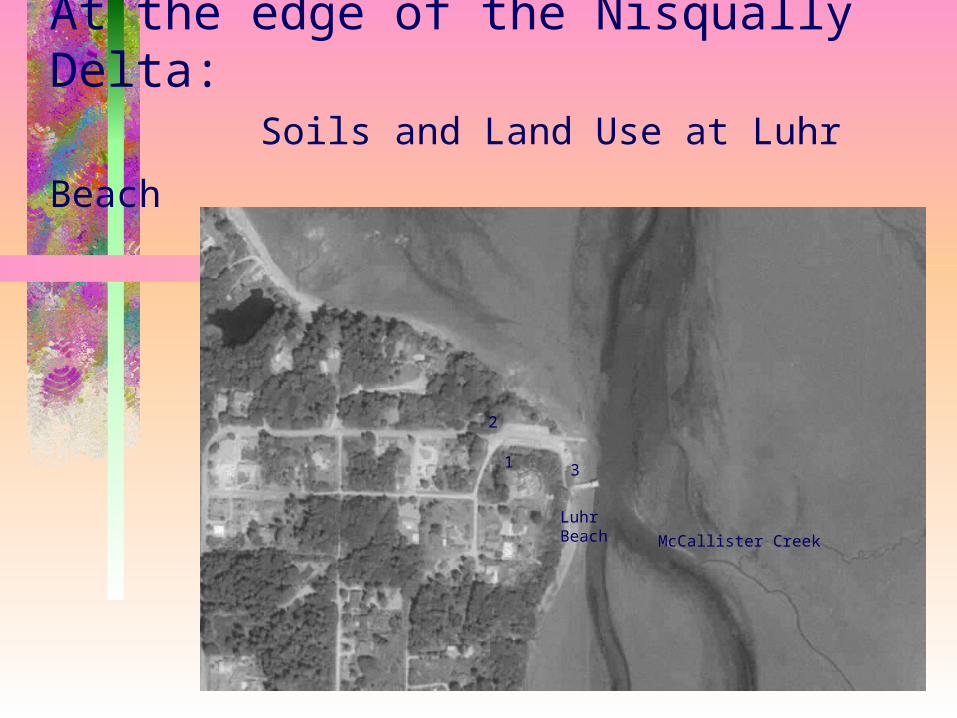
At the edge of the Nisqually Delta: Soils and Land Use at Luhr Beach
McCallister Creek
Luhr Beach
1
2
3
5
1
2
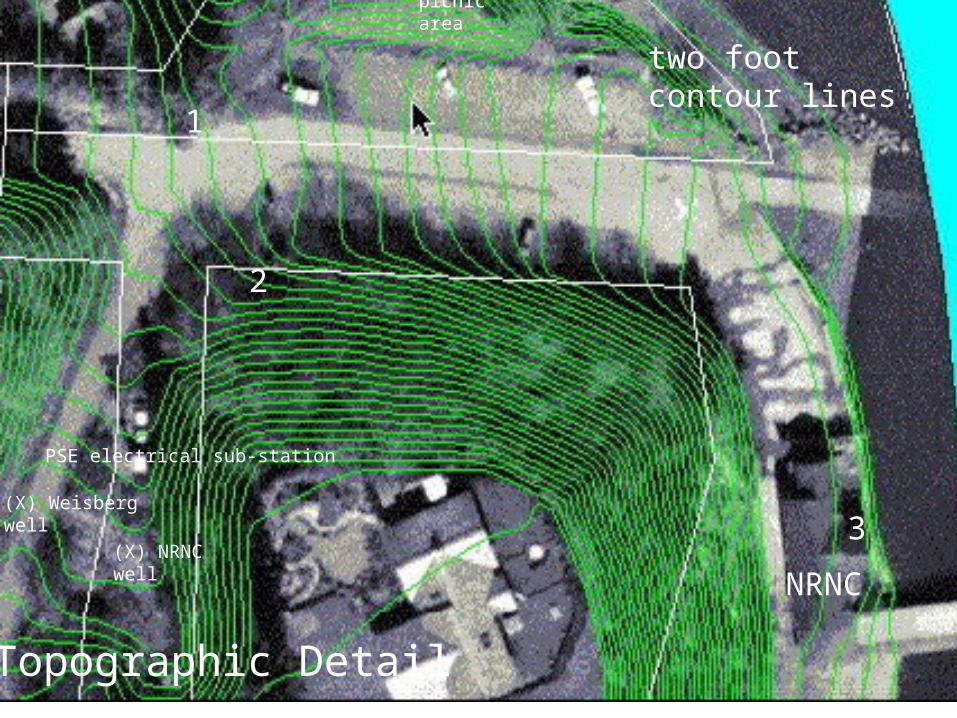
3(X) NRNC well
(X) Weisberg well
two foot contour lines
Topographic Detail
PSE electrical sub-station
NRNC
picnic area
6
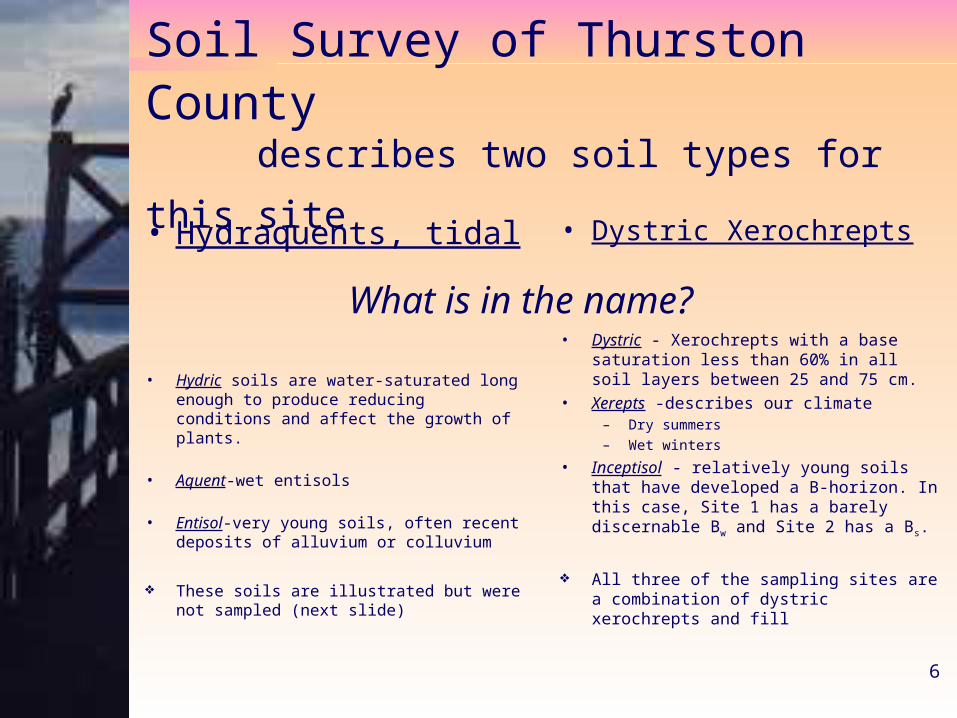
Soil Survey of Thurston County describes two soil types for this site
• Hydraquents, tidal
• Hydric soils are water-saturated long enough to produce reducing conditions and affect the growth of plants.
• Aquent-wet entisols
• Entisol-very young soils, often recent deposits of alluvium or colluvium
These soils are illustrated but were not sampled (next slide)
• Dystric Xerochrepts
• Dystric - Xerochrepts with a base saturation less than 60% in all soil layers between 25 and 75 cm.
• Xerepts -describes our climate– Dry summers– Wet winters
• Inceptisol - relatively young soils that have developed a B-horizon. In this case, Site 1 has a barely discernable Bw and Site 2 has a Bs.
All three of the sampling sites are a combination of dystric xerochrepts and fill
What is in the name?
7
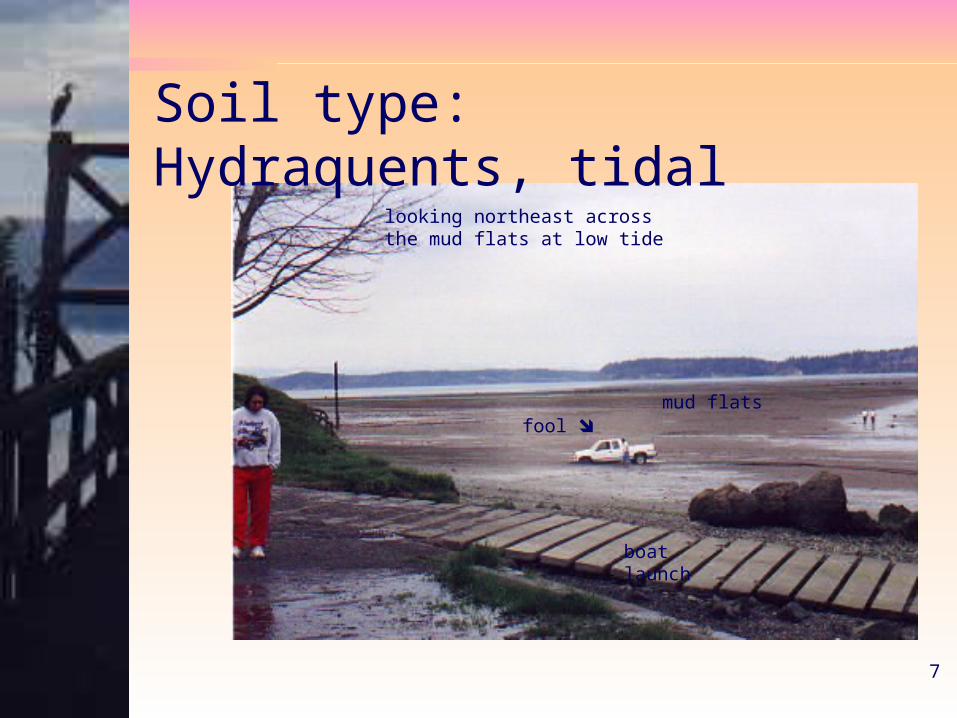
Soil type: Hydraquents, tidal
boat launch
mud flatsfool
looking northeast across the mud flats at low tide
8
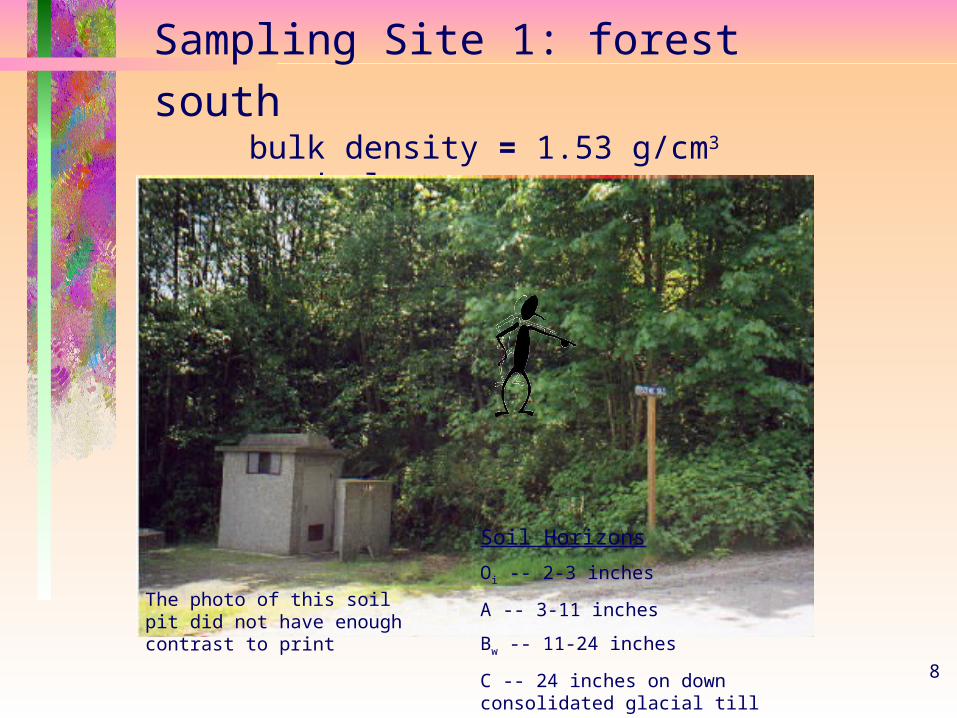
Sampling Site 1: forest south bulk density = 1.53 g/cm3 sandy loam
Soil Horizons
Oi -- 2-3 inches
A -- 3-11 inches
Bw -- 11-24 inches
C -- 24 inches on down consolidated glacial till
The photo of this soil pit did not have enough contrast to print

9
Sampling Site 2: forest north sandy clay loam bulk density =1.29 g/cm3
sample site 2 is behind the large douglas fir
10
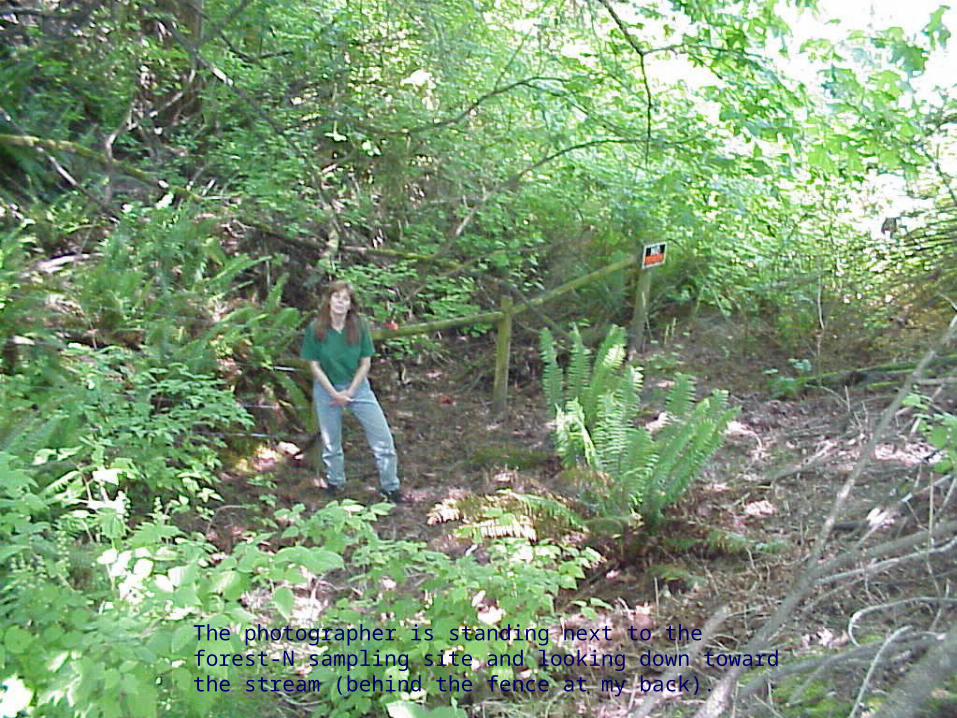
The photographer is standing next to the forest-N sampling site and looking down toward the stream (behind the fence at my back).
11
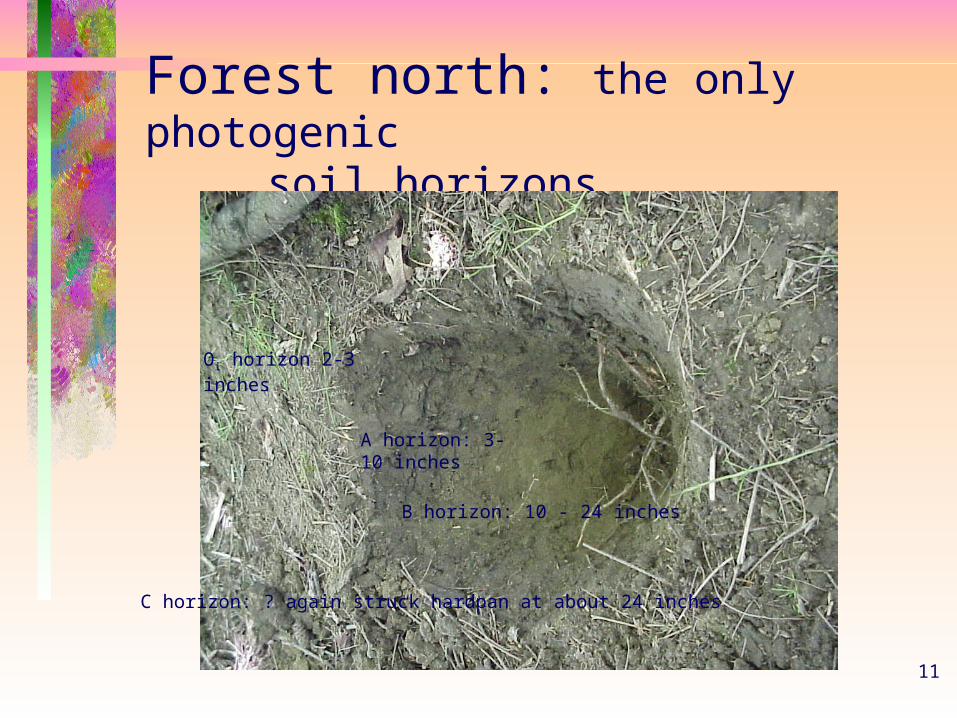
Forest north: the only photogenic soil horizons
Oi horizon 2-3 inches
A horizon: 3-10 inches
B horizon: 10 - 24 inches
C horizon: ? again struck hardpan at about 24 inches
12
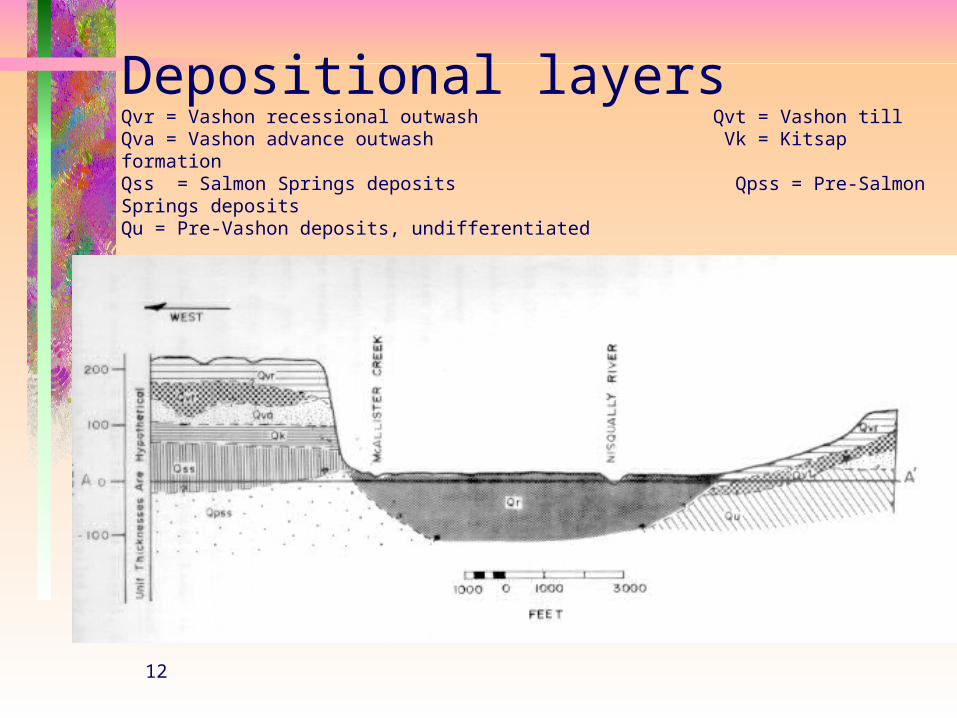
Depositional layers Qvr = Vashon recessional outwash Qvt = Vashon till Qva = Vashon advance outwash Vk = Kitsap formation Qss = Salmon Springs deposits Qpss = Pre-Salmon Springs depositsQu = Pre-Vashon deposits, undifferentiated
13
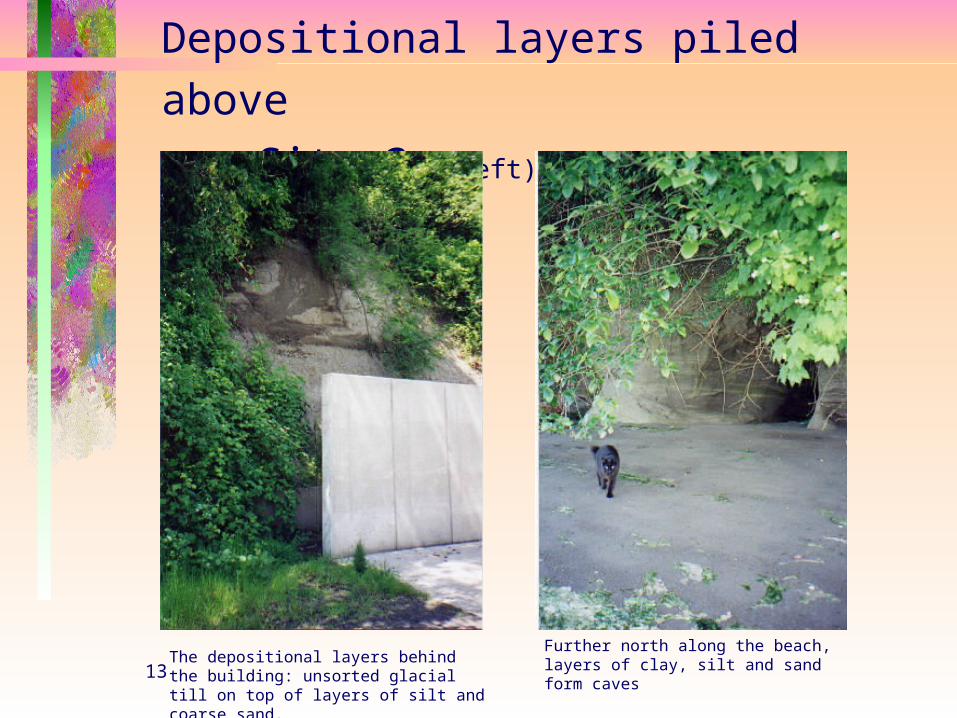
Depositional layers piled above Site 3 (left)
The depositional layers behind the building: unsorted glacial till on top of layers of silt and coarse sand.
Further north along the beach, layers of clay, silt and sand form caves
14
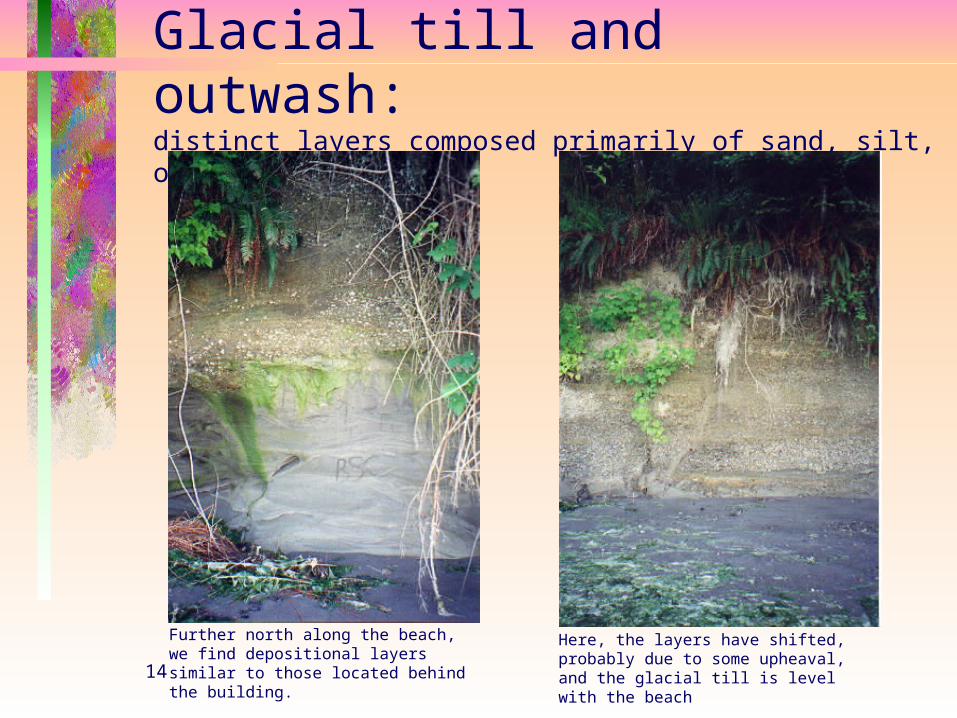
Glacial till and outwash:distinct layers composed primarily of sand, silt, or clay
Further north along the beach, we find depositional layers similar to those located behind the building.
Here, the layers have shifted, probably due to some upheaval, and the glacial till is level with the beach
15
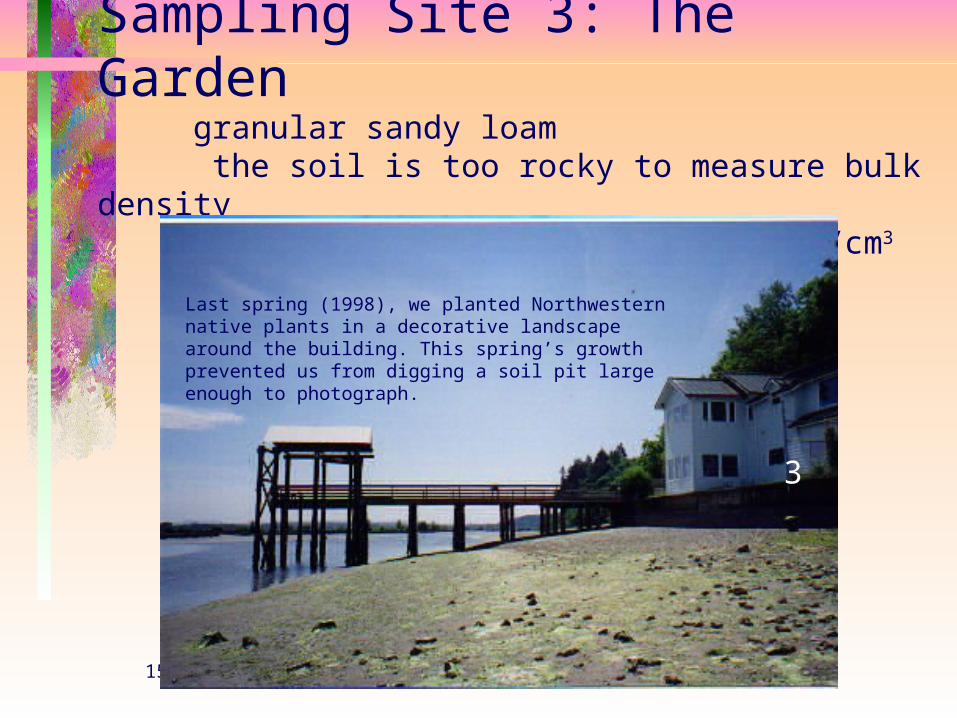
Sampling Site 3: The Gardengranular sandy loam the soil is too rocky to measure bulk density
assume bulk density = 1.53 g/cm3
3
Last spring (1998), we planted Northwestern native plants in a decorative landscape around the building. This spring’s growth prevented us from digging a soil pit large enough to photograph.
16
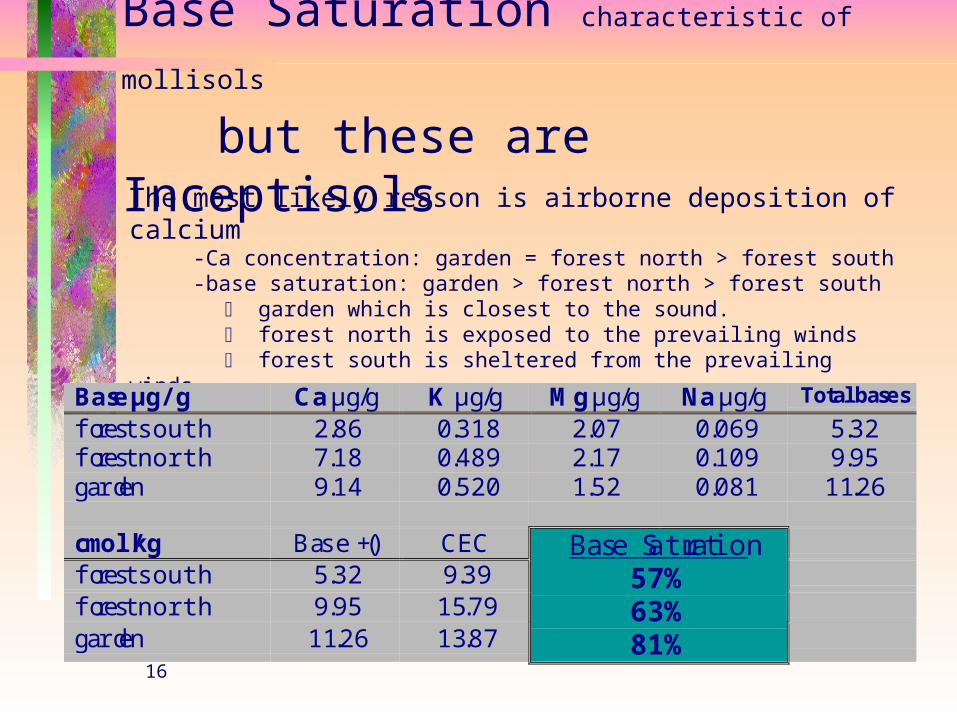
Base Saturation characteristic of mollisols but these are Inceptisols
The most likely reason is airborne deposition of calcium -Ca concentration: garden = forest north > forest south -base saturation: garden > forest north > forest south
garden which is closest to the sound. forest north is exposed to the prevailing winds forest south is sheltered from the prevailing winds
Base µg/g Ca µg/g K µg/g Mg µg/g Na µg/g Total bases
forest south 2.86 0.318 2.07 0.069 5.32forest north 7.18 0.489 2.17 0.109 9.95garden 9.14 0.520 1.52 0.081 11.26
cmol/kg Base (+) CECforest south 5.32 9.39forest north 9.95 15.79garden 11.26 13.87
Base Saturation57%63%81%
17
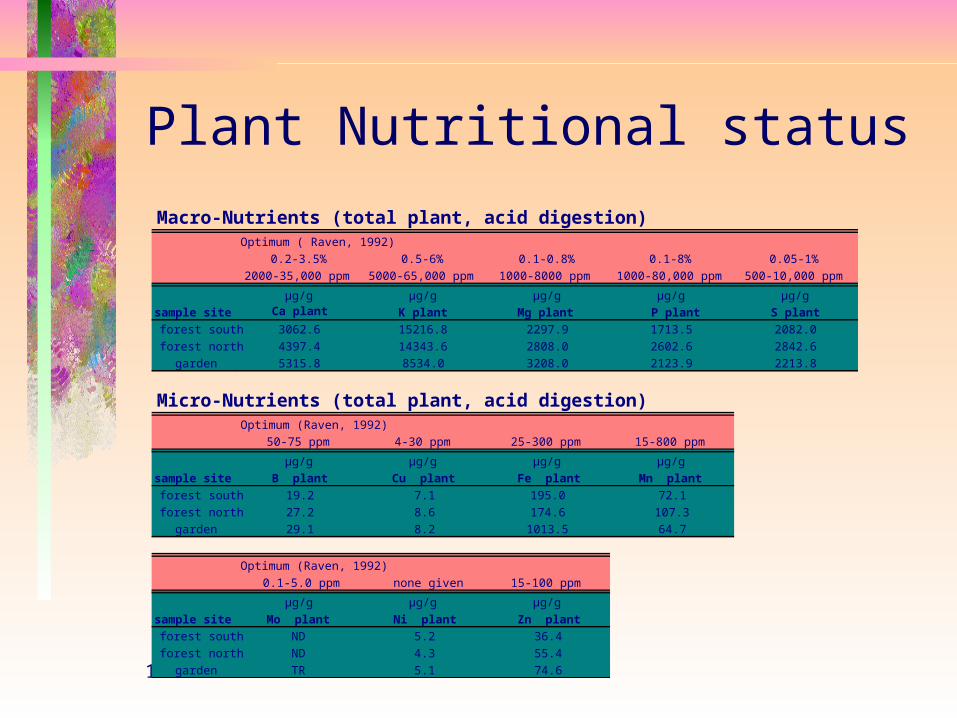
Plant Nutritional status
Macro-Nutrients (total plant, acid digestion)Optimum ( Raven, 1992)
0.2-3.5% 0.5-6% 0.1-0.8% 0.1-8% 0.05-1%2000-35,000 ppm 5000-65,000 ppm 1000-8000 ppm 1000-80,000 ppm 500-10,000 ppm
µg/g µg/g µg/g µg/g µg/gsample site Ca plant K plant Mg plant P plant S plantforest south 3062.6 15216.8 2297.9 1713.5 2082.0forest north 4397.4 14343.6 2808.0 2602.6 2842.6
garden 5315.8 8534.0 3208.0 2123.9 2213.8
Micro-Nutrients (total plant, acid digestion)Optimum (Raven, 1992)
50-75 ppm 4-30 ppm 25-300 ppm 15-800 ppm
µg/g µg/g µg/g µg/gsample site B plant Cu plant Fe plant Mn plantforest south 19.2 7.1 195.0 72.1forest north 27.2 8.6 174.6 107.3
garden 29.1 8.2 1013.5 64.7
Optimum (Raven, 1992)0.1-5.0 ppm none given 15-100 ppm
µg/g µg/g µg/gsample site Mo plant Ni plant Zn plantforest south ND 5.2 36.4forest north ND 4.3 55.4
garden TR 5.1 74.6
18
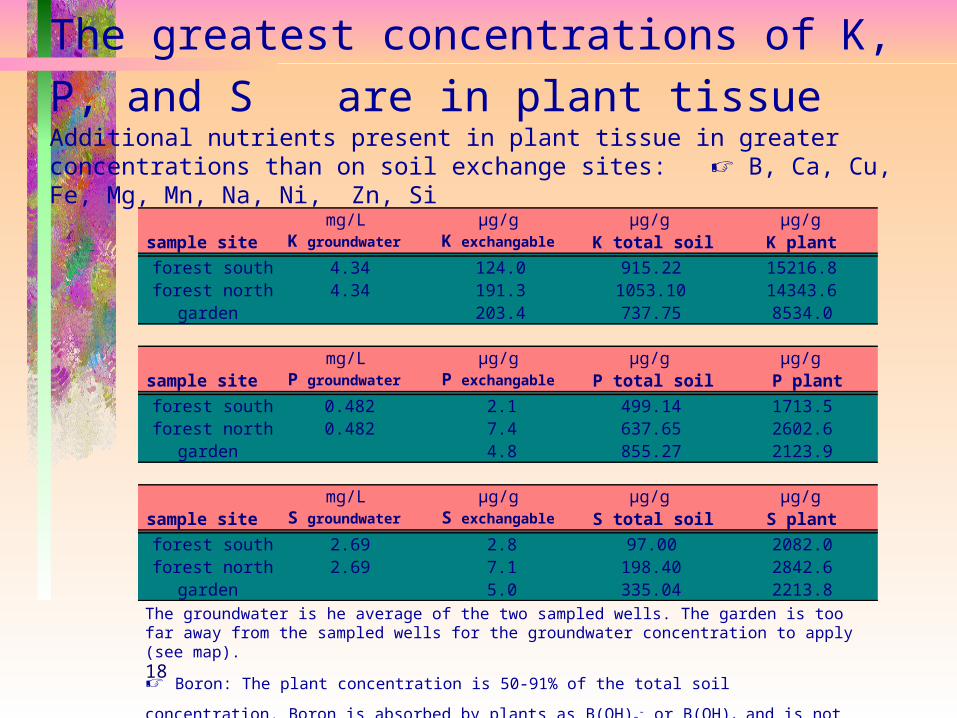
The greatest concentrations of K, P, and S are in plant tissue Additional nutrients present in plant tissue in greater concentrations than on soil exchange sites: B, Ca, Cu, Fe, Mg, Mn, Na, Ni, Zn, Si
mg/L µg/g µg/g µg/gsample site K groundwater K exchangable K total soil K plant
forest south 4.34 124.0 915.22 15216.8forest north 4.34 191.3 1053.10 14343.6
garden 203.4 737.75 8534.0
mg/L µg/g µg/g µg/gsample site P groundwater P exchangable P total soil P plant
forest south 0.482 2.1 499.14 1713.5forest north 0.482 7.4 637.65 2602.6
garden 4.8 855.27 2123.9
mg/L µg/g µg/g µg/gsample site S groundwater S exchangable S total soil S plant
forest south 2.69 2.8 97.00 2082.0forest north 2.69 7.1 198.40 2842.6
garden 5.0 335.04 2213.8The groundwater is he average of the two sampled wells. The garden is too far away from the sampled wells for the groundwater concentration to apply (see map).
Boron: The plant concentration is 50-91% of the total soil concentration. Boron is
absorbed by plants as B(OH)3- or B(OH)4 and is not held on soil exchange sites.
19
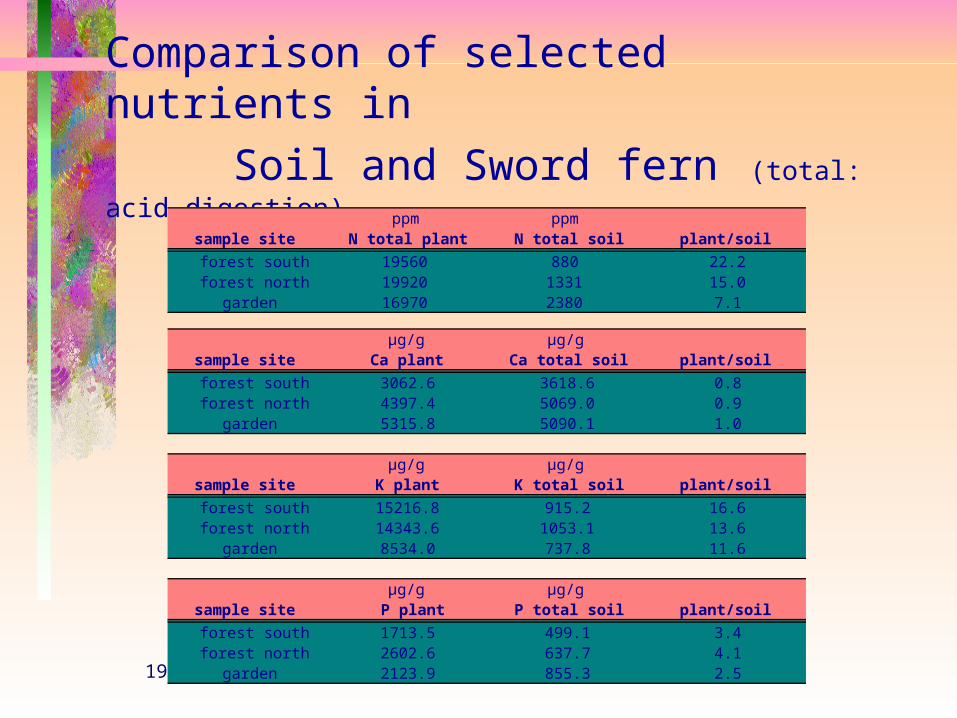
Comparison of selected nutrients in Soil and Sword fern (total: acid digestion)
ppm ppmsample site N total plant N total soil plant/soil
forest south 19560 880 22.2forest north 19920 1331 15.0
garden 16970 2380 7.1
µg/g µg/gsample site Ca plant Ca total soil plant/soil
forest south 3062.6 3618.6 0.8forest north 4397.4 5069.0 0.9
garden 5315.8 5090.1 1.0
µg/g µg/gsample site K plant K total soil plant/soil
forest south 15216.8 915.2 16.6forest north 14343.6 1053.1 13.6
garden 8534.0 737.8 11.6
µg/g µg/gsample site P plant P total soil plant/soil
forest south 1713.5 499.1 3.4forest north 2602.6 637.7 4.1
garden 2123.9 855.3 2.5

20
Aluminum Arsenic and Lead: potentially toxic substances in groundwater, soil, and sword fern
The groundwater is he average of the two sampled wells.
The garden is too far away from the sampled wells for the groundwater concentration to apply (see map).
Arsenic forest south forest north garden
groundwater mg/L 0.16 0.16soil exhange sites µg/g ND ND NDsword fern µg/g 6.2 7.8 7.8Total µg/g (acid digestion) ND ND ND
Aluminum forest south forest north garden
groundwater mg/L 0.09 0.09soil exhange sites µg/g 13.20 9.20 TRsword fern µg/g 310.60 201.90 1095.50Total µg/g (acid digestion) 10741.20 13365.20 10897.10
Lead forest south forest north garden
groundwater mg/L 0.12 0.12soil exhange sites µg/g 0.80 1.10 1.10sword fern µg/g TR TR 9.90Total µg/g (acid digestion) 49.30 63.40 83.90
21
Conclusions
• The forest north is the best example of undisturbed soil development on this site
• The high base saturation (for inceptisols) is probably the result of of airborne deposition
• The sword fern is reservoir for some nutrients; P, K, and S are present in greater concentrations than in the soil (total). Many other nurtrients are present in the analyzed plants in concentrations greater than on the soil exchange sites.
• Sword fernis also bioaccumulating toxic metals.