1 running head: adc and polyamines in developing scots ... · pdf file5 introduction the...
TRANSCRIPT

1
Running head: ADC and Polyamines in Developing Scots Pine Embryos
Research category: Development and Hormone Action
Corresponding author: Jaana Vuosku, Department of Biology, University of Oulu, P.O.
Box 3000, 90014 Oulu, Finland; E-mail: [email protected];
Fax: 358 8 553 1061; Tel: 358 8 553 1549
Plant Physiology Preview. Published on September 8, 2006, as DOI:10.1104/pp.106.083030
Copyright 2006 by the American Society of Plant Biologists
www.plantphysiol.orgon May 24, 2018 - Published by Downloaded from Copyright © 2006 American Society of Plant Biologists. All rights reserved.

2
Consistency of Polyamine Profiles and Expression of Arginine Decarboxylase in
Mitosis during Zygotic Embryogenesis of Scots Pine
Jaana Vuosku1, Anne Jokela1, Esa Läärä2, Mira Sääskilahti1
Riina Muilu1, Suvi Sutela1, Teresa Altabella3, Tytti Sarjala4, Hely Häggman1
1Department of Biology, University of Oulu, P.O. Box 3000, 90014 Oulu, Finland
2Department of Mathematical Sciences/Statistics, University of Oulu, P.O. Box 3000,
90014 Oulu, Finland
3Unitat de Fisiologia Vegetal, Facultat de Farmàcia, Universitat de Barcelona, Diagonal
643, 08028-Barcelona, Spain
4Finnish Forest Research Institute, Parkano Research Unit, 39700 Parkano, Finland
www.plantphysiol.orgon May 24, 2018 - Published by Downloaded from Copyright © 2006 American Society of Plant Biologists. All rights reserved.

3
The research was funded by the Academy of Finland (Project 53440 to TS).
Corresponding author; e-mail [email protected]; fax 358 8 553 1061
www.plantphysiol.orgon May 24, 2018 - Published by Downloaded from Copyright © 2006 American Society of Plant Biologists. All rights reserved.

4
ABSTRACT
In this study, we show that both arginine decarboxylase (ADC) protein and mRNA
transcript are present at different phases of mitosis in Scots pine (Pinus sylvestris L.)
zygotic embryogenesis. We also examined the consistency of polyamine profiles with the
effective temperature sum, the latter indicating the developmental stage of the embryos.
The polyamine (PA) metabolism was analyzed by fitting statistical regression models to
the data of free and soluble conjugated PAs, to the enzyme activities of ADC and ornithine
decarboxylase (ODC) as well as to the gene expression of ADC. According to the fitted
models, PAs typically had the tendency to increase at the early stages but decrease at the
late stages of embryogenesis. Only the free putrescine fraction remained stable during
embryo development. The PA biosynthesis strongly preferred the ADC pathway. Both
ADC gene expression and ADC enzyme activity were substantially higher than putative
ODC gene expression or ODC enzyme activity, respectively. ADC gene expression and
enzyme activity increased during embryogenesis, which suggests the involvement of
transcriptional regulation in the expression of ADC. Both ADC mRNA and ADC protein
localized in dividing cells of embryo meristems and more specifically within the mitotic
spindle apparatus and close to the chromosomes, respectively. The results suggest the
essential role of ADC in the mitosis of plant cells.
www.plantphysiol.orgon May 24, 2018 - Published by Downloaded from Copyright © 2006 American Society of Plant Biologists. All rights reserved.

5
INTRODUCTION
The polyamines (PA), found in bacteria, fungi, animals and plants, are evolutionary
ancient small polycations that are implicated in various physiological and developmental
processes. In higher plants, these processes include stimulation of cell division, response to
environmental stresses and regulation of rhizogenesis, embryogenesis, senescence, floral
development and fruit ripening (Kakkar and Sawhney, 2002). Both in prokaryotes and in
eukaryotes PAs play important roles in a number of cellular processes, such as DNA
conformation, chromatin condensation, RNA processing, translation and protein activation
(Childs et al., 2003), which is reflected in a strict regulatory control of their intracellular
levels. The intracellular free PA pool is affected both by PA synthesis and degradation, as
well as cellular influx, efflux and conjugation mechanisms (Tiburcio et al., 1997). In
plants, however, the molecular mechanisms of the action of PAs are still in most cases
unknown and hardly anything is known about the role of PAs at cellular level in conifers.
Diamine putrescine (Put) and triamine spermidine (Spd) are present in most organisms,
but tetra-amine spermine (Spm) is predominantly found in eukaryotes (Cohen, 1998). The
first step in PA biosynthesis is the formation of Put from ornithine and arginine via the
rate-limiting enzymes arginine decarboxylase (ADC; EC 4.1.1.19) and ornithine
decarboxylase (ODC; EC 4.1.1.17), respectively. Mammalian and fungal cells utilize
mainly ODC to synthesize Put (Coleman et al., 2004), whereas an additional indirect route
from arginine to Put is prevalent in plant and bacterial cells (Bagni and Tassoni, 2001). Put
is converted into Spd and Spm by Spd synthase (SPDS; EC 2.5.1.16) and Spm synthase
(SPMS; EC 2.5.1.22), respectively, which add aminopropyl groups generated from S-
adenosylmethionine by S-adenosylmethionine decarboxylase (SAMDC; EC 4.1.1.50)
(Tiburcio et al., 1997). In plant cells, PAs often occur as free molecules (soluble PAs), but
they can also be conjugated to low-molecular mass compounds (conjugated soluble PAs,
SH) or bound to different macromolecules (conjugated insoluble PAs, PH) (Martin-
Tanguy, 1997; Tiburcio et al., 1997). PAs are catabolized by the action of amino oxidases,
which include diamino oxidase (DAO), oxidizing the diamines Put and cadaverine, and
polyamine oxidase (PAO), which oxidizes Spd and Spm (Tiburcio et al., 1997).
Different physiological roles have been proposed for ADC and ODC, because their
production in plants is often tissue-specific and developmentally regulated (Kumar et al.,
1997). It has been suggested that ODC is involved in the regulation of cell division in
www.plantphysiol.orgon May 24, 2018 - Published by Downloaded from Copyright © 2006 American Society of Plant Biologists. All rights reserved.

6
actively growing plant tissues (Cohen et al., 1984; Acosta et al., 2005). ADC activity has
been found in elongating cells, embryonic cells, and cells exposed to various stress
conditions (Flores, 1991). Bortolotti et al. (2004) showed that ADC protein is located in
the nuclei of non-photosynthetic tissue of tobacco, whereas ADC in photosynthetic tissues
is located in chloroplasts. Recently, ODC and ADC gene transcripts were co-localized in
developing primary and lateral roots and hypocotyls of etiolated soybean seedlings (Delis
et al., 2005).
The importance of PAs in embryogenesis has been documented in many angiosperm
species (Lin et al., 1984; Yadav and Rajam, 1998), and recently the knock-out mutants of
PA biosynthesis have shown that SPDS (Imai et al., 2004) and SAMDC (Ge et al., 2006)
are essential for embryo development in Arabidopsis. However, the intracellular
localization of PAs and their function at molecular level during embryogenesis have not
been elucidated. The role of PAs has been under active investigation also in gymnosperms,
but most of the studies have focused on somatic embryogenesis, while relatively little is
known about PA biosynthesis during zygotic embryo development. Thus, based on the
previous studies on PAs during somatic embryo development in conifers and during
zygotic embryo development in angiosperms we hypothesized that PAs also have a role in
zygotic embryo development of gymnosperms. The role of PAs might be specific
depending on the developmental stage of embryos, which could appear as a variation at
metabolite, protein or transcript level. In the present work, we were able to construct the
statistical regression models of the free and conjugated Put, Spd and Spm concentrations
and show the yearly recurrent PA concentration profiles during the zygotic embryo
development of Scots pine. Furthermore, because ODC activity is commonly connected
with cell division in plants (Galston and Sawhney, 1990), we also hypothesized that in
Scots pine developing embryos ODC mRNA transcripts or proteins should be found in
dividing cells. It showed up, however, that the ADC pathway was the prevalent route to
form Put in Scots pine embryos and instead of ODC both ADC mRNA transcripts and
ADC protein were specifically localized in mitotic cells of primary meristems in embryos.
www.plantphysiol.orgon May 24, 2018 - Published by Downloaded from Copyright © 2006 American Society of Plant Biologists. All rights reserved.

7
RESULTS
Zygotic Embryo Development and Effective Temperature Sum
In gymnosperms including Scots pine, the time of fertilization and, consequently,
embryo development are known to vary between years in the same locality according to
the effective temperature sum (d.d.) (i.e. the heat sum unit based on the daily mean
temperatures minus the adapted +5˚C base temperature) (Sarvas, 1962; Krasowski and
Owens, 1993; Sirois et al., 1999; Owens et al., 2001). Therefore, in this work, the effective
temperature sum rather than the sampling date was used as the main explanatory variable
in the statistical analyses. The zygotic embryos of the two Scots pine clones (K818 and
K884) were derived from cone collections started after fertilization and repeated four times
during the period of embryo development in 2001 and 2003. On the sampling dates I, II, III
and IV, the effective temperature sums were 569.7, 667.3, 775.6 and 876.0 d.d.,
respectively, in 2001, and 495.1, 594.0, 702.8 and 819.2 d.d. in 2003.
The anatomical preparates of the developing embryos from the year 2003 indicate the
following developmental pattern. On the sampling date I, when the effective temperature
sum was about 500 d.d., around 50 % of the embryos were still at the proembryogeny stage
and 50 % at the early embryogeny stage. On the sampling dates II and III, when the
effective temperature sum was between 600 and 700 d.d., nearly 100 % of the embryos
were at the early embryogeny stage. On the sampling date IV, when the effective
temperature sum was over 800 d.d., approximately 85 % of the embryos had reached the
late embryogeny stage while the remaining 15 % were still at the early embryogeny stage.
In Figure 1 both early embryos from the sampling dates II (Fig. 1A) and III (Fig. 1F) and
late embryos from the sampling date IV (Fig. 1, B, C and D) have been presented.
Changes in Polyamine Content during Zygotic Embryo Development
By presenting PA concentrations as quadratic (2nd order polynomial) functions of the
effective temperature sum, we were able to combine results from different clones, years,
and PA fractions to the same regression model and to show that the PA concentrations
followed consistent profiles at least for Spd and Spm (Fig. 2, Table I).
The free Put content was not observed to change during the study period apart from the
clone K884 in 2001, when we found a slightly increasing trend (Fig. 2, upper panel, left
side). The latter exception to the rule was supported by the estimated value (+26.4 nmol g-1
www.plantphysiol.orgon May 24, 2018 - Published by Downloaded from Copyright © 2006 American Society of Plant Biologists. All rights reserved.

8
(100 d.d.)-1) of the interaction term C x V x T1 between clone, year, and the linear term of
effective temperature sum being larger than its error margin (95% EM 22.5 nmol g-1(100
d.d.)-1, Table I). The observation of no trend elsewhere in the free Put was consistent with
the estimates and error margins for the main effects of effective temperature sum T1
(slope) and T2 (curvature), and with those of the interaction effects C x T1 and C x T2
between clone and effective temperature sum, as well as interactions V x T1 and V x T2
between year and effective temperature sum, in which the estimates were all well within
their error margins. In the clone K884, the free Put observations on the sampling date II
were excluded from statistical analysis due to the wide scattering of the observations. The
soluble conjugated fraction of the Put appeared in both clones to increase at the beginning
of embryo development and to decrease during embryo maturation (Fig. 2, upper panel,
right side). However, the results on relevant interaction terms F x T1 and F x T2 were not
sufficiently supportive about this for the clone K818, whereas for the clone K884 strong
evidence for this observed pattern was provided by the estimates and error margins of the
interaction effects F x C x T1 and F x C x T2. The insoluble conjugated Put fraction was
considerable and maximally consisted nearly 35 % of the total Put in the sample but there
was no trend in the insoluble conjugated Put content (data not shown).
Spd was the most abundant PA during Scots pine zygotic embryogenesis. Both free and
soluble conjugated Spd increased at the beginning of embryo development, reached their
maximum when the effective temperature sum was between 600 and 750 d.d. and
decreased thereafter (Fig. 2, middle panel). There was somewhat more random fluctuation
in 2001 than in 2003 and more fluctuation in the clone K818 than in the clone K884. The
main quadratic effect of T2 (estimate –35.7, 95% EM 28.0, both in nmol g-1 (100 d.d.)-1,
Table I) conveyed strong evidence for the observed downward curvature in the PA
concentrations by the effective temperature sum together with the “non-significance” of
the main linear effect T1. This observation was qualitatively consistent for both the free
and the soluble conjugated forms over the two years and in the two clones, as can be
judged from the result for all the interaction terms involving T1 and T2, the estimates of
these being all within their error margins (Table I). The insoluble conjugated Spd fraction
always consisted less than 11 % of the total spermidine fraction in the sample (data not
shown).
Both the free and the soluble conjugated forms of Spm fluctuated in a consistent way in
the two pine clones (Fig. 2, lower panel). The concentrations appeared to increase typically
when the level of the effective temperature sum was 500 d.d. until it was around 700 d.d.,
www.plantphysiol.orgon May 24, 2018 - Published by Downloaded from Copyright © 2006 American Society of Plant Biologists. All rights reserved.

9
after which the concentrations started to go down. There was convincing evidence for the
observed overall downward curvature provided by the fitted regression model, in which the
main linear and quadratic terms of effective temperature sums (T1: estimate 19.6, 95% EM
12.4; T2: estimate –24.4, 95% EM 11.0, all values in nmol g-1 (100 d.d.)-1, Table I) were
well supporting the observed pattern, and none of the estimated interaction terms involving
T1 and T2 modified this appreciably. The content of insoluble conjugated Spm was very
low or under the HPLC detection level in most samples.
ADC and ODC Expression at Transcript and Protein Levels
ADC gene expression and ADC enzyme activity were clearly preferred compared to
putative ODC gene expression and ODC enzyme activity, respectively. This suggests that
the ADC pathway is the main route to produce Put in developing zygotic embryos.
Relative ADC gene expression showed an increasing trend over time and by the
effective temperature sum in both of the clones on the double logarithmic scale. The slope
appeared steeper in the clone K818 (slope 4.7, 95% EM 0.80) than in K884 (slope 3.3,
95% EM 0.75) (Fig. 3). An ascending trend in ADC gene expression during embryo
development was also evident, when the gene expression was normalized by another
housekeeping gene, glyceraldehyde-3- phosphate dehydrogenase, GAPD (data not shown).
The mRNA levels of the putative ODC gene were very low. The fluorescence signal
showed up after 35 cycles in real-time RT-PCR and therefore it could not be reliably
distinguished from spurious background.
ADC enzyme activity seemed to increase in both clones during early embryo
development, when the effective temperature sum rose from 500 to 600 d.d.. Thereafter,
the activity still seemed to increase in the clone K884 but not in K818 (Fig. 4). The
evidence for an increasing trend was weak, and for curvature even weaker, though, as
reflected by the ratios “estimate/error margin” ratio of the linear and quadratic terms T1
and T2 (Table II). Also, the results on interaction terms C x T1 and C x T2 did not provide
a sufficient basis to conclude that the slope and curvature were different for the two clones.
ODC enzyme activity showed a decreasing trend with downward curvature in the clone
K818 throughout the sampling period, as suggested by the estimated values −0.76 (95%
EM 0.25) of the linear term T1 and −0.36 (95% EM 0.27) of the quadratic term T2,
respectively. In the clone K884, ODC enzyme activity was initially lower, and decreased
further during the early developmental stages of the embryos, when the effective
temperature sum was between 500 and 600 d.d., after which it remained at that level (Fig.
www.plantphysiol.orgon May 24, 2018 - Published by Downloaded from Copyright © 2006 American Society of Plant Biologists. All rights reserved.

10
4). The estimated coefficients and error margins for the C x T1 and C x T2 interactions
supported the existence of a less steeper overall slope but an upward curvature for the
clone K884 than for K818 (Table II). ADC and ODC activities were also measured in
pellets, in which the enzyme activities were clearly lower than in supernatants, but no trend
could be detected (data not shown).
Localization of ADC Gene Expression and ADC Protein in Dividing Cells
ADC gene expression was localized in the dominant embryo at the early embryogeny
stage and also in two subordinate embryos (Fig. 1A). In late embryos, ADC expression was
found to be located in the regions undergoing cell division, especially in the shoot apical
and axillary meristems, but also in the dividing cells of the root meristem (Fig. 1, B, C and
D). The ADC probe specificity was confirmed by the absence of signals in the sections
hybridized with the sense ADC probe (Fig. 1, E and L). The transcripts of a putative ODC
gene were not detected in embryos (Fig. 1F).
ADC gene expression occurred during mitosis and it was found in cells throughout the
mitotic stages (Fig. 1, G, H, I, J and K). In early prophase, when chromatids became
visible in the nucleus, ADC expression was located in cytoplasm (Fig. 1G). In late
prophase and metaphase, ADC transcripts were also in the cytoplasmic region (Fig. 1, H
and I), but in anaphase and telophase cells, ADC transcripts clearly accumulated within the
area of mitotic spindle apparatus (Fig. 1, J and K).
The immunocytochemical localization showed the presence of ADC protein in the
nuclei of late embryos (Fig. 1, M and N). High level of ADC protein was detected
especially in mitotic cells, but in contrast to ADC transcripts, ADC protein was found to
locate close to the chromosomes and not within the mitotic spindle as the mRNA (Fig. 1, O
and P). No positive signal was found in the control sections incubated with preimmune
serum (Fig. 1Q).
DISCUSSION
Polyamine Concentrations Show Consistent Profiles during Zygotic Embryogenesis
In this study, we found high PA concentrations in developing zygotic embryos of Scots
pine, which is in accordance with the high PA contents reported in tissues undergoing
rapid cell division, active metabolism and somatic embryogenesis (Egea-Cortines and
Mizrahi, 1991; Kakkar and Sawhney, 2002). Spd, which was the most abundant PA in the
www.plantphysiol.orgon May 24, 2018 - Published by Downloaded from Copyright © 2006 American Society of Plant Biologists. All rights reserved.

11
present study, was also the main PA in the zygotic and somatic embryos of Pinus radiata
D. Don. (Minocha and Minocha, 1995; Minocha et al., 1999b). We found that the
individual PA levels differed between the pine clones within one year and between years
when studying the same pine clone. This might be due to the variation reported in PA
metabolism between genotypes (Sarjala and Savonen, 1994) and/or due to the
environmental factors affecting PA levels (Bouchereau et al., 1999).
The zygotic embryo development of Scots pine takes two years. Generally, wind
pollination occurs at the beginning of the growing season, late May or early June in
Scandinavia, after which the pollen tube germination gradually ceases to be continued
during the following growing season about one year later. Fertilization occurs usually at
late June or early July depending on the effective temperature sum (Sarvas, 1962;
Krasowski and Owens, 1993). When the embryo development of Picea mariana Mill. was
described by the effective temperature sum, the developmental stages, although unequal in
duration, succeeded each other according to the monotonically increasing sigmoid function
of the effective temperature sum (Sirois et al., 1999). In the present work, anatomical
studies also confirmed that Scots pine embryo development occurred along with the
increasing effective temperature sum. Therefore, to be able to compare PA metabolism
during early embryo development at two different years the effective temperature sum
instead of the sampling date was used as the main explanatory variable in statistical
analyses. In most of the cases, the PA metabolism in developing embryos followed
consistent profiles in different years, which suggested that PAs have an important role in
embryo development and that individual PAs may have different roles at different
developmental stages. The profiles of PAs seemed to show an increasing trend at the early
stages but a decreasing trend at the late stages of embryo development. Only the free Put
fraction remained stable throughout the period of embryo development. In this study, an
increase in the ratio of free Spd and Put as well as in the ratio of free Spm and Put was
found at the beginning of the zygotic embryo development. This is in accordance with the
reports on somatic embryogenesis in Picea abies (L.) Karst. (Santanen and Simola, 1992),
Scots pine (Niemi et al., 2002) and Pinus radiata (Minocha et al., 1999b) as well as in the
zygotic embryos of Pinus radiata (Minocha et al., 1999b).
ADC Pathway Is Preferred during Zygotic Embryogenesis
In this study, both ADC gene expression at the mRNA transcript level and the activity
of ADC enzyme were detected in developing zygotic embryos. The higher rate of ADC
www.plantphysiol.orgon May 24, 2018 - Published by Downloaded from Copyright © 2006 American Society of Plant Biologists. All rights reserved.
12
activity compared to ODC was prominent, which is in agreement with the reports of
somatic embryo development in Picea rubens Sarg. (Minocha et al., 1996) as well as the
zygotic embryogenesis of Picea abies (Santanen and Simola, 1999). We found the highest
ADC and ODC activities in the supernatant fraction containing soluble proteins, but some
were also detected in the pellet.
In the present work, ADC gene expression and ADC enzyme activity showed a steady
increase throughout the embryo development. This might be due to the increasingly
important role of the more developed embryo in PA metabolism compared to the
senescencing megagametophyte. We found that ADC expression increased during the
embryo development at both the mRNA and the enzyme activity levels. This suggests an
involvement of transcriptional regulation in ADC gene expression, but does not rule out
post-transcriptional regulation of the gene. ADC mRNA has been found to accumulate
under various stress conditions in Oryza sativa L. (Chattopadhyay et al., 1997), Glycine
max (L.) Merr. (Nam et al., 1997), Brassica juncea L. (Mo and Pua, 2002), Arabidopsis
(Urano et al., 2003) and Malus sylvestris (L.) Mill. (Hao et al., 2005). However, ADC has
been reported to be regulated at the post-translational level in Avena sativa L. (Malmberg
and Cellino, 1994; Borrell et al., 1996) and also in potassium deficiency-stressed
Arabidopsis (Watson and Malmberg, 1996). This indicates that different regulation
mechanisms may be involved in ADC expression in different gene family members, plant
species, tissues and physiological conditions and at different developmental stages.
The Role of ADC in Cell Division
In the present study, we were able to localize ADC gene expression and ADC protein
specifically in the mitotic cells of developing zygotic embryos. There is evidence that PAs
are involved in the regulation of cell division in animals (Bello-Fernandez et al., 1993),
micro-organisms (Theiss et al., 2002) and plants (Kaur-Sawhney et al., 1980). In
mammalian cells, the progression of the normal cell cycle is dependent on PAs (Oredsson,
2003), and PA contents have been reported to vary throughout the cell cycle in Helianthus
tuberosus L. (Serafini-Fracassini, 1991). However, the exact intracellular localizations of
ADC, ODC and PAs during mitosis are hardly known at all, which has prevented more
precise interpretation of the biological role of PAs in cell division. In this study, the
specific localization of ADC protein in the cell nuclei and in the chromosomal area of
mitotic cells may indicate that PAs synthesized via ADC are involved in chromatin
condensation during cell division. Interestingly, in synchronized human cervix and
www.plantphysiol.orgon May 24, 2018 - Published by Downloaded from Copyright © 2006 American Society of Plant Biologists. All rights reserved.

13
prostatic carcinoma cell cultures, ODC protein was localized in perinuclear site at the
beginning of mitosis and in the nucleoplasm surrounding the chromosomes during meta-,
ana-, and telophase (Schipper et al., 2004). PAs have been implicated in the formation of
higher order chromosomal fibers in vitro and in vivo (Belmont et al., 1989). In mammalian
cells, PA depletion causes major chromosomal alterations, such as decondensation and
fragmentation of mitotic chromosomes (Pohjanpelto and Knuutila, 1982). Pollard et al.
(1999) suggested that in yeasts PAs are repressors of transcription in vivo and that histone
hyperacetylation antagonizes the ability of PAs to stabilize highly condensed states of
chromosomal fibers.
ADC mRNAs, in the present study, were located within the mitotic spindle apparatus of
dividing cells, whereas ADC protein was close to the chromosomes. This may suggest that
the transport of ADC mRNA during mitosis is mediated by microtubules and that ADC
mRNA is translationally repressed while en route. Studies in Drosophila melanogaster
Meigen and Xenopus laevis Daudin embryos, as well as neurons, have implicated
microtubules in localizing mRNA (Nasmyth and Jansen, 1997), but to our knowledge, this
has not been reported earlier in higher plants. However, RNA localization appears to be an
ancient cellular mechanism, while RNA transport and local translation have been
documented in vertebrates, invertebrates, and unicellular organisms (Kindler et al., 2005).
First evidences for the intracellular localization of specific mRNAs were discovered with
maternal mRNAs within eggs or oocytes (Jeffery et al., 1983; Gavis and Lehmann, 1994),
but through improved sensitivity of in situ hybridization techniques localized transcripts
have been found in an increasing number of somatic cell types, including fibroblast,
myoblast, neurons, oligodendrocytes, and epithelial cells (St Johnston, 1995).
ADC mRNA and ADC protein seem to take place particularly at the mitotic phase of the
cell cycle, when most of the protein synthesis is inhibited. Pyronnet et al. (2000) found that
mammalian ODC mRNA contains a cap-independent internal ribosome entry site that
functions exclusively at the G2/M phase of the cell cycle. Commonly, ODC activity is also
connected with cell division in plant cells (Galston and Sawhney, 1990), and recently,
ODC mRNA was in situ localized in the dividing cells of shoots and roots in Lycopersicon
esculentum Mill., whereas ADC transcripts were not found in the dividing cells (Acosta et
al., 2005). In Nicotiana tabacum L. cv Xanthi, ADC was found to be responsible for Put
synthesis in old hypergenous vascular tissues, whereas ODC expression coincided with
early cell divisions and ODC catalysed Put synthesis in hypogenous tissues (Paschalidis
and Roubelakis-Angelakis, 2005). Because plants are capable of using both the ODC and
www.plantphysiol.orgon May 24, 2018 - Published by Downloaded from Copyright © 2006 American Society of Plant Biologists. All rights reserved.
14
the ADC pathways in PA synthesis, it could be hypothesized that ADC may have taken, at
least in some cells, the functions that belong to ODC in animal cells. Hanfrey et al. (2001)
did not found any genomic sequence homologous to known ODC genes or ODC enzyme
activity in Arabidopsis. Although conserved or similar basic mechanisms are operational at
the core of the cell division cycle of all eukaryotes, plants show novel features especially
in molecules involved in the regulation of cell cycle control (Dewitte and Murray, 2003).
Conclusion
In the present study, we report PA metabolism to follow yearly consistent profiles
during zygotic embryo development in Scots pine. There is typically an increasing trend in
PA concentrations at the early developmental stages and a decreasing trend during late
embryo development, except in the case of the free Put fraction, which remains relatively
stable throughout the embryo development. Our results show that the ADC pathway is the
main PA route and that ADC expression is regulated, at least partly, at the mRNA level.
We also show that ADC gene expression and ADC protein are present specifically in
mitotic cells of embryo meristems, suggesting the essential role of ADC in the mitosis of
plant cells.
MATERIALS AND METHODS
Collection of Immature Seeds
During the growing seasons 2001 and 2003 one-year-old immature seed cones were
collected from two open-pollinated elite Scots pine (Pinus sylvestris L.) clones, K818 and
K884, growing in the Scots pine clone collection in Punkaharju, Finland (61˚48 ́N; 29˚17 ́
E). In both years the same grafts, one per pine clone, were used to collect the cones. The
cone collection was repeated four times in July throughout the period of embryo
development. In 2001, cones were collected on July 9 (sampling date I), July 16 (sampling
date II), July 23 (sampling date III) and July 30 (sampling date IV) and in 2003, cones
were collected on July 8 (sampling date I), July 15 (sampling date II), July 22 (sampling
date III) and July 29 (sampling date IV). Immature zygotic embryos surrounded by the
immature megagametophyte, called zygotic embryos, were dissected from the developing
cones and fixed immediately for the microscopic examination as described below.
Dissected zygotic embryos for PA analysis, enzyme analysis and real-time RT-PCR were
stored at - 80˚C until use.
www.plantphysiol.orgon May 24, 2018 - Published by Downloaded from Copyright © 2006 American Society of Plant Biologists. All rights reserved.

15
Microscopical Observations
Developing embryos were fixed for study of the anatomical features of the embryos, for
in situ hybridization and for immunolocalization. For all these purposes, the following
protocol from fixation to coverslip mounting was used: The tissues were fixed in 4% (w/v)
p-formaldehyde in 1x phosphate-buffered saline (PBS) buffer (10 mM phosphate, 150 mM
NaCl, pH 7.4). After dehydration with a graded series of ethanol, ethanol was replaced by
tertiary butanol and then gradually by paraffin. Sections (5 and 7µm) were cut from the
embedded samples with a microtome, mounted on SuperFrost®Plus slides (Menzel-Glaser)
and fixed by drying overnight at 40˚C.
To study the developmental stage of the embryos, the preparates were stained with
toluidine blue (0.05 % toluidine blue in H2O) and the sections were examined under a light
microscope. In 2003 the developmental stage was specified from 6 to 15 embryos per
sampling date, totally from 85 embryos. The sequence of embryo development was
divided into three phases according to Singh (1978). These stages include proembryogeny
i.e. the stages before suspensor elongation, early embryogeny i.e. the stages after suspensor
elongation and before the establishment of the root meristem, and late embryogeny i.e. the
establishment of root and shoot meristems and further the development of the embryo.
Measurement of Polyamines by HPLC
In addition to the free PAs, soluble and insoluble conjugated PAs were also examined.
Four samples per sampling date and each sample consisting of 250 mg of embryos were
extracted in 5 % (w/v) perchloric acid. Crude extract for free PAs, hydrolysed supernatant
for perchloric acid soluble conjugated PAs and hydrolysed pellet for perchloric acid-
insoluble conjugated PAs were dansylated and separated by HPLC according to Sarjala
and Kaunisto (1993) and Fornalé et al. (1999). The embryonic PA concentrations were
expressed as nmol g-1 initial fresh weight (FW) of embryos.
Analysis of ADC and ODC Activities
The proteins of Scots pine zygotic embryos were extracted for enzyme activity
measurements from one to four independent samples per sampling date. Embryos (400 mg
FW) were homogenized in an ice-cold mortar with liquid nitrogen and dissolved in 4 ml of
extraction buffer containing 50 mM Tris-HCl (pH 8.4), 0.5 mM pyridoxal-5-phosphate, 0.1
mM EDTA and 5.0 mM DTT. The solution was centrifuged at 15500 x g for 20 min at
www.plantphysiol.orgon May 24, 2018 - Published by Downloaded from Copyright © 2006 American Society of Plant Biologists. All rights reserved.
16
+4°C, and the supernatant as well as the pellet resuspended with 4 ml extraction buffer
were used for both ADC and ODC enzyme assays according to Minocha et al. (1999a)
with some modifications. The ADC and ODC activity reaction mixtures (300 µl)
contained 200 µl of protein extract, 50 µl of buffer and 50 µl of either 12 mM arginine
containing 9.3 kBq L-[U-14C]arginine (sp.act. 11.1 GBq/mmol, Amersham) or 12 mM
ornithine containing 3.7 kBq DL-[1-14C]ornithine hydrochloride (sp.act. 2.07 GBq/mmol,
Amersham). The presence of true ADC activity was confirmed by adding 20 µl of 16 mM
unlabelled L-ornithine into the reaction mixture according to Tassoni et al. (2000) in order
to inhibit arginase activity. In the inhibition assay for ODC, 12.5 mM DL-α-
difluoromethylornithine (DFMO, SIGMA) was used. Blank samples were made by adding
200 µl of perchloric acid. Three activity measurements were performed from each protein
sample and the activities were expressed as nmol CO2 h-1 (mg protein)-1. Protein content
was measured with the Bradford method (Quick Start™ Bradford Protein Assay, Biorad)
using bovine serum albumin (BSA) as a standard.
PCR Primers
The primers, 5´-AGAAATTGGGGATGCTGGAT-3´ and 5´-
GCCATCACGATTGTATTCACC-3´, were designed to amplify a 466 bp fragment of the
Scots pine ADC gene (AF306451). For amplifying a 420 bp fragment of a putative ODC
gene, the primers, 5´-AAGCGGTGAAGCCATTAAAA-3´ and 5´-
TTGCGTTGCAGACGTATTTC-3’ were used. The primers for ODC were designed using
GenBank Pinus taeda L. EST sequence CO176452. The selection of a putative ODC
sequence was based on similarity at amino acid level with the ODC genes isolated from
other plant species. The designing of the ACT primers, 5´-
GCTTGCTTATGTAGCCCTTGA-3´ and 5´-GGTCTTGGCAATCCACATCT-3´, was
based on the Pinus contorta Dougl. ex Loud. actin gene sequence, M36171. The actin
(ACT) primers were designed to contain an intron in the sequence between the primers to
reveal possible genomic DNA contamination. The functioning of ACT primers and the
primer pair against Scots pine GAPD sequence (L07501) were shown in Jaakola et al.
(2004). All primers were chosen to have equal annealing temperatures close to the optimal
temperature of 58 ºC.
www.plantphysiol.orgon May 24, 2018 - Published by Downloaded from Copyright © 2006 American Society of Plant Biologists. All rights reserved.

17
RNA Isolation, RT-PCR and cDNA Cloning
The total RNA of Scots pine zygotic embryos was extracted for the gene expression
studies date as described in our previous paper (Vuosku et al., 2004), using the automated
magnetic-based KingFisher™ mL method (Thermo Electron Corporation) and the
manufacturer’s KingFisher™ Total RNA purification kit. Three independent RNA
extractions were done per clone and per sampling date. However, the extractions from the
embryos of the clone K818 on sampling date II were unsuccessful and could not be
repeated, because of the shortage of the embryos. cDNA was prepared from 3 µg of total
RNA, which was reverse-transcribed by SuperCript II reverse transcriptase (Invitrogen)
from an anchored oligo-dT primer using standard methods in a reaction volume of 20 µL.
Fragments of the PA biosynthesis genes and the housekeeping gene actin were amplified
from cDNA by standard PCR using DyNAzyme™EXT polymerase (Finnzymes). PCR
fragments were cloned into the pDrive Cloning Vector of Qiagen PCR Cloning Kit
(Qiagen). DNA sequencing was performed using an automated sequencer (model 377; PE
Applied Biosystems) and dye terminator sequencing reagents (PE Applied Biosystems).
Real-time PCR Analyses of ADC, ODC and ACT mRNA Transcripts
The quantification of mRNA was done with real-time PCR. A first-strand cDNA
template was synthesized from 3 µg of total RNA as described above. Three independent
cDNA preparations were made for every sampling date, and every PCR reaction was done
as duplicate to control for the variability of PCR amplification. The real-time PCR was
performed in 50 µL of reaction mixture composed of 2 µl of cDNA, Brilliant® SYBR®
Green QPCR Master Mix, and 150 nM gene-specific primers using the Mx3000P™ real-
time PCR system (Stratagene). PCR amplification was initiated by incubation at 95°C for
10 min followed by 40 cycles: 30 s at 95°C, 1 min at 58°C and 1 min at 72°C. The PCR
conditions were optimized for high amplification efficiency >95% for all primer pairs used.
ADC and ODC gene expressions were normalized by non-regulated reference gene
expression derived from the housekeeping gene ACT. The Q-Gene software (Muller et al.,
2002) was used for the calculation of mean normalized expressions (MNE) of the target
genes. MNEs are the linear expression values of a target gene relative to a reference gene,
calculated from the average CT value, the PCR cycle where the fluorescence intensity of
an amplicon crosses a threshold line, of the two replicates for the target gene and for the
reference gene (Simon, 2003).
www.plantphysiol.orgon May 24, 2018 - Published by Downloaded from Copyright © 2006 American Society of Plant Biologists. All rights reserved.
18
RNA Probes for in Situ Hybridization
To prepare RNA probes, we used a PCR-based technique, in which a T7 polymerase
promoter sequence (TAATACGACTCACTATAGGG) was introduced at the 5´ends of the
gene-specific primers (Young et al., 1991). Plasmid DNA containing the cDNA in question
served as the PCR template. The gene specific downstream primer contained an artificially
introduced T7 promoter at its 5´end, which enabled the synthesis of antisense transcripts.
The upstream primer containing T7 promoters at the 5´ends was used for the synthesis of
sense transcripts, i.e. as negative control. A PCR fragment representing the coding region
of ADC was produced under standard PCR conditions using DyNAzyme™EXT
polymerase (Finnzymes). The PCR fragment was gel-purified using the DNA Gel
Extraction Kit (Millipore Corporation), and 250 ng was subsequently used as a template
DNA for in vitro transcription by T7 RNA polymerase (Invitrogen), incorporating dig-
UTP via DIG RNA labelling Mix (Roche Molecular Biochemicals). Template DNA was
digested with four units of RNAse-free DNAse (Invitrogen) in a reaction volume of 20 µL
for ten minutes at 37˚C, and the probe was precipitated and hydrolyzed in 1x carbonate
buffer (80 mM NaHCO3, 120 mM Na2CO3). The yield of the DIG-labeled RNA probe was
estimated by comparing the intensity of the sample to the defined controls made with DIG-
labelled control RNA (Roche Molecular Biochemicals).
In Situ Hybridization Analysis
The sections for in situ hybridization were done as described above. In situ
hybridization was done according to Mähönen et al. (2000) with some modifications. The
sections were de-waxed in xylol, hydrated in an ethanol dilution series and treated
sequentially with 0.2 M HCl, proteinase K (10 µg mL-1), 4% (w/v) p-formaldehyde and 0.5
% acetic anhydride in 0.1 M triethanolamine. The samples were hybridized in a solution
containing 50 % (v/v) formamide, 300 mM NaCl, 10 mM Tris (pH 7.0), 10 mM Na3PO4
(pH 7.0), 50 mM EDTA, 10 % dextran sulphate, 200 µg mL-1 tRNA, 1 x Denhardt’s
solution and 10 U mL-1 RNase inhibitor overnight at 55 ˚C in a water atmosphere. The
amount of RNA probe used was about 200 ng per slide. After hybridization, the slides
were washed in 0.2 x SSC buffer (30 mM NaCl, 3 mM sodium citrate, pH 7.0) at 55 ˚C for
60 min and treated with RNase A (10 µg mL-1) in NTE buffer (500 mM NaCl, 10 mM Tris
(pH 8.0), 5 mM EDTA). The hybridized probe was detected using alkaline phosphatase-
www.plantphysiol.orgon May 24, 2018 - Published by Downloaded from Copyright © 2006 American Society of Plant Biologists. All rights reserved.

19
conjugated anti-DIG antibodies and NBT/BCIP as substrates (Roche Molecular
Biochemicals).
Immunolocalization
The IgGs obtained against the tobacco ADC protein (Bortolotti et al., 2004) were used
for immunolocalization. The sections were deparaffinized, rehydrated in an ethanol
dilution series and treated with 3 % H2O2 in 1 x PBS to destroy endogenous peroxidase
activity. The sections were washed with PBS followed by a 0.3% TritonX-100 / 5 % BSA
in 0.1% phosphate buffer (PBTBSA), and then they were incubated with anti-ADC
antiserum at concentration 1:250 in PBTBSA for 30 min. After rinsing in PBTBSA the
avidin-biotin complex, ABC, method (Vector Labs) using diaminobenzidine as a substrate
for peroxidase was carried out to detect the antigen-antibody complex according to the
vendors’ instructions.
Statistical Methods
The PA concentrations were analyzed by normal linear regression models in which T:
effective temperature sum was the main explanatory variable. C: clone (values 0 = K818, 1
= K884), F: fraction (0 = free, 1 = soluble conjugated) and V: year (1 = 2001, 0 = 2003)
were binary covariates. A 2nd order polynomial curve for the response was assumed,
including both T1 = the centered and scaled linear term (original values minus the overall
mean value divided by 100) and T2 = the quadratic (square of T1) term of the effective
temperature sum. Interactions between both terms of effective temperature sum with the
three binary factors were allowed for by including appropriate product terms in the model.
The development of ADC gene expression as a function of effective temperature sum in
2003 was analyzed by fitting a regression line through the origin for the logarithm of
relative expression (LRE) as a linear function of the logarithm of effective temperature
sum (LET). The slopes were estimated for both clones separately, and the common slope
assumption was evaluated by the appropriate interaction term C*LET.
ADC and ODC enzyme activities by effective temperature sum in 2003 were analyzed
by linear mixed regression models. Here, the natural logarithm of the enzyme activity
measurement was taken as the response variable. As in the above PA models, the linear
and quadratic terms T1 and T2 of effective temperature sum were the interesting
quantitative covariates, and C = clone was a binary covariate. The interactions of effective
www.plantphysiol.orgon May 24, 2018 - Published by Downloaded from Copyright © 2006 American Society of Plant Biologists. All rights reserved.
20
temperature sum terms with clone were also included in the models. In addition, the
variability of the response over the separate isolation runs performed at each measurement
occasion was allowed for by including an appropriate random effect term.
The PA models and the gene expression models were fitted using function lm() and
the models for the enzyme activities by function lme() in the R statistical environment
(http://www.r-project/org/). Assessment of the model assumptions were based on an
informal inspection of the four diagnostic graphs provided by the default plot methods for
the fitted model objects. The results were tabulated by giving the point estimates and the
95% error margins (EM) for the coefficients in each model, so that “estimate ± EM”
provides the 95% confidence interval for the coefficient. The ratio estimate/EM multiplied
by 2 can be used as an approximate t-statistic to perform a test of “significance” for any
coefficient of interest, but in line of recent recommendations we prefer to avoid explicit
reporting of P-values.
ACKNOWLEDGMENTS
We thank Doc Anneli Kauppi, Doc Antti Pajunen and Dr. Marja Nissinen from the
University of Oulu, Doc Eila Tillman-Sutela from Finnish Forest Research Institute, Dr.
Alexandra C. Baumgartner from the University of Göttingen and MA Merja Lappalainen
for help, enthusiasm and interest during the work. We are also grateful to Ms Eeva
Pihlajaviita, Finnish Forest Research Institute, for technical help, and to the personnel of
Finnish Forest Research Institute at Punkaharju Research Unit for conducting the
collections of the research material.
www.plantphysiol.orgon May 24, 2018 - Published by Downloaded from Copyright © 2006 American Society of Plant Biologists. All rights reserved.

LITERATURE CITED Acosta C, Pérez-Amador MA, Carbonell J, Granell A (2005) The two ways to produce
putrescine in tomato are cell-specific during normal development. Plant Sci 168: 1053-
1057
Bagni N, Tassoni A (2001) Biosynthesis, oxidation and conjugation of aliphatic polyamines
in higher plants. Amino Acids 20: 301-317
Bello-Fernandez C, Packham G, Cleveland JL (1993) The ornithine decarboxylase gene is
a transcriptional target of c-Myc. Proc Natl Acad Sci 90: 7804-7808
Belmont AS, Braunfeld MB, Sedat JW, Agard DA (1989) Large-scale chromatin structural
domains within mitotic and interphase chromosomes in vivo and in vitro. Chromosoma 98:
129-143
Borrell A, Besford RT, Altabella T, Masgrau C, Tiburcio AF (1996) Regulation of
arginine decarboxylase by spermine in osmotically-stressed oat leaves. Physiol Plantarum
98: 105-110
Bortolotti C, Cordeiro A, Alcázar R, Borrell A, Culiañez-Maciá FA, Tiburcio AF,
Altabella T (2004) Localization of arginine decarboxylase in tobacco plants. Physiol
Plantarum 120: 84-92
Bouchereau A, Aziz A, Larher F, Martin-Tanguy J (1999) Polyamines and environmental
challenges: recent development. Plant Sci 140: 103-125
Chattopadhyay MK, Gupta S, Sengupta DN, Ghosh B (1997) Expression of arginine
decarboxylase in seedlings of indica rice (Oryza sativa L.) cultivars affected by salinity
stress. Plant Mol Biol 34: 477-483
Childs AC, Mehta DJ, Gerner EW (2003) Polyamine-dependent gene expression. Cell Mol
Life Sci 60: 1394-1406
Cohen S (1998) A Guide to the Polyamines. University Press, Oxford
Cohen E, Arad SM, Heimer YH, Mizrahi Y (1984) Polyamine biosynthetic enzymes in the
cell cycle of Chlorella. Plant Physiol 74: 385-388
Coleman CS, Hu G, Pegg A (2004) Putrescine biosynthesis in mammalian tissues. Biochem
J 379: 849-855
Delis C, Dimou M, Efrose RC, Flemetakis E, Aivalakis G, Katinakis P (2005) Ornithine
decarboxylase and arginine decarboxylase gene transcripts are co-localized in developing
tissues of Glycine max etiolated seedlings. Plant Physiol Bioc 43: 19-25
Dewitte W, Murray JAH (2003) The plant cell cycle. Annu Rev Plant Biol 54: 235-264
www.plantphysiol.orgon May 24, 2018 - Published by Downloaded from Copyright © 2006 American Society of Plant Biologists. All rights reserved.

Egea-Cortines M, Mizrahi Y (1991) Polyamines in cell division, fruit set and development,
and seed germination. In RD Slocum, HE Flores, eds, Biochemistry and physiology of
polyamines in plants. CRC Press, Boca Raton, pp 143-158
Flores HE (1991) Changes in polyamine metabolism in response to abiotic stress. In RD
Slocum, HE Flores, eds, Biochemistry and physiology of polyamines in plants. CRC Press,
Boca Raton, pp 213-225
Fornalé S, Sarjala T, Bagni N (1999) Endogenous polyamine content and metabolism in the
ectomycorrhizal fungus Paxillus involutus. New Phytol 143: 581-587
Galston AW, Sawhney RK (1990) Polyamines in plant physiology. Plant Physiol 94: 406-
410
Gavis ER, Lehmann R (1994) Translational regulation of nanos by RNA localization.
Nature 369: 315-318
Ge C, Cui X, Wang Y, Hu Y, Fu Z, Zhang D, Cheng Z, Li J (2006) BUD2, encoding an S-
adenosylmethionine decarboxylase, is required for Arabidopsis growth and development.
Cell Res 16: 446-456
Hanfrey C, Sommer S, Mayer MJ, Burtin D, Michael AJ (2001) Arabidopsis polyamine
biosynthesis: absence of ornithine decarboxylase and the mechanism of arginine
decarboxylase activity. Plant J 27: 551-560
Hao YJ, Kitashiba H, Honda C, Nada K, Moriguchi T (2005) Expression of arginine
decarboxylase genes in apple cells and stressed shoots. J Exp Bot 56: 1105-1115
Imai A, Matsuyama T, Hanzawa Y, Akiyama T, Tamaoki M, Saji H, Shirano Y, Kato T,
Hayashi H, Shibata D, Tabata S, Komeda Y, Takahashi T (2004) Spermidine synthase
genes are essential for survival of Arabidopsis. Plant Physiol 135: 1565-1573
Jaakola L, Pirttilä AM, Vuosku J, Hohtola A (2004) Method based on electrophoresis and
gel extraction for obtaining genomic DNA-free cDNA without DNase treatment.
BioTechniques 37: 744-748
Jeffery WB, Tomlinson CR, Brodeur RD (1983) Localization of actin messenger RNA
during early ascidian development. Dev Biol 99: 408-417
Kakkar RK, Sawhney VK (2002) Polyamine research in plants – a changing perspective.
Physiol Plant 116: 281-292
Kaur-Sawhney R, Flores HE, Galston AW (1980) Polyamine-induced DNA synthesis and
mitosis in oat leaf protoplasts. Plant Physiol 65: 368-371
Kindler S, Wang H, Richter D, Tiedge H (2005) RNA transport and local control of
translation. Annu Rev Cell Dev Biol 21: 223-245
www.plantphysiol.orgon May 24, 2018 - Published by Downloaded from Copyright © 2006 American Society of Plant Biologists. All rights reserved.
Krasowski MJ, Owens JN (1993) Ultrastructural and histochemical postfertilization
megagametophyte and zygotic embryo development of white spruce (Picea glauca)
emphasizing the deposition of seed storage products. Can J Bot 71: 98-112
Kumar A, Altabella T, Taylor MA, Tiburcio AF (1997) Recent advances in plant
polyamine research. Trends Plant Sci 2: 124-130
Lin PPC, Egli DB, Li GM, Meckel L (1984) Polyamine titer in the embryonic axis and
cotyledons of Glycine max (L.) during seed growth and maturation. Plant Physiol 76: 366-
371
Mähönen AP, Bonke M, Kauppinen L, Riikonen M, Benfey PN, Helariutta Y (2000) A
novel two-component hybrid molecule regulates vascular morphogenesis of the
Arabidopsis root. Genes Dev 14: 2938-2943
Malmberg RL, Cellino ML (1994) Arginine decarboxylase of oats is activated by enzymatic
cleavage into two polypeptides. J Biol Chem 28: 2703-2706
Martin-Tanguy J (1997) Conjugated polyamines and reproductive development:
Biochemical, molecular and physiological approaches. Physiol Plant 100: 675-688
Minocha R, Long S, Maki H, Minocha SC (1999a) Assays for the activities of polyamine
biosynthetic enzymes using intact tissues. Plant Physiol Bioch 37: 597-603
Minocha SC, Minocha R (1995) Role of polyamines in somatic embryogenesis. In YPS
Bajaj, ed, Biotechnology in Agriculture and Forestry, Vol 30: Somatic Embryogenesis and
Synthetic Seed I. Springer-Verlag, Heidelberg, pp 55-72
Minocha R, Shortle WC, Coughlin DJ, Minocha SC (1996) Effects of A1 on growth,
polyamine metabolism, and inorganic ions in suspension cultures of red spruce (Picea
rubens). Can J For Res 26: 550-559
Minocha R, Smith DR, Reeves C, Steele K, Minocha S (1999b) Polyamine levels during
the development of zygotic and somatic embryos of Pinus radiata. Physiol Plantarum 105:
155-164
Mo H, Pua EC (2002) Up-regulation of arginine decarboxylase gene expression and
accumulation of polyamines in mustard (Brassica juncea) in response to stress. Physiol
Plantarum 114: 439-449
Muller PY, Janovjak H, Miserez AR, Dobbie Z (2002) Processing of gene expression data
generated by quantitative real-time RT-PCR. BioTechniques 32: 1372-1379
Nam KH, Lee SH, Lee JH (1997) Differential expression of ADC mRNA during
development and upon acid stress in soybean (Glycine max) hypocotyls. Plant Cell Physiol
38: 1156-1166
www.plantphysiol.orgon May 24, 2018 - Published by Downloaded from Copyright © 2006 American Society of Plant Biologists. All rights reserved.

Nasmyth K, Jansen RP (1997) The cytoskeleton in mRNA localization and cell
differentiation. Curr Opin Cell Biol 9: 396-400
Niemi K, Sarjala T, Chen X, Häggman H (2002) Spermidine and methylglyoxal
bis(guanylhydrazone) affect maturation and endogenous polyamine content of Scots pine
embryogenic cultures. J Plant Physiol 159: 1155-1158
Oredsson SM (2003) Polyamine dependence of normal cell-cycle progression. Biochem Soc
T 31: 366-370
Owens JN, Øystein J, Dæhlen OG, Skrøppa T (2001) Potential effects of temperature on
early reproductive development and progeny performance in Picea abies (L.) Karst. Scan J
For Res 16: 221-237
Paschalidis KA, Roubelakis-Angelakis KA (2005) Spatial and temporal distribution of
polyamine levels and polyamine anabolism in different organs/tissues of the tobacco plant.
Correlations with age, cell division/expansion, and differentiation. Plant Physiol 138: 142-
152
Pohjanpelto P, Knuutila S (1982) Polyamine deprivation causes major chromosomal
alterations in polyamine-dependent Chinese hamster ovary cell line. Exp Cell Res 141:
333-339
Pollard KJ, Samuels ML, Crowley KA, Hansen JC, Peterson CL (1999) Functional
interaction between GCN5 and polyamines: a new role for core histone acetylation. EMBO
J 18: 5622-5633
Pyronnet S, Pradayrol L, Sonenberg N (2000) A cell cycle-dependent internal ribosome
entry site. Mol Cell 5: 607-616
Santanen A, Simola LK (1992) Changes in polyamine metabolism during somatic
embryogenesis in Picea abies. J Plant Physiol 140: 475-480
Santanen A, Simola LK (1999) Metabolism of L[U-14C]-arginine and L[U-14C]-ornithine in
maturating and vernalized embryos and megagametophytes of Picea abies. Physiol
Plantarum 104: 433-440
Sarjala T, Kaunisto S (1993) Needle polyamine concentrations and potassium nutrition in
Scots pine. Tree Physiol 13: 87-96
Sarjala T, Savonen EM (1994) Seasonal fluctuation in free polyamines in Scots pine
needles. J Plant Phys 144: 720-725
Sarvas R (1962) Investigations on the flowering and seed crop of Pinus sylvestris. Commun
Inst For Fenn 53: 1-198
www.plantphysiol.orgon May 24, 2018 - Published by Downloaded from Copyright © 2006 American Society of Plant Biologists. All rights reserved.

Schipper RG, Cuijpers VMJI, de Groot LHJM, Thio M, Verhofstad AAJ (2004)
Intracellular localization of ornithine decarboxylase and its regulatory protein, antizyme-1.
J Histochem Cytochem 52: 1259-1266
Serafini-Fracassini D (1991) Cell cycle-dependent changes in plant polyamine metabolism.
In RD Slocum, HE Flores, eds, Biochemistry and physiology of polyamines in plants. CRC
Press, Boca Raton, pp 159-173
Simon P (2003) Q-gene:processing quantitative real-time RT-PCR data. Bioinformatics 19:
1439-1440
Singh H (1978) Embryology of gymnosperms. Borntrager, Berlin
Sirois L, Bégin Y, Parent J (1999) Female gametophyte and embryo development of black
spruce along a shore-hinterland climatic gradient of a recently created reservoir, northern
Quebec. Can J Bot 77: 61-69
St Johnston D (1995) The intracellular localization of messenger RNAs. Cell 81: 161-170
Tassoni A, van Buuren M, Franceschetti M, Fornalé S, Bagni N (2000) Polyamine content
and metabolism in Arabidopsis thaliana and effect of spermidine on plant development.
Plant Physiol Biochem 38: 383-393
Theiss C, Bohley P, Voigt J (2002) Regulation by polyamines of ornithine decarboxylase
activity and cell division in the unicellular green alga Chlamydomonas reinhardtii. Plant
Physiol 128: 1470-1479
Tiburcio AF, Altabella T, Borrell A, Masgrau C (1997) Polyamine metabolism and its
regulation. Physiol Plantarum 100: 664-674
Urano K, Yoshiba Y, Nanjo T, Igarashi Y, Seki M, Sekiguchi F, Yamaguchi-Shinozaki
K, Shinozaki K (2003) Characterization of Arabidopsis genes involved in biosynthesis of
polyamines in abiotic stress responses and developmental stages. Plant Cell Environ 26:
1917-1926
Vuosku J, Jaakola L, Jokipii S, Karppinen K, Kämäräinen T, Pelkonen VP, Jokela A,
Sarjala T, Hohtola A, Häggman H (2004) Does extraction of DNA and RNA by
magnetic fishing work for diverse plant species? Mol Biotechnol 27: 209-215
Watson MB, Malmberg RL (1996) Regulation of Arabidopsis thaliana (L.) Heynh. arginine
decarboxylase by potassium deficiency stress. Plant Physiol 111: 1077-1083
Yadav JS, Rajam MV (1998) Temporal regulation of somatic embryogenesis by adjusting
cellular polyamine content in eggplant. Plant Physiol 116: 617-625
Young IY, Ailles L, Deugau K, Kisilevsky R (1991) Transcription of cRNA for in situ
hybridization from polymerase chain reaction-amplified DNA. Lab Invest 64: 709-712
www.plantphysiol.orgon May 24, 2018 - Published by Downloaded from Copyright © 2006 American Society of Plant Biologists. All rights reserved.

FIGURE LEGENDS
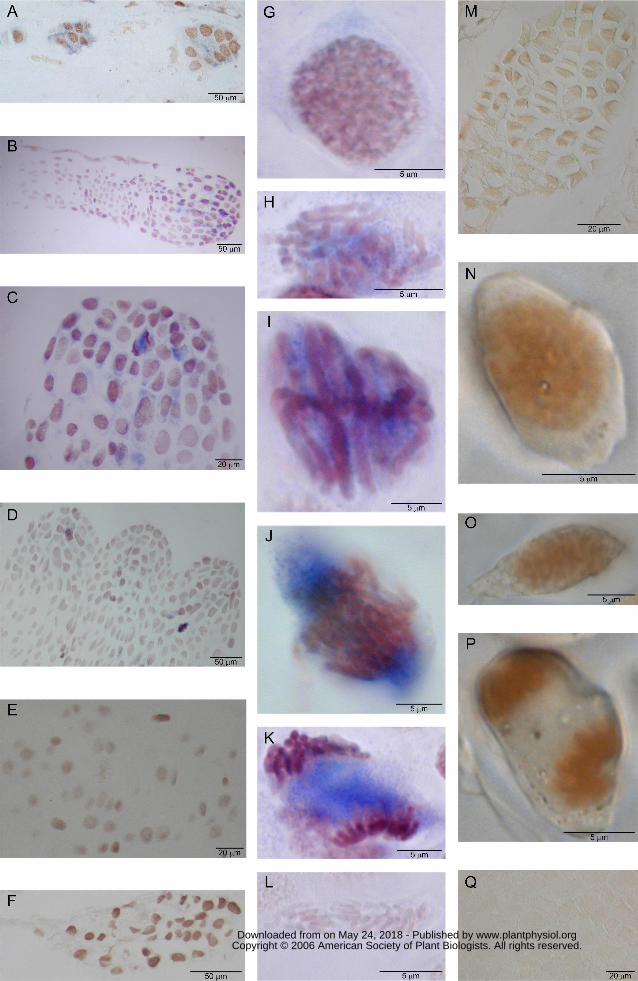
Figure 1. The localization of ADC and ODC mRNAs and ADC enzyme in developing zygotic
embryos of Scots pine. ADC gene expression was localized by in situ hybridization with
DIG-labelled RNA -probes (blue signal) and ADC protein by immunolocalization (brown
signal). The embryo in A was from the sampling date II and the embryos in E, F and M
were from the sampling date III. The embryos in B-D, G-L, N-P and Q were from the
sampling date IV. A, ADC gene expression was localized in the cytoplasm of the cells in
both dominant and subordinate early embryos. B and C, ADC gene expression localized in
the cells of primary shoot and root meristem of late embryo. D, ADC gene expression in
the mitotic cells of shoot meristem in the late embryo at the cotyledonary stage. E, No
label was detected in the sections hybridized with the sense ADC probe. F, No mRNAs of
a putative ODC gene were found in the developing early embryo. G, H, I, J and K, ADC
mRNA transcripts during the mitotic stages in the cells of late embryos. L, No label was
detected in the mitotic cells in the sections hybridized with the ADC sense probe. M and
N, ADC protein was localized in the nuclei of embryos. O and P, ADC protein was located
with the chromosomes in the mitotic cells. Q, No signal was detected in the control
sections incubated with preimmune serum.
Figure 2. The fluctuation of free and soluble conjugated PAs (Put, Spd and Spm) in
developing zygotic embryos of Scots pine. Immature embryos were collected four times in
2001 and 2003 throughout the period of embryo development from two Scots pine clones,
K818 and K884. The free and soluble conjugated PA concentrations are presented relative
to the effective temperature sum (d.d.) and the year (� = 2003, � = 2001). The mean
values of the four replicates pertaining to the same clone, year and sampling date are
connected by solid lines for 2003 and dashed lines for 2001.
Figure 3. The expression of ADC gene in developing zygotic embryos of Scots pine in 2003.
The expression was quantified by real-time PCR and normalized by the expression of the
ACT gene. Observed relative ADC gene expression presented relative to the effective
temperature sum (d.d.) in the clones K884 (�) and K818 (�) with the fitted regression
lines (solid for K884, dashed for K818). There are three replicates per clone and per
sampling date except the missing data set of the clone K818 on sampling date II.
www.plantphysiol.orgon May 24, 2018 - Published by Downloaded from Copyright © 2006 American Society of Plant Biologists. All rights reserved.

Figure 4. ADC and ODC enzyme activities in developing zygotic embryos of Scots pine
presented in relation to the effective temperature sum (d.d.) in the four sampling date in
2003. Enzyme activities were analysed by measuring the 14CO2 evolution of
decarboxylated radiolabelled arginine and ornithine. The black symbols (� and �)
represent the activity measurements from the clone K884 and the open symbols (�, �, �
and �) those from the clone K818. At each sampling date the replicate measurements
(two to three) done from the same protein extraction are marked with the same symbol.
Protein extractions per clone and per sampling date varied from one to four. The locations
of the symbols are horizontally jittered about the exact x-coordinate in order to separate
overlapping values. The geometric mean values for each clone at different sampling dates
are connected with solid line for K884 and dashed line for K818.
www.plantphysiol.orgon May 24, 2018 - Published by Downloaded from Copyright © 2006 American Society of Plant Biologists. All rights reserved.

Table I. Estimated regression coefficients and their 95% error margins (95% EM) from the
models fitted for the polyamine concentrations associated with the explanatory variables C:
clone (0 = K818, 1 = K884), F: fraction (0 = free, 1 = soluble conjugated), V: year (1 = 2001,
0 = 2003), T1: centered and scaled (divided by 100) linear term of the effective temperature
sum (d.d.), T2: quadratic term of the effective temperature sum; and with their mutual
interactions. The residual degrees of freedom are 102 for Put and 106 for Spd and Spm.
Putrescine Spermidine Spermine Coef. 95% EM Coef. 95% EM Coef. 95% EM intercept 61.5 23.2 326.4 53.7 164.4 21.2
F 36.7 31.5 -141.9 72.9 -49.3 28.7
C -0.4 31.5 99.9 72.9 62.5 28.7
V 56.7 31.6 92.1 72.9 -27.4 28.7
T1 -10.4 13.6 8.9 31.6 19.6 12.4
T2 -4.0 12.1 -35.7 28.0 -24.4 11.0
F x C 136.9 40.8 6.3 93.7 13.8 36.9
F x V -42.9 41.2 -4.5 94.4 1.5 37.2
C x V -53.6 44.6 -94.6 94.4 -44.7 37.2
F x T1 -11.0 17.4 0.0 40.4 -16.8 15.9
F x T2 0.4 15.5 5.4 35.7 -1.5 14.1
C x T1 8.1 17.4 -38.2 40.4 -11.5 15.9
C x T2 0.3 15.5 -28.1 35.7 -11.5 14.1
V x T1 -0.7 19.5 -19.6 45.2 -0.2 17.8
V x T2 8.5 17.4 8.5 39.8 12.4 15.7
F x C x V 79.4 46.5 -81.5 104.5 -43.4 41.2
F x C x T1 -37.3 18.4 35.3 42.5 11.9 16.7
F x C x T2 -29.0 16.7 -8.6 37.4 1.2 14.8
F x V x T1 -25.9 22.5 -34.2 52.2 -15.8 20.6
F x V x T2 4.7 20.5 -0.7 46.0 -0.4 18.1
C x V x T1 26.4 22.5 42.9 52.2 -1.3 20.6
C x V x T2 10.8 20.5 28.7 46.0 20.0 18.1
www.plantphysiol.orgon May 24, 2018 - Published by Downloaded from Copyright © 2006 American Society of Plant Biologists. All rights reserved.

Table II. Estimated regression coefficients and their 95% error margins (95% EM) from the
models fitted for the natural logarithms of ADC and ODC enzyme activities associated with
the fixed explanatory variables C: clone (0 = K818,1 = K884), and the linear and quadratic
terms T1 and T2 of the effective temperature sum (centered and scaled by 100), as well as
their interactions. The residual degrees of freedom are 12 for ADC and 13 for ODC.
ADC ODC
Coef. 95% EM Coef. 95% EM
Intercept 3.90 0.43 0.10 0.53
C 0.39 0.85 -1.58 1.03
T1 0.22 0.22 -0.76 0.25
T2 -0.22 0.24 -0.36 0.27
C x T1 0.33 0.36 0.58 0.42
C x T2 -0.13 0.42 0.67 0.50
www.plantphysiol.orgon May 24, 2018 - Published by Downloaded from Copyright © 2006 American Society of Plant Biologists. All rights reserved.
www.plantphysiol.orgon May 24, 2018 - Published by Downloaded from Copyright © 2006 American Society of Plant Biologists. All rights reserved.

www.plantphysiol.orgon May 24, 2018 - Published by Downloaded from Copyright © 2006 American Society of Plant Biologists. All rights reserved.

www.plantphysiol.orgon May 24, 2018 - Published by Downloaded from Copyright © 2006 American Society of Plant Biologists. All rights reserved.

www.plantphysiol.orgon May 24, 2018 - Published by Downloaded from Copyright © 2006 American Society of Plant Biologists. All rights reserved.