1 review mean—arithmetic average, sum of all scores divided by the number of scores...
TRANSCRIPT

11
ReviewReview
Mean—arithmetic average, sum of all Mean—arithmetic average, sum of all scores divided by the number of scoresscores divided by the number of scores
Median—balance point of the data, exact Median—balance point of the data, exact middle of the distribution, 50middle of the distribution, 50thth percentile percentile
Mode—highest frequency, can be more Mode—highest frequency, can be more than onethan one
22
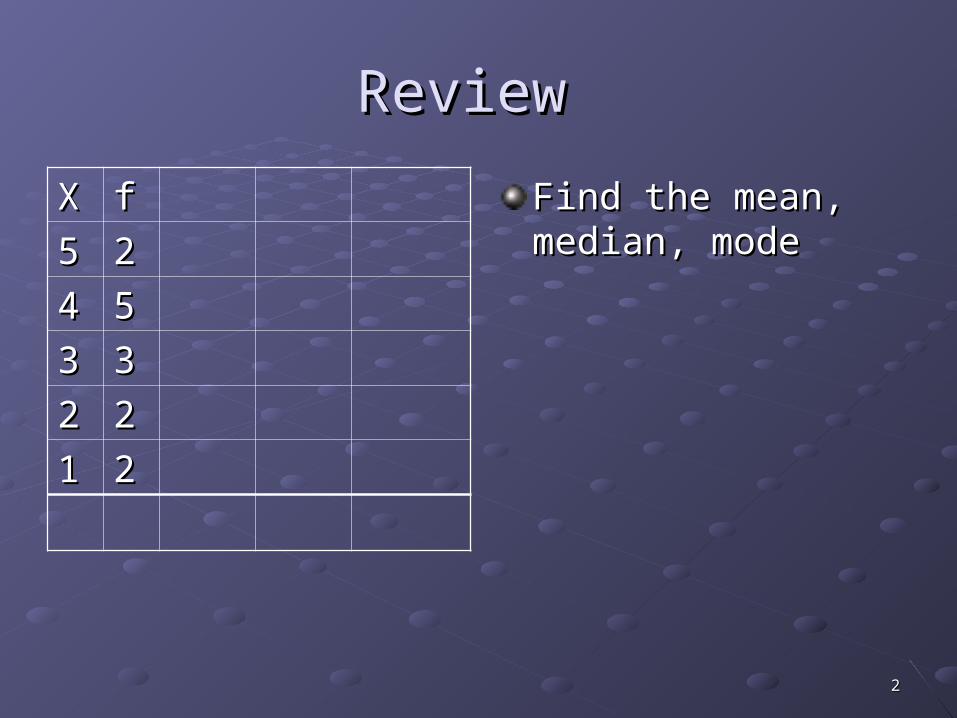
Review Review
Find the mean, Find the mean, median, modemedian, mode
XX ff
55 22
44 55
33 33
22 22
11 22

33
Review Review
Find the mean, Find the mean, median, modemedian, mode
Mean=sum of all Mean=sum of all scores(scores(∑fX)∑fX) /number /number of scores(N)of scores(N)
XX ff fXfX
55 22
44 55
33 33
22 22
11 22
NN ∑∑fXfX

44
Review Review
Find the mean, Find the mean, median, modemedian, mode
Mean=sum of all Mean=sum of all scores(scores(∑fX)∑fX) /number /number of scores(N)of scores(N)
Median=middle point Median=middle point (N-1/2)(N-1/2)thth position position
XX ff fXfX
55 22
44 55
33 33
22 22
11 22

55
Review Review
Find the mean, Find the mean, median, mode median, mode
Mean=sum of all Mean=sum of all scores(scores(∑fX)∑fX) /number /number of scores(N)of scores(N)
Median=middle point Median=middle point (N-1/2)(N-1/2)thth position position
Mode=greatest fMode=greatest f
XX ff fXfX
55 22
44 55
33 33
22 22
11 22

Measures of Variability

77
Major PointsMajor Points
The general problemThe general problem
Range and related statisticsRange and related statistics
Deviation scoresDeviation scores
The variance and standard deviationThe variance and standard deviation
BoxplotsBoxplots
Review questionsReview questions

88
The General ProblemThe General Problem
Central tendency only deals with the Central tendency only deals with the centercenter
DispersionDispersion Variability of the data around somethingVariability of the data around something The spread of the pointsThe spread of the points
Example: Mice and MusicExample: Mice and Music
99
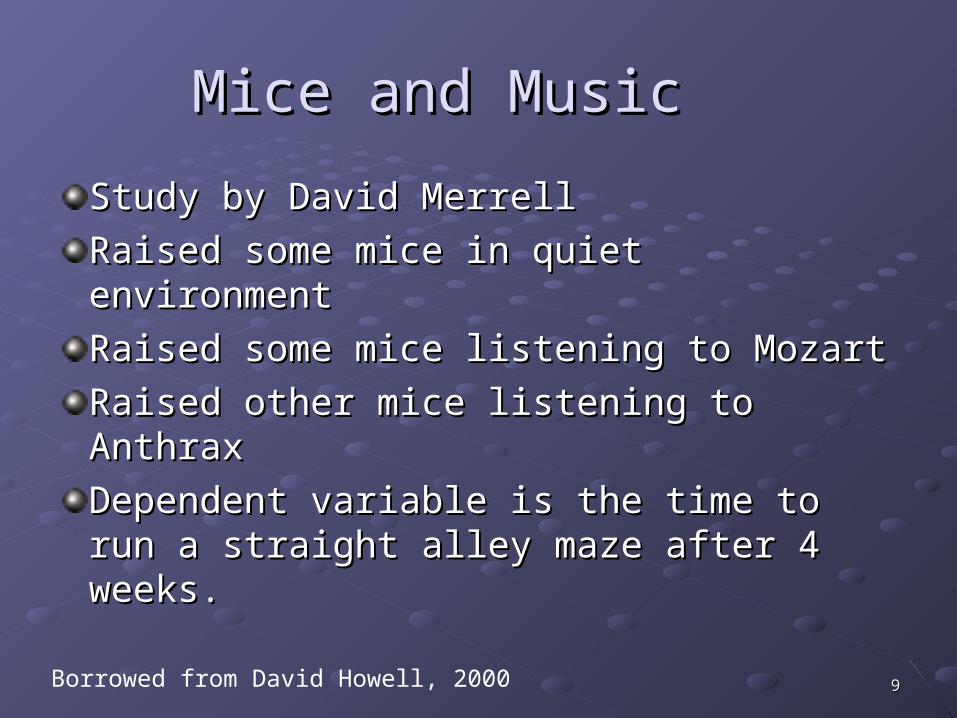
Mice and MusicMice and Music
Study by David MerrellStudy by David Merrell
Raised some mice in quiet environmentRaised some mice in quiet environment
Raised some mice listening to MozartRaised some mice listening to Mozart
Raised other mice listening to AnthraxRaised other mice listening to Anthrax
Dependent variable is the time to run a Dependent variable is the time to run a straight alley maze after 4 weeks.straight alley maze after 4 weeks.
Borrowed from David Howell, 2000

1010
ResultsResults
Anthrax mice took much longer to runAnthrax mice took much longer to run
Much greater variability in Anthrax groupMuch greater variability in Anthrax group See following graphs for Anthrax and MozartSee following graphs for Anthrax and Mozart
We often see greater variability with larger We often see greater variability with larger meanmean

WEEK4
472.2416.7361.1305.6250.0194.4138.983.327.8
Mozart Group12
10
8
6
4
2
0
Std. Dev = 36.10
Mean = 114.6
N = 24.00

WEEK4
2050.0
2000.0
1950.0
1900.0
1850.0
1800.0
1750.0
1700.0
1650.0
1600.0
Anthrax Group10
8
6
4
2
0
Std. Dev = 103.14
Mean = 1825.9
N = 24.00

1313
Range and Related StatisticsRange and Related Statistics
The rangeThe range Distance from lowest to highest scoreDistance from lowest to highest score Too heavily influenced by extremesToo heavily influenced by extremes
The interquartile range (IQR)The interquartile range (IQR) Delete lowest and highest 25% of scoresDelete lowest and highest 25% of scores IQR is range of what remainsIQR is range of what remains May be too May be too littlelittle influenced by extremes influenced by extremes

1414
Trimmed SamplesTrimmed Samples
Delete a fixed (usually small) percentage Delete a fixed (usually small) percentage of extreme scoresof extreme scores
Trimmed statistics are statistics computed Trimmed statistics are statistics computed on trimmed samples.on trimmed samples.

1515
Deviation ScoresDeviation Scores
DefinitionDefinition distance between a score and a measure of distance between a score and a measure of
central tendencycentral tendency
usually deviation around the meanusually deviation around the mean
ImportanceImportance
)( XX

1616
VarianceVariance
Definitional formulaDefinitional formula
ExampleExample
See next slideSee next slide
1)( 2
2
NXX
s

1717
Definitional formulaDefinitional formula
Find the meanFind the mean
N=6N=6
∑∑X=30X=30
30/6=530/6=5
1
)( 22
N
XXs
XX X - XX - X (X - X)(X - X)22
22
44
55
88
77
44
3030
¯̄¯̄
Computing the VarianceComputing the Variance

1818
Computing the VarianceComputing the Variance
XX X - XX - X (X - X)(X - X)22
22 -3-3
44 -1-1
55 00
88 33
77 22
44 -1-1
3030 00
¯̄¯̄
Calculate the Calculate the difference between difference between each score and the each score and the mean and summean and sum
1
)( 22
N
XXs

1919
80.4524
1)( 2
2 NXX
s
Computing the VarianceComputing the Variance
XX X - XX - X (X - X)(X - X)22
22 -3-3 99
44 -1-1 11
55 00 00
88 33 99
77 22 44
44 -1-1 11
3030 00 2424
¯̄¯̄
Calculate the square Calculate the square of the difference of the difference between each score between each score and the mean and and the mean and sumsum
Standard Deviation is Standard Deviation is the square rootthe square root

2020
Standard DeviationStandard Deviation
Definitional formulaDefinitional formula
The square root of the varianceThe square root of the variance
Computational formula based on algebraic Computational formula based on algebraic manipulationmanipulation Makes it easier to calculateMakes it easier to calculate
1)( 2
2
NXX
ss

2121
Computational FormulaComputational Formula

2222
Try one Try one
XX ff
55 22
44 55
33 33
22 22
11 22
NN
1
)( 22
NNX
Xs

2323
Try one Try one
XX ff fXfX
55 22
44 55
33 33
22 22
11 22
NN ∑∑fXfX
1
)( 22
NNX
Xs

2424
Try one Try one
XX ff fXfX
55 22 1010
44 55 2020
33 33 99
22 22 44
11 22 22
1414 4545
1
)( 22
NNX
Xs

2525
Try one Try one
XX ff fXfX XX22 fXfX22
55 22 1010
44 55 2020
33 33 99
22 22 44
11 22 22
1414 4545 ∑∑fXfX22
1
)( 22
NNX
Xs

2626
Try one Try one
XX ff fXfX XX22 fXfX22
55 22 1010 2525 5050
44 55 2020 1616 8080
33 33 99 99 2727
22 22 44 44 88
11 22 22 11 22
1414 4545 167167
1
)( 22
NNX
Xs

2727
XX ff fXfX XX22 fXfX22
55 22 1010 2525 5050
44 55 2020 1616 8080
33 33 99 99 2727
22 22 44 44 88
11 22 22 11 22
1414 4545 167167 11414)45(
1672
s
1
)( 22
NNX
Xs
31.172.113
36.22
13
64.144167
13142025
167
s

2828
EstimatorsEstimators
MeanMean Unbiased estimate of population mean (Unbiased estimate of population mean ())
Define unbiasedDefine unbiased Long range average of statistic is equal to the parameter Long range average of statistic is equal to the parameter
being estimated.being estimated.
VarianceVariance
Unbiased estimate of Unbiased estimate of 22
1)( 2
2
NXX
s
Cont.

2929
Estimators--cont.Estimators--cont.
UsingUsing
gives biased estimategives biased estimate Standard deviationStandard deviation
use square root of use square root of unbiasedunbiased estimate. estimate.
NXX
s2
2 )(

3030
Merrell’s Music Study Merrell’s Music Study SPSS SPSS PrintoutPrintout
WEEK4
Treatment Mean N Std. Deviation
Quiet 307.2319 23 71.8267
Mozart 114.5833 24 36.1017
Anthrax 1825.8889 24 103.1392
Total 755.4601 71 777.9646

3131
BoxplotsBoxplotsThe general problemThe general problem A display that shows dispersion for center and tails of A display that shows dispersion for center and tails of
distributiondistribution
Calculational steps (simple solution)Calculational steps (simple solution) Find medianFind median Find top and bottom 25% points (quartiles)Find top and bottom 25% points (quartiles) eliminate top and bottom 2.5% (fences)eliminate top and bottom 2.5% (fences) Draw boxes to quartiles and whiskers to fences, with Draw boxes to quartiles and whiskers to fences, with
remaining points as outliers remaining points as outliers
Boxplots for comparing groupsBoxplots for comparing groups

3232
Combined Merrell DataCombined Merrell Data
71N =
WEEK4
3000
2000
1000
0
-1000

3333
Merrell Data by GroupMerrell Data by Group
242423N =
Treatment Condition
AnthraxMozartQuiet
WE
EK
4
3000
2000
1000
0
-1000

3434
Review QuestionsReview Questions
What do we look for in a measure of What do we look for in a measure of dispersion?dispersion?
What role do outliers play?What role do outliers play?
Why do we say that the variance is a Why do we say that the variance is a measure of average variability around the measure of average variability around the mean?mean?
Why do we take the square root of the Why do we take the square root of the variance to get the standard deviation?variance to get the standard deviation?
Cont.

3535
Review QuestionsReview Questions--cont.--cont.
How does a boxplot reveal dispersion?How does a boxplot reveal dispersion?
What do David Merrell’s data tell us about What do David Merrell’s data tell us about the effect of music on mice?the effect of music on mice?