1 q09 results presentation
TRANSCRIPT
2
Disclaimer
This presentation may include forward-looking statements about future events or results according
to the regulations of Brazilian and international securities and exchange commissions. These
statements are based on certain assumptions and analyses by the Company that reflect its
experience, the economic environment, future market conditions and events expected by it, many
of which are beyond its control. Important factors that may lead to significant differences between
actual results and the statements of expectations about future events or results include the
company’s business strategy, economic conditions in Brazil and abroad, technology, financial
strategy, client business development, financial market conditions, uncertainty regarding the
results of its future operations, plans, objectives, expectations and intentions, among others. As a
result of these factors, the actual results of the Company may significantly differ from those
mentioned or implicit in the statement of expectations about future events or results.
The information and opinions contained in this presentation should not be understood as a
recommendation to potential investors and no investment decision should be based on the veracity,
currency or completeness of this information or these opinions. No advisors to the company or
parties related to them or their representatives will be responsible for any losses that may result
from the use or the contents of this presentation.

3
Cards Market and CardSystem
Base growth was greater than market
growth;
The unit has the most modern and
complete processing structure in Brazil;
Study of the card market carried out by
the Brazilian Central Bank suggests
creation of a specific regulation for the
segment and opening up of issuers.
Private Label + Credit Market CardSystem
Average Annual Growth - 3 years 20.9% 26.0%
2008 Growth - 12 months 16.0% 18.1%
Source: ABECS, CSU
89 102 124 153 17756 70
87109
127
2005 2006 2007 2008 2009
Growth of the Cards Market
Private Label Credit
(million, end of March, source: ABECS)
8.6 10.4 13.017.6
20.8
2005 2006 2007 2008 2009
CSU Card Base Performance(million, end of March)

4
CardSystem – Operational Data
1Q09 was the best quarter in CSU’s history in terms of card issue;
6 million new cards issued in the last 12 months;
Issue of new cards will grow each year.
Source: CSU
1.1 1.4
1.7 1.6 1.3
1Q08 2Q08 3Q08 4Q08 1Q09
Issue of cards in CSU's base (million, quarter issue)
5
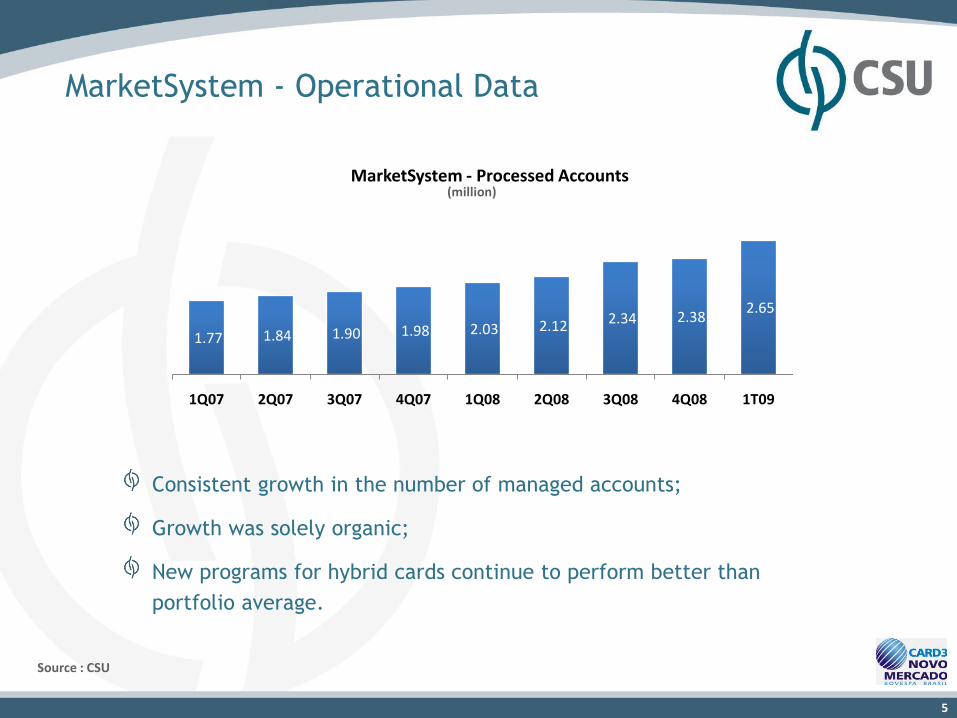
MarketSystem - Operational Data
Consistent growth in the number of managed accounts;
Growth was solely organic;
New programs for hybrid cards continue to perform better than
portfolio average.
Source : CSU
1.77 1.84 1.90 1.98 2.03 2.12 2.34 2.38 2.65
1Q07 2Q07 3Q07 4Q07 1Q08 2Q08 3Q08 4Q08 1T09
MarketSystem - Processed Accounts(million)

6
TeleSystem / Credit&Risk
Decree 6,523 led companies contracting call center
services to expand the scope of their agreements,
consequently increasing the demand for these
services;
Expansion of workstations;
Transfer of Credit&Risk’s workstations to TeleSystem
to meet the demand for specific operations.
758 776 748 619 435 282 305
3,114 2,546 2,218
3,476 3,445 3,314 3,288
3Q07 4Q07 1Q08 2Q08 3Q08 4Q08 1Q09
PAs in operation at TeleSystem and Credit&Risk
PA's Credit&Risk PA's TeleSystem
3,872 3,596
3,880 4,095
2,966 3,322 3,593
7
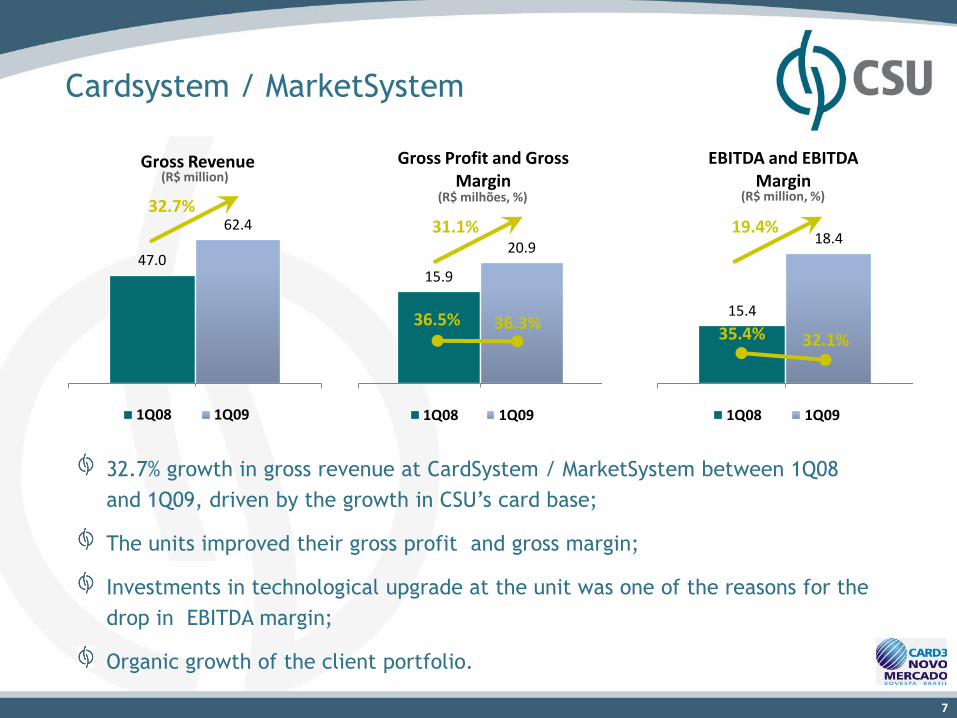
15.4
18.4
EBITDA and EBITDA Margin
1Q08 1Q09
15.9
20.9
Gross Profit and Gross Margin
1Q08 1Q09
Cardsystem / MarketSystem
36.3%36.5%
32.7% growth in gross revenue at CardSystem / MarketSystem between 1Q08
and 1Q09, driven by the growth in CSU’s card base;
The units improved their gross profit and gross margin;
Investments in technological upgrade at the unit was one of the reasons for the
drop in EBITDA margin;
Organic growth of the client portfolio.
31.1% 19.4%
32.1%35.4%
(R$ milhões, %) (R$ million, %)
47.0
62.4
Gross Revenue
1Q08 1Q09
32.7%
(R$ million)

8
(0.4)
2.0
EBITDA
1Q08 1Q09
41.2
44.9
Gross Revenue
1Q08 1Q09
TeleSystem / Credit&Risk
The new operational setup at the call centers in Recife has optimized
operations, improved service quality and reduced costs;
The company plans to extend this structure to workstations at other sites
in 2009, to continue the improvement in the units’ profitability
indicators.
9.0%
(R$ million)(R$ million) (R$ million)
(0.6)
2.9
Gross Profit
1Q08 1Q09
9
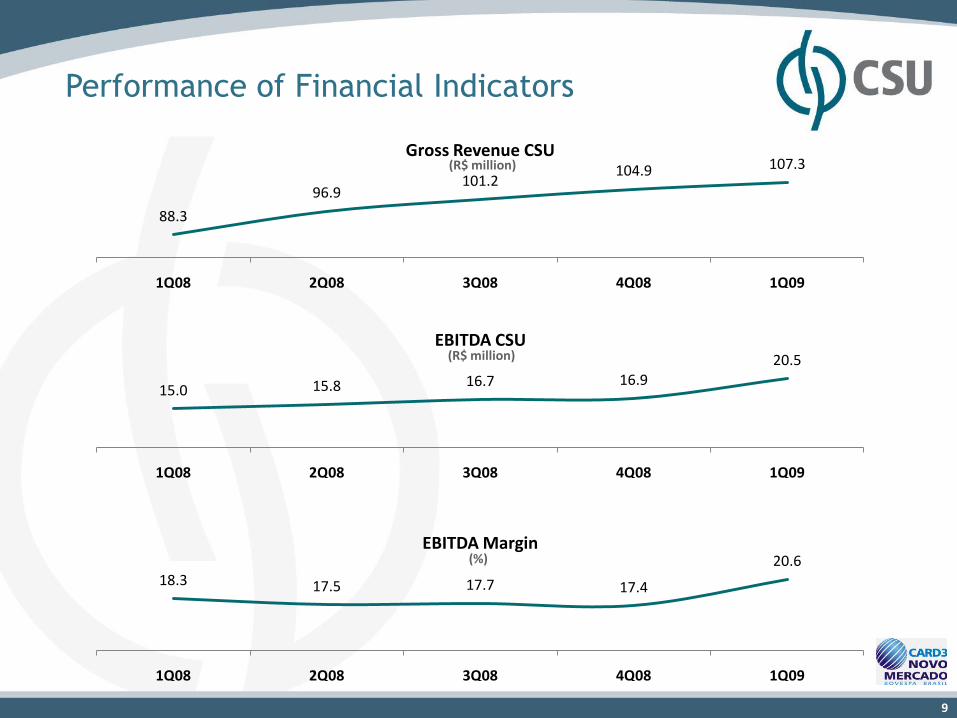
Performance of Financial Indicators
88.3
96.9101.2
104.9 107.3
1Q08 2Q08 3Q08 4Q08 1Q09
Gross Revenue CSU
15.0 15.8 16.7 16.920.5
1Q08 2Q08 3Q08 4Q08 1Q09
EBITDA CSU
18.3 17.5 17.7 17.4
20.6
1Q08 2Q08 3Q08 4Q08 1Q09
EBITDA Margin
(R$ million)
(R$ million)
(%)
10
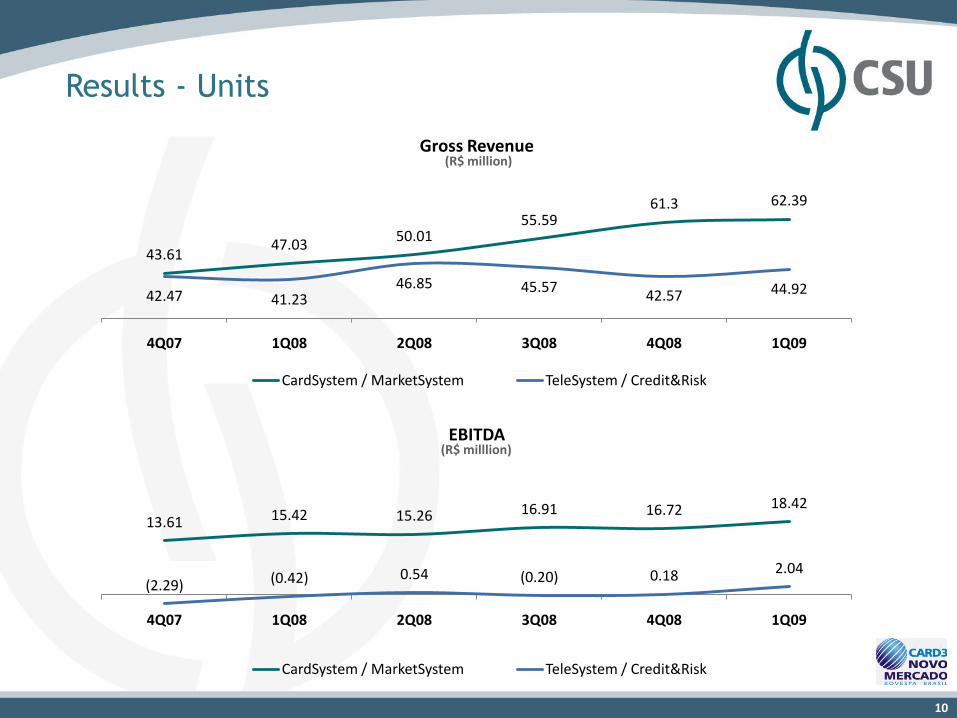
13.61 15.42 15.26 16.91 16.72 18.42
(2.29) (0.42) 0.54 (0.20) 0.18 2.04
4Q07 1Q08 2Q08 3Q08 4Q08 1Q09
EBITDA
CardSystem / MarketSystem TeleSystem / Credit&Risk
43.6147.03
50.0155.59
61.3 62.39
42.47 41.2346.85 45.57
42.57 44.92
4Q07 1Q08 2Q08 3Q08 4Q08 1Q09
Gross Revenue
CardSystem / MarketSystem TeleSystem / Credit&Risk
Results - Units
(R$ million)
(R$ milllion)
11
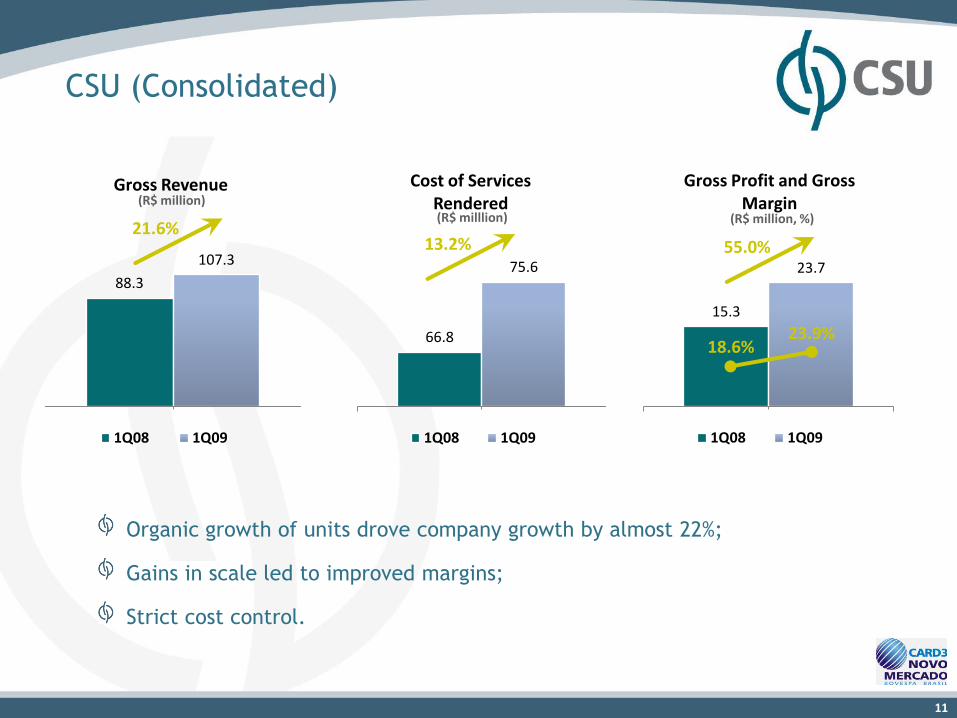
15.3
23.7
Gross Profit and Gross Margin
1Q08 1Q09
66.8
75.6
Cost of Services Rendered
1Q08 1Q09
88.3
107.3
Gross Revenue
1Q08 1Q09
CSU (Consolidated)
Organic growth of units drove company growth by almost 22%;
Gains in scale led to improved margins;
Strict cost control.
21.6%
23.9%18.6%
13.2% 55.0%
(R$ million)
(R$ million, %)(R$ milllion)
12
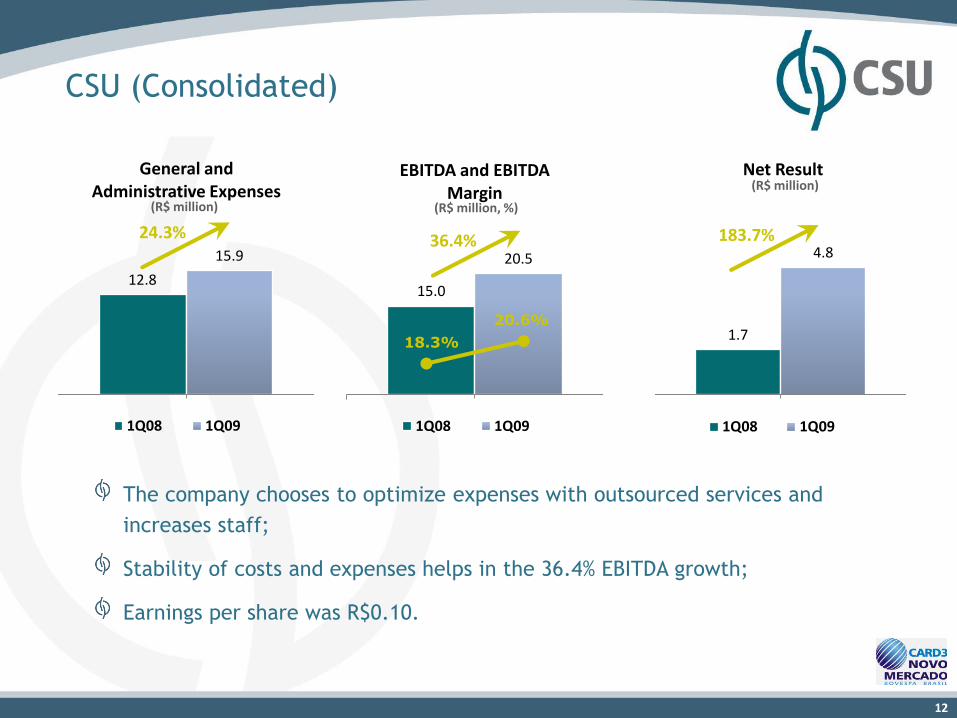
1.7
4.8
Net Result
1Q08 1Q09
15.0
20.5
EBITDA and EBITDA Margin
1Q08 1Q09
12.8
15.9
General and Administrative Expenses
1Q08 1Q09
CSU (Consolidated)
20.6%
18.3%
The company chooses to optimize expenses with outsourced services and
increases staff;
Stability of costs and expenses helps in the 36.4% EBITDA growth;
Earnings per share was R$0.10.
24.3% 183.7%36.4%
(R$ million) (R$ million, %)
(R$ million)

13
63.2 68.5 70.8 60.3
10.7 4.8 4.0 4.6
26.3 22.7 17.9 22.8
0.5 0.3 0.1 -
2Q08 3Q08 4Q08 1Q09
Debt Composition
W. Capital Overdraft Leasing BNDES
Debt and Capex
Debt - R$ million
1Q09 1Q08 4Q08
Short Term Debt 58.0 55.8 62.5
Financing and Debt loan 47.4 33.3 49.7
Leasing 10.7 22.5 12.8
Long Term Debt 29.7 58.6 34.0
Financing and Debt loan 17.9 49.0 25.4
Leasing 11.8 9.7 8.6
Gross Debt 87.7 114.3 96.5
(-) Cash 1.5 1.8 1.6
Net Cash (Debt) 86.3 112.5 94.9
Debt:
Cash generated in three months enabled
the company to reduce net debt from R$
94.9 million to R$ 86.3 million;
The company sought to reduce financial
expenses by paying off debt installments
on maturity;
CSU neither has loans indexed to the US
dollar nor derivatives contracts. Its debt
is in Brazilian reais and indexed to the
interbank (CDI) rate.
(R$ million, end of the period)
14
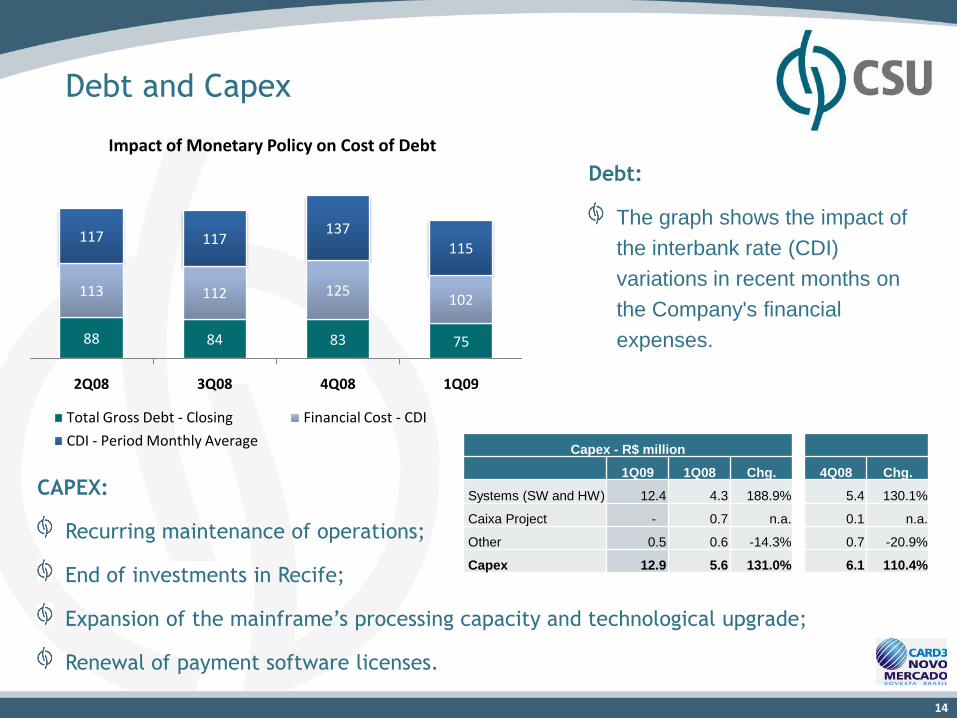
CAPEX:
Recurring maintenance of operations;
End of investments in Recife;
Expansion of the mainframe’s processing capacity and technological upgrade;
Renewal of payment software licenses.
Debt and Capex
Debt:
The graph shows the impact of
the interbank rate (CDI)
variations in recent months on
the Company's financial
expenses.
Capex - R$ million
1Q09 1Q08 Chg. 4Q08 Chg.
Systems (SW and HW) 12.4 4.3 188.9% 5.4 130.1%
Caixa Project - 0.7 n.a. 0.1 n.a.
Other 0.5 0.6 -14.3% 0.7 -20.9%
Capex 12.9 5.6 131.0% 6.1 110.4%
88 84 83 75
113 112 125102
117 117137
115
2Q08 3Q08 4Q08 1Q09
Impact of Monetary Policy on Cost of Debt
Total Gross Debt - Closing Financial Cost - CDI
CDI - Period Monthly Average

15
Social Responsibility and Sustainability
CSU Institute
Provides job-oriented training
CSU carries out the following Socio-Environmental Responsibility projects:
Environmental Responsibility
Selective waste collection for the recycling project, whose sale proceeds
are donated to the CSU institute
Centro Crescer Sorrindo (Grow-up Smiling Center)
Crèche in Belo Horizonte for children from low-income communities

16
Key Strategies for 2009
Maintain investments to ensure growth of all of the Company’s units;
Finalize the new organizational structure of TeleSystem and Credit&Risk;
Increase profitability and margins of CSU as a whole.
17
CSU CardSystem S/A
Questions and Answers
Décio Burd
Phone: (0xx55 11) 3030-3821
Email: [email protected]
Site: www.csu.com.br/ri