1 predicting bidders' willingness to pay in online multi-unit ascending auctions
TRANSCRIPT

1
Predicting Bidders’ Willingness to Pay in Online Multi-Unit Ascending Auctions:
Analytical and Empirical Insights
Ravi Bapna1 ([email protected])
Paulo Goes1
Alok Gupta2 ([email protected])
Gilbert Karuga3 ([email protected])
1 Dept. of Operations & Information Management U-41 IM, School of Business University of Connecticut Storrs, CT. 06269 2 Information and Decision Sciences Department University of Minnesota 3-365 Carlson School of Management 321- 19th Avenue South Minneapolis, MN 55455 3 Accounting and Information Systems School of business University of Kansas 1300 Sunnyside Avenue Lawrence, KS. 66045
2
Acknowledgement
Alok Gupta’s research is supported by NSF CAREER grant #IIS-0301239, but does not necessarily reflect the views of the NSF. Partial support for this research was also provided by TECI - the Treibick Electronic Commerce Initiative, OPIM/School of Business, University of Connecticut. An earlier version of this paper was presented at WITS2002, Barcelona, Spain and was nominated for the best paper award. The authors thank the 3 anonymous reviewers for their valuable suggestions.

3
Abstract
A large fraction of online auction activity deals with selling multiple identical units of an item,
using progressive discriminatory or uniform pricing approaches. Our research objective is to gain
insights into the price formation process of such auctions, focusing primarily on the progressive
bid information that is revealed to infer bidders’ willingness to pay (WTP) in real time. We
derive a priori estimates of bidders’ maximum willingness to pay based on the assumption of a
myopic best response relationship between the bids made and their underlying valuations.
Unlike prior econometric studies that utilize aggregate data to understand underlying demand
curves of products, we use an automated agent to capture observable micro-data from bidding
activity in several hundred Internet auctions. We present an analytical model for myopic best
response bidding in multi-unit progressive discriminatory (a.k.a. Yankee) and uniform pricing
options, and use the inverse function to estimate the underlying willingness to pay from the joint
consideration of the revealed bid values and the bid strategies adopted. We test the WTP
prediction model against thousands of bids made on hundreds of real online auctions from
Samsclub.com and Ubid.com. Our analysis is able to accurately “type” the bidding strategy
based on observable variables using a Logit classification model. Results indicate that
approximately 2/3 of online bidders can be considered as using a myopic best response strategy.
Our prediction results indicate that we are able to estimate, on average, within 3% of revealed
willingness to pay for Yankee auctions, and within 4.7% for uniform multi-unit auctions. In
addition, we are able to estimate, on average, within 7% of the final auction price by the 30th
time percentile of the uniform price auctions, and within 10% of the final auction price by the
40th time percentile of a discriminatory Yankee auction.

4
1. Introduction and Background
Online auctions exemplify the Internet’s ability to become a temporally and spatially
unconstrained market maker. A large fraction of online auction activity deals with selling
multiple identical units of an item, such as aging computer hardware, using either a
discriminatory (Ubid.com) or a uniform (Samsclub.com) pricing approach. Our research
objective is to gain deeper insights into the price formation process of auctions that progressively
reveal more information about bidders’ willingness to pay, and use those insights into deriving a
priori estimates of the expected bid revisions.
We should point out the subtle distinction between the traditional notion of the valuation
of a product and our use of the phrase willingness to pay. Both reflect private information that
the bidder possesses, but given the online context, willingness to pay bounds valuations from
below. This is primarily driven by the use of a suggested retail price signal that effectively caps
the willingness to pay, irrespective of the valuations. In no case, in our extensive dataset of
consisting of 78,014 bids from over 900 online auctions, did the final bid exceed 90% of the
suggested retail price. Section 3 describes this in more detail. For this reason, in the rest of this
paper we use the phrase Willingness To Pay (WTP).
While demand estimation has been the focus of many econometric papers, it has typically
been done using aggregate data, with results hinging on some tenuous assumptions about
consumers’ preferences. In contrast, we rely on Internet enabled multi-unit auctions to undertake
demand estimation using micro-data, making empirically established, and also less demanding
assumptions about bidder behavior.
Progressive ascending multi-unit auctions have received only limited attention in the
literature, usually under a set of assumptions that do not hold up in the online context. For

5
instance, bidders are assumed to be homogeneous, typically typed as being symmetric, risk-
neutral, and adopting Bayesian-Nash equilibrium strategies. While tenable in the context of
face-to-face single item auctions, this set of assumptions readily breaks down in the vast majority
of multi-unit online auctions. For such auctions, it is well known that the computation of
equilibrium bidding strategies is intractable (Nautz & Wolfsetter, 1997). A key distinguishing
feature of our work is a minimalist myopic best response bidding assumption that ties bidders
revealed bids to their underlying willingness to pays. Our empirical results, described in detail
in Section 5, indicate that approximately 2/3 of online bidders conform to this strategy.
In this research, we wish to fill this gap in the literature by creating an analytical model
that capitalizes on the online environment’s enhanced information acquisition capabilities. We
begin by tackling the tricky issue of myopically predicting a consumer’s willingness to pay for a
product, based on the joint consideration of the bidding strategy pursued and the bid values
revealed, both of which are observable on the Internet. The key ingredients here are an
understanding of the bidding strategies pursued by the bidders, developing a real-time ability to
detect such strategies as the auction progresses (by means of a logistic classification model) and
finally, an analytical model that imputes a bidder’s wiliness to pay from the bids made. We
present an analytical relationship ̧for both discriminatory (a.k.a. Yankee auctions) and uniform
pricing auctions, between the bids made and the private underlying willingness to pay, assuming
a myopic best response strategy that is adopted by a significant percentage of online bidders.
In order to test the analytical model for predicting bidders’ willingness to pay, we use an
automated agent based data collection tool, and measure the predictions against the revealed
preferences observed in the thousands of bids made on hundreds of real online auctions from
Samsclub.com. Our data analysis indicates that the classification model is able to accurately

6
“type” the bidding strategy based on observable variables, and the prediction model comes close
to predicting the bidder’s wiliness to pay, as estimated by their final bids.
Bapna, Goes and Gupta (2003a) and Engelbrecht-Wiggans (1999) demonstrate that
progressive multi-unit auctions have multiple equilibria, some of which are more desirable than
others, from a revenue perspective. Further, Bapna, Goes and Gupta (2003b) have also shown
that online auctioneers are often far away from optimal mechanism design choices that could
increase their likelihoods of obtaining the desirable equilibria. In this context, real-time value
discovery tools, such as the one demonstrated in this paper, will provide the foundation for
dynamically calibrating the online auction mechanism, so as to maximize their likelihood of
obtaining the desirable equilibria. They can also serve as building blocks for designing the next
generation of smart bidding agents whose incentives are aligned with bidders.
In this paper, our primary research goal is to demonstrate how we can assess bidders’
willingness to pay in progressive multi-unit auctions. This predicted WTP also allows us to
estimate, with high accuracy, the expected closing price of these auctions, during early stages of
the auction. To the best of our knowledge, no other study has used the enhanced information
acquisition and processing capabilities of the online environment, where observance of the price
formation process can be used to infer bidder willingness to pay in real time.
The rest of this paper is organized as follows. In section 2, we provide an overview of the
literature on online auctions and value prediction. In section 3, we provide insights into the
market mechanism that we are investigating. We describe its basic design and provide some
performance indicators. In section 4, we develop the analytical model for predicting bidder’s
willingness to pay. The bidder strategy classification and prediction accuracy are tested
7
empirically in sections 5 and 6 respectively. Lastly, in section 7 we conclude and present
directions for future work.
2. Relevant Literature
Given the vast body of auction literature [see, for example, McAfee and McMillan
(1987), Milgrom and Weber (1982), Milgrom (1989), Rothkopf and Harstad (1994) and
Menezes (1996) for a detailed literature review and analysis] it is instructive to begin by briefly
examining what, if anything, is new about online auctions. Arguably, online auctions have
expanded scope and scale, compared to their traditional counterparts. There is early evidence that
participation in online auctions is endogenously influenced ([Bajari and Hortascu (2001)] have
shown, with data from eBay, that modifying the mechanism affects the entry decisions), while
the traditional assumption in the literature takes the number of bidders at an auction as
exogenously given [Paarsch (1992), Laffont, Ossard and Vuong (1995)]. The expanded scale and
scope of the auction has made the participation of online auctions non-captive of its audience.
The bidders in online auctions come and go at will, while in traditional environments bidders are
captivated through the close of the auction. Particularly relevant to our work are the enhanced
computational and networking resources that have made multi-unit auctions more feasible.
Multiple units can be sold simultaneously, not as a single lot, but to multiple buyers who exhaust
the lot.
Another significant difference between the two auction environments is that the online
environment does not benefit from the skills and experience of human auctioneers. The online
auctions are propelled by static rules that govern the constitution and submission of valid bids,
while traditional auctions benefit from the experience of the auctioneer to pit bidders against

8
each other by skillfully assessing the bidders utility and pacing the auction bidding accordingly.
Put succinctly, our research is aimed at marrying the best of both worlds. Our goal is to
commoditize the human expert who can run a single auction expertly, and substitute it with a
computationally intensive real-time decision making tool that could, armed with the prediction
information which is the focus of this paper, potentially support the simultaneous conduction of
hundreds of online auctions in a more efficient manner.
Note that a recurring theme in this study is the use of the information available on hand to
the online auctioneer. Thus, critical to our work is the open auction format in which value signals
are iteratively broadcasted to the participating agents. If understood correctly, these signals can
explain the underlying bidder valuations or reserve prices, and can form a vital input in
enhancing a mechanisms capability to equitably allocate resources. Carare (2003) demonstrates
the utility of working with micro-data, observable in the online auction environment, to derive
marginal valuations of bidders’ for CPU specific variables. The goal of Carare (2003) is to
recover distributions of valuations for a specific product, namely computer processors, and it
uses data solely from discriminatory (pay-your-bid) online auctions. Our work, in contrast,
attempts at modeling bidding behavior for real-time predictive purposes, for a broad spectrum of
products sold through, both uniform and discriminatory, multi-unit online auctions4.
Crampton (1998) identifies the benefits of progressive open multi-unit auctions over their
sealed bid counterparts; (i) efficiency of the price discovery process; (ii) revenue maximization;
(iii) reduction of the winners curse; and (iv) privacy and implementation. On the other hand,
Engelbrecht-Wiggans and Kahn (1997) and Engelbrecht-Wiggans et.al (1999), show that multi-
unit auctions, especially those that use a uniform pricing scheme, give bidders an incentive to
reduce their demand, resulting in inefficient allocations. Ausubel (1997) proposed an ascending- 4 Both are widely used in the B2C online market. Ubid.com and Samsclub.com are representative popular sites.

9
bid auction for multiple-units, that ameliorates the demand reduction incentive in multi-unit
auction by progressively and iteratively increasing the “asking” price with each iteration of the
auction. However, Ausubel (1997) does not show how auctioneers should determine the
increments of the “ask” price. The price increment aspect has implications on auction efficiency
and revenue. We posit that accurate prediction of bidders’ willingness to pay can form the basis
of dynamically determining optimal asks. This remains a promising area of future research.
The utility of valuation prediction has been recognized in the Artificial Intelligence field,
where automated agents employ value discovery models as components of bidding agents.
Parkes and Ungar (2000), use the notion of myopic best-response bidding strategies among
agents to illustrate how proxy bidders that embrace this strategy can be shielded from
manipulation. In their paper, myopic best response is described as a bidding strategy where
bidders submit bids that maximize their utility, given the prevailing prices. An initial research
challenge in adopting the Parkes and Ungar (2000) approach is determining whether such
bidders exist in the online environment we are considering. This argument connotates that
bidders are perhaps non-homogenous in their bidding approaches in the online environment, and
is supported by the early work in this area of Bapna, Goes and Gupta (2001) who identify at least
three different bidding strategies adopted in Yankee auctions. For a real-time prediction and
calibration approach to be applicable it is first necessary to understand the bidding strategy space
adopted by the bidders, and then have the ability to use the information available during the
course of the auction to accurately type the bidders into the strategic space. We demonstrate
which categories of bidder’s fall under the myopic best response bidding strategy bucket, and
how to detect them in real time.
10
In a related study, Plott and Salmon (2001), use a surplus maximization strategy to
describe bidding behavior in simultaneous ascending auctions. Although the auction mechanism
is different from the one studied by Parkes and Ungar (2000), the notion of myopic best response
is used as a way of tying bidders’ iterative type revelation, to their wiliness to pay.
Attempts to predict wiliness to pay among bidders are done as an effort to increase the
efficiency of resource allocation. Even for fairly well developed markets, such as the exchange
markets for financial instruments, predictions of agents’ valuations has been attempted through
the establishment of market pre-opening games that solicit bidder demands without actual
commitments. Using the Paris Bourse as a test bed, Biais et al (1999), examined the accuracy of
valuation information derived from pre-opening market trade games. Their study shows that
although the information derived from such games is noisy in the early stages of the game, there
is some convergence to true market values as the market opening time approaches. The approach
of the price formation study by Biais et al (1999), depicts environmental similarity to our
approach of predicting bidder wiliness to pay in open ascending price auctions. The initial phase
of such auctions is equivalent to the pre-opening game at the Paris Bourse, and the later stages of
the auction can expect to witness more concerted and accurate revelations. Consequently, we
expect our prediction results to improve as the auction progresses, a result we demonstrate.
Other studies have approached value prediction as a learning activity, where the predictor
seeks to know the actual bidder valuation that is masked behind observed bids. Economic game
theory literature provides two dominantly used models of agent learning: the fictitious play and
reinforced learning model. Dekel, Fudenberg, and Levin (2001) provide insights of these two
learning models in the context of playing Bayesian games. Their results show the conditions
necessary for Nash equilibrium play in repeated games. A limitation of their study is the very

11
restrictive assumptions necessary to justify the concept of Nash equilibrium. Additionally, the
study underscores the complexity of the problem with growing number of bidders and bidder
strategies. The study takes the context of a repeated game. Although an iterative auction provides
multiple opportunities for bidders to revise their bids, each bid revision occurs in a different
context from the previous one. The prices, the bidders, and essentially the auction environment
are different.
In the next section we develop our wiliness to pay prediction model.
3. Progressive Online Multi-unit Auctions
Our research deals with a popular online auction mechanism in the wider B2C category
of auctions. This mechanism offers consumers multiple units of the same item. Bidders compete
for the items, with each bidder submitting a bid indicating the quantity they desire and the per
unit price they are willing to pay. These auctions are conducted in an open format and bidders
can see the bids of competing bidders. Bidder participation in these auctions increases over time.
Bidders join the auction at anytime during the auction duration. Thus although the auctions share
some similarities to the traditional auctions, bidders are not captives of the auction process, as is
the case in the latter mechanism.
The auctioneer spells out auction rules that govern the bidding activity. The main sets of
rules guide the constitution and submission of bids are as follows:
The minimum required bid: All bidders are expected to submit bids that are at least as
high as the minimum required bid. This rule is important as long as the units supplied are fewer
than demand. When demand quantities exceed the lot size, subsequent bidding is guided only by
the bid increment. The bid increment is the minimum increment by which a bidder must exceed
12
the minimum winning bid in order to win an item in the auction. If a bidder exists that is willing
to bid at new this level, the minimum winning bid is displaced from the winning list and replace
by the new bidder. Bidders are not bound to bid in increments of the bid increment, and as noted
by Easley and Tenorio (1999), jump bidding is often observed in Yankee auctions.
The auction sites give the auction closing time. Some auctions sites extend the auction
duration if bidding activity is observed at last few minutes of the auction. Samsclub.com auctions
refer to this design as Popcorn auctions.
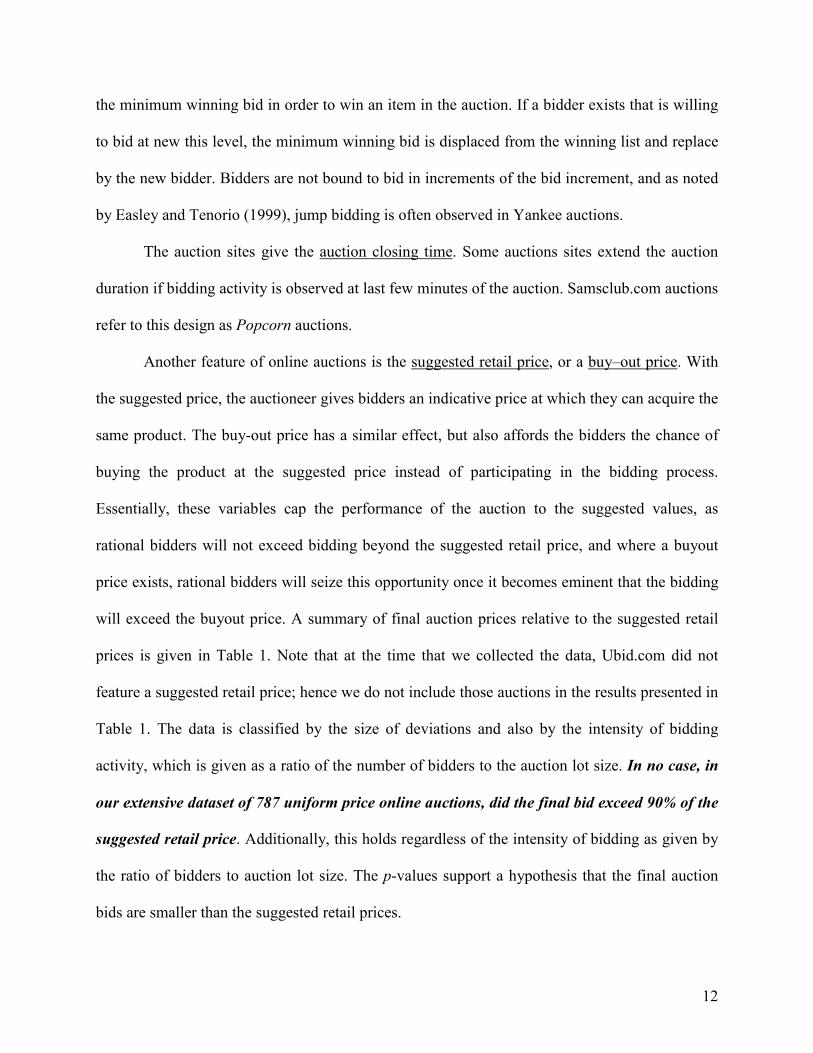
Another feature of online auctions is the suggested retail price, or a buy–out price. With
the suggested price, the auctioneer gives bidders an indicative price at which they can acquire the
same product. The buy-out price has a similar effect, but also affords the bidders the chance of
buying the product at the suggested price instead of participating in the bidding process.
Essentially, these variables cap the performance of the auction to the suggested values, as
rational bidders will not exceed bidding beyond the suggested retail price, and where a buyout
price exists, rational bidders will seize this opportunity once it becomes eminent that the bidding
will exceed the buyout price. A summary of final auction prices relative to the suggested retail
prices is given in Table 1. Note that at the time that we collected the data, Ubid.com did not
feature a suggested retail price; hence we do not include those auctions in the results presented in
Table 1. The data is classified by the size of deviations and also by the intensity of bidding
activity, which is given as a ratio of the number of bidders to the auction lot size. In no case, in
our extensive dataset of 787 uniform price online auctions, did the final bid exceed 90% of the
suggested retail price. Additionally, this holds regardless of the intensity of bidding as given by
the ratio of bidders to auction lot size. The p-values support a hypothesis that the final auction
bids are smaller than the suggested retail prices.

13
Bidders to lot size ratio < -50% -50% - < -20% -20% - < -10%
1 Number of bidders 153 117 2 Average deviations -63.49% -37.37% -18.46% P- value 0.000 0.000 0.005
>1 – 2 Number of bidders 732 178 3 Average deviations -63.42% -40.41% -15.39% P- value 0.000 0.000 0.000
>2 -3 Number of bidders 44 9 1 Average deviations -61.80% -34.73% -13.33% P- value 0.000 0.000 0.000
> 3 Number of bidders 5 1 1 Average deviations -66.25% -47.37% -13.33% P- value 0.000 0.000 0.000
Table 1 : Percent Deviation of Finale Bids to Suggested Retail Prices
We can surmise from these results that the bidders willingness to pay is capped by the
suggested retail prices. In the next section we provide a method for iteratively predicting the
bidders’ willingness to pay.
4. Prediction Model - Myopic Best Response Strategy
Our prediction is based on the assumption that there exists a myopic best response
strategy that defines the relationship between the underlying value of a product and the bid made
by the bidder in a competitive exchange. We will later develop a classification scheme that will
be able to detect, in real time, bidders who do and do not adopt this strategy.
We begin with the model for the myopic best response bidding strategy. This strategy can
be interpreted as a surplus-maximizing bid calculated by a bidder in a given round of the
auctions assuming that all his competitors bids remain unchanged from the previous round. As
new arrivals come in, and bidders get displaced from the winning list, we allow for belief
revision (in a Bayesian sense) by the same bidder, to account for the additional information that

14
is available. This results in a revision of the bidder’s willingness to pay each time a bidder
revises her bid.
Consider an auction for N units of an item. Let the current winning bids be denoted by
Nxxx ,...,, 21 , ordered by magnitude and within magnitude, by time of submission. Bidders
submitting these bids are assumed to have private willingness to pay (WTP) values equal to
NWWW ,...,, 21 respectively. These WTP values are bounded below by the bids already submitted,
that is NN xWxWxW ≥≥≥ ,...,, 2211 . When a new bid z is received, it must be greater than 1x ,
which is displaced from the winning list. We assume that the new bid z was determined to
myopically optimize the expected gain that the bidder will derive from the auction. The myopic
best response (hereafter referred to as MBR) strategy forms the basis of our WTP prediction
approach. Much like the myopic best-response bidding strategy of Parkes and Ungar (2000), our
strategy maximizes a bidders expected surplus, given the already submitted bids and a belief on
the actual WTP values of bidders who submitted the earlier bids. The belief regarding other
bidders WTP values is a probability distribution with support in the range of the lowest winning
bid and an upper bound, which can be set to a publicly known price for the item being auctioned,
such as the suggested retail price for the auction. Recall, that our empirical analysis of the
suggested retail price (Table 1) indicated that it was indeed an effective cap on the support of the
distribution The myopic approach allows for belief revision as the auction progresses, as bidders
who resubmit bids revise their initial beliefs about others’ WTP values. Implicit in the above
discussion is the condition, that a significant percentage of bidders do indeed use this strategy.
We empirically test for this condition in section 5.
Let the bidder who submitted the new bid z have a WTP value denoted byW . Suppose
that the new bid z is greater than k of the current winning bids. Therefore, the new sequence of

15
winning bids is Nkk xxzxxx ,...,,,,....,, 132 + . For the new bidder, assuming a MBR strategy, to win
given this state of the auction, at least one of the k bidders whose bids are smaller than z must
have a WTP value that is less than z , assuming no new bidders join the auction. This search is
conducted across the known all potential bidders, those that have revealed some preference. As
the approach allows for bid revisions, the information signals of the new arrivals are, by design,
captured ex post.
Let the new bidder’s belief about the WTP values of any of the current winners, be an
independent random variable with a density function if , and a distribution function iF , with
support in the range [ ]mx ,1 , where 1x is the smallest winning bid, and m is an indicative fixed
price for the item. The indicative fixed price could be assessed using price comparison agents
that are available on the Internet. Also, a number of online auction sites provide indicative retail
prices for items being auctioned5. Figure 1 below illustrates a generic belief function for a
specific bidder’s WTP value, conditional on the submitted bid.
Figure 1: Willingness to Pay Value Belief Function
The probability that a current winner’s WTP is greater that z is given as;
5 Ebay has what is called a ‘buy-it-now’ price, and Ubid suggest a ‘maximum bid price.’
xi z m Wi
fi(Wi)
16
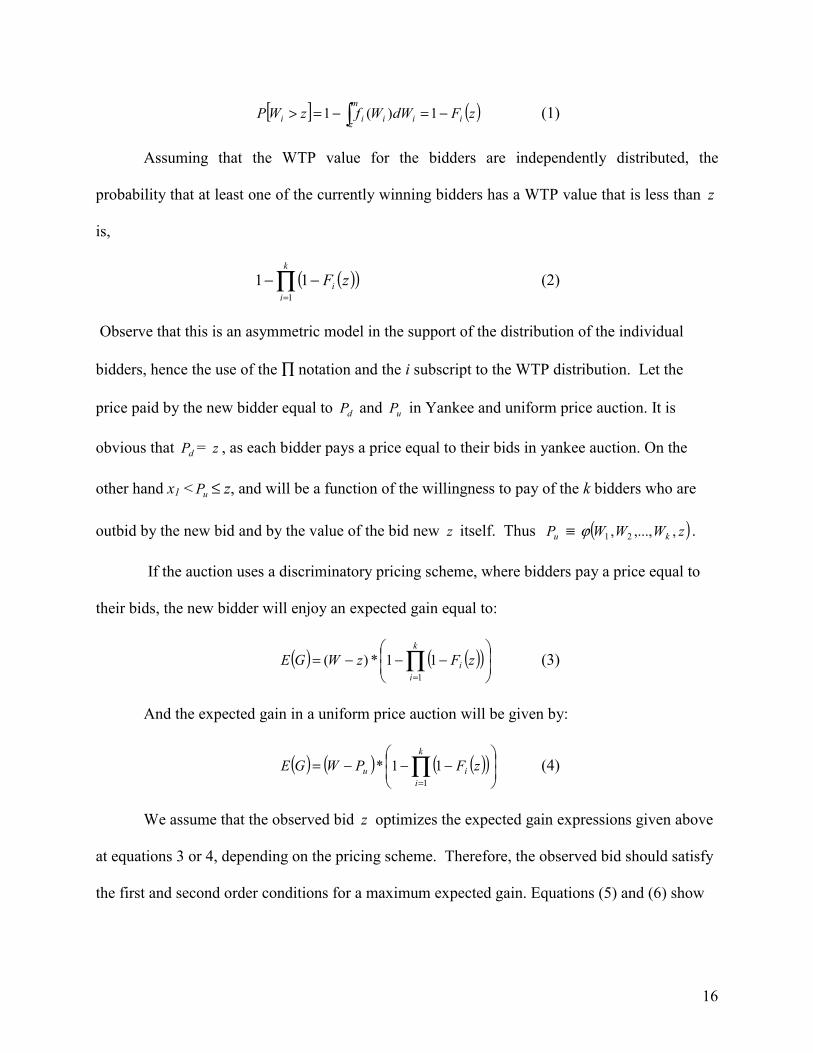
[ ] ( )zFdWWfzWP im
z iiii −=−=> ∫ 1)(1 (1)
Assuming that the WTP value for the bidders are independently distributed, the
probability that at least one of the currently winning bidders has a WTP value that is less than z
is,
( )( )∏=
−−k
ii zF
1
11 (2)
Observe that this is an asymmetric model in the support of the distribution of the individual
bidders, hence the use of the ∏ notation and the i subscript to the WTP distribution. Let the
price paid by the new bidder equal to dP and uP in Yankee and uniform price auction. It is
obvious that dP = z , as each bidder pays a price equal to their bids in yankee auction. On the
other hand x1 < uP ≤ z, and will be a function of the willingness to pay of the k bidders who are
outbid by the new bid and by the value of the bid new z itself. Thus uP ≡ ( )zWWW k ,,...,, 21ϕ .
If the auction uses a discriminatory pricing scheme, where bidders pay a price equal to
their bids, the new bidder will enjoy an expected gain equal to:
( ) ( )( )
−−−= ∏
=
k
ii zFzWGE
1
11*)( (3)
And the expected gain in a uniform price auction will be given by:
( ) ( ) ( )( )
−−−= ∏
=
k
iiu zFPWGE
1
11* (4)
We assume that the observed bid z optimizes the expected gain expressions given above
at equations 3 or 4, depending on the pricing scheme. Therefore, the observed bid should satisfy
the first and second order conditions for a maximum expected gain. Equations (5) and (6) show

17
the first order conditions for maximum expected gain under a Yankee and uniform pricing
scheme respectively.
( )( ) ( )( ) ( ) ( ) ( )( ){ }
01111 11
=
−−+
−−−=
∂∂ ∑ ∏∏
= −==
K
j
k
jiij
k
ii zFzfzWzF
zGE (5)
( )( ) ( )( ) ( ) ( ) ( )( ){ }
01111 11
' =
−−+
−−−=
∂∂ ∑ ∏∏
= −==
K
j
k
jiiju
k
iiu zFzfPWzFP
zGE (6)
Where ( )z
zWWWz
PP ku
u ∂∂
=∂
∂=
,,...,, 21' ϕ
After observing the bid z, and assuming that it was determined by the bidder to maximize
his expected gain, we can make inferences about the corresponding WTP value of the new
bidder. By solving equations 5 and 6 for W, we get the predicted WTP value of the bidder under
the respective pricing scheme. The expressions for WTP value prediction are given in equations
7 and 8.
( )( )
( ) ( )( ){ }
−
−−
+=
∑ ∏
∏
= −=
=
K
j
k
jiij
k
ii
Yankee
zFzf
zF
zW
1 1
1^
1
11
(7)
( )( )
( ) ( )( ){ }
−
−−
+=
∑ ∏
∏
= −=
=
K
j
k
jiij
k
iiu
uUniform
zFzf
zFP
PW
1 1
1
'
^
1
11
(8)
In the next subsection we present the prediction model assuming a Triangular distribution
of bidders WTP values. This distribution closely resembles the belief function of Figure 1, and is
analytically tractable.

18
4. 1 Distribution Specific WTP Prediction Model
For expositional clarity, we first present our prediction model for an auction with N=2
items on sale. Subsequently, we generalize the model for any N. Let the current winning bids be
1x and 2x with 21 xx ≤ and their corresponding WTP values of 1W and 2W respectively. Recall,
that the actual distribution of the bidder’s WTP is bounded above by m , a known fixed price for
the item being auctioned. Bidders’ WTP values are assumed to be independent and following a
triangular distribution, with support in the range ],[ 1 mx . It follows with certainty that the actual
WTP is greater or equal to the bid submitted. It is also realistic to expect that the chance of the
actual WTP value being greater than any point between the distribution support range, decreases
as the point of reference increases.
For the 2 unit case, Appendix 1 exhaustively enumerates the feasible auction outcomes as
a consequence of the third bid submission, as well as the likelihood of each outcome. Consider
the case, where 2xz > . Since 12 xx > , by the transitivity axiom of real numbers, it follows that
1xz > . Under this scenario Appendix 1 (under the case 2xz > ) lists the six possible price
outcome, along with their respective likelihood, derived from the Triangular distribution.
Aggregating the feasible outcomes and their likelihood, the new bidder can expect to pay a price
equal to 2x with probability ( )( )
−−− 2
1
221
xmxm or pay ( )
22 zx + with probability ( ) ( )
( ) ( )( )
−−−−−
21
22
442
xmxmzmxm . The
expected gain for the bidder would thus be as shown in equation 9.
( ) ( ) ( )( )
( ) ( ) ( )( ) ( )( )
−−−−−
+−+
−−−−= 2
12
2
4422
21
22
1 21
xmxmzmxmzxV
xmxmxWGE (9)
A bid that maximizes the expected surplus should satisfy the expression given in equation
10.
19
( )( ) ( ) ( )( ) ( )( )
( ) ( )( ) ( )( ) 04
221
21
22
32
21
22
442 =
−−−
+−+
−−−−−
−=∂
∂xmxm
zmzxW
xmxmzmxm
zGE (10)
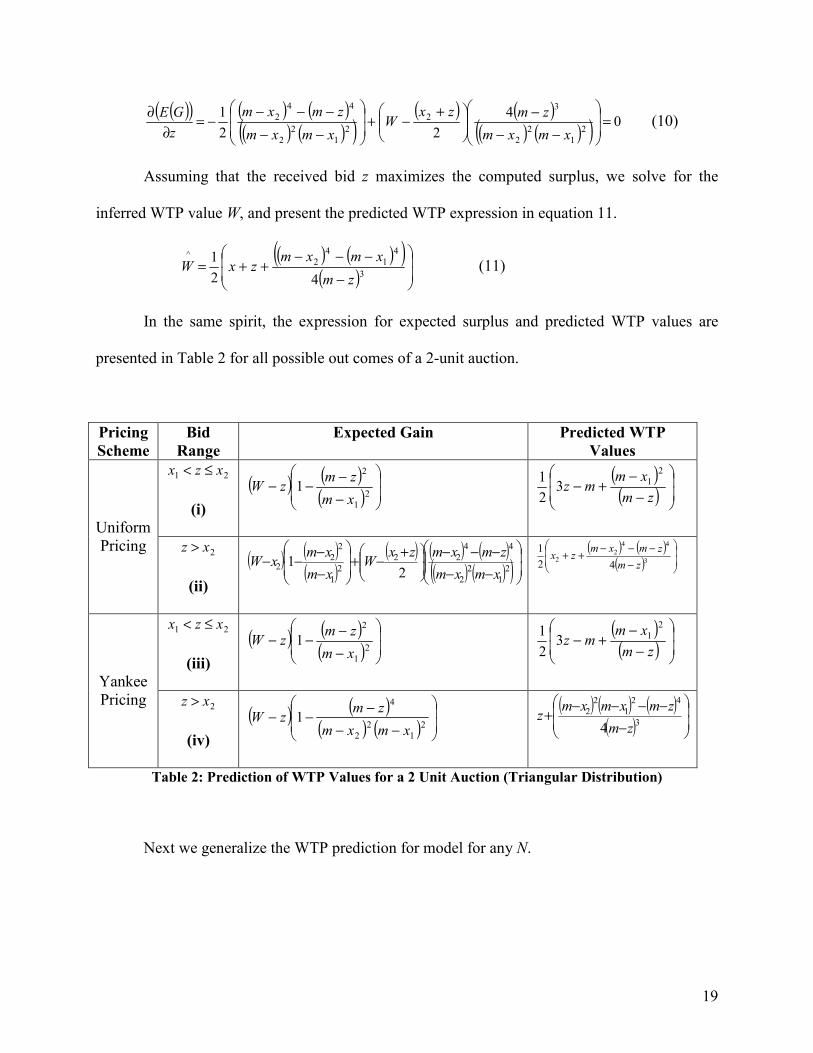
Assuming that the received bid z maximizes the computed surplus, we solve for the
inferred WTP value W, and present the predicted WTP expression in equation 11.
( ) ( )( )( )
−−−−
++= 3
41
42
^
421
zmxmxm
zxW (11)
In the same spirit, the expression for expected surplus and predicted WTP values are
presented in Table 2 for all possible out comes of a 2-unit auction.
Pricing Scheme
Bid Range
Expected Gain Predicted WTP Values
21 xzx ≤<
(i) ( ) ( )
( )
−−−− 2
1
2
1xmzmzW ( )
( )
−−
+−zm
xmmz
213
21
Uniform Pricing 2xz >
(ii) ( ) ( )
( )( ) ( ) ( )
( ) ( )( )
−−−−−
+−+
−−−− 2
12
2
4422
21
22
2 21
xmxmzmxmzxW
xmxmxW
( ) ( )( )
−−−−
++ 3
442
2 421
zmzmxmzx
21 xzx ≤<
(iii) ( ) ( )
( )
−−−− 2
1
2
1xmzmzW ( )
( )
−−
+−zm
xmmz
213
21
Yankee Pricing 2xz >
(iv) ( ) ( )
( ) ( )
−−−−− 2
12
2
4
1xmxm
zmzW ( ) ( ) ( )
( )
−−−−−+ 3
421
22
4 zmzmxmxmz
Table 2: Prediction of WTP Values for a 2 Unit Auction (Triangular Distribution)
Next we generalize the WTP prediction for model for any N.
20
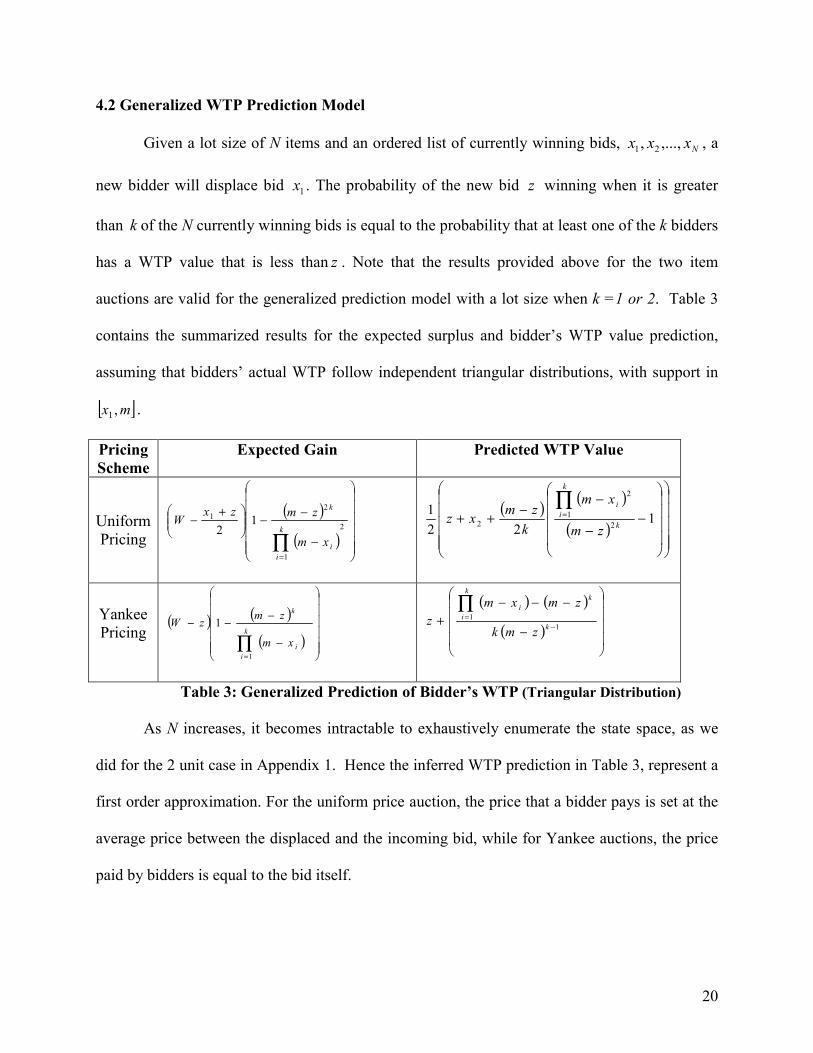
4.2 Generalized WTP Prediction Model
Given a lot size of N items and an ordered list of currently winning bids, Nxxx ,...,, 21 , a
new bidder will displace bid 1x . The probability of the new bid z winning when it is greater
than k of the N currently winning bids is equal to the probability that at least one of the k bidders
has a WTP value that is less than z . Note that the results provided above for the two item
auctions are valid for the generalized prediction model with a lot size when k =1 or 2. Table 3
contains the summarized results for the expected surplus and bidder’s WTP value prediction,
assuming that bidders’ actual WTP follow independent triangular distributions, with support in
[ ]mx ,1 .
Pricing Scheme
Expected Gain Predicted WTP Value
Uniform Pricing
( )( )
−
−−
+−
∏=
2
1
21 1
2 k
ii
k
xm
zmzxW ( ) ( )
( )
−−
−−++
∏= 1
221
21
2
2 k
k
ii
zm
xm
kzmxz
Yankee Pricing
( ) ( )( )
−
−−−
∏=
k
ii
k
xm
zmzW
1
1 ( ) ( )
( )
−
−−−+ −
=∏
11
k
k
i
ki
zmk
zmxmz
Table 3: Generalized Prediction of Bidder’s WTP (Triangular Distribution)
As N increases, it becomes intractable to exhaustively enumerate the state space, as we
did for the 2 unit case in Appendix 1. Hence the inferred WTP prediction in Table 3, represent a
first order approximation. For the uniform price auction, the price that a bidder pays is set at the
average price between the displaced and the incoming bid, while for Yankee auctions, the price
paid by bidders is equal to the bid itself.
21
For the prediction model to be of practical use, we need to test the robustness of our
assumption regarding the usage MBR bidding strategy.
5. Bidding Strategy Classification
To evaluate the accuracy of our WTP prediction model, we used micro-level bid data
from real online auctions. We begin by explaining the details of the dataset.
5.1 Online Auction Data Collection
Our analysis uses data from two multi-unit online auctions6, for which we were able to
deploy automatic auction-tracking agents to observe and collect data on entire auction
proceedings. One auction site uses a uniform price auction mechanism, while the other uses a
Yankee auction mechanism. Our automated agent was able to collect bidding data from 787
uniform price auctions and 205 Yankee auctions, recording in a database a total of 78,014 bids or
bid revisions. The auction-tracking agent was programmed to visit the identified online auction’s
web pages in intervals of 5-15 minutes, take snapshots of the auction, and record the bidding
history of the auction site. The auction-tracking agent then compared the newly downloaded
auction history with previously recorded history. If differences in the history files were observed,
the new activity of the auction was added to the history file. With this technique, we were able to
maintain a complete history of the auction, noting the bids submitted and revisions made by each
bidder in the auctions we tracked. Appendix 3 provides a list of auction variables that our
tracking agent collected data on.
After completing the data collection exercise, we investigated the data for completeness.
This required streaming the bidder arrival process through an auction programmed that replicated 6 Samsclub.com and UBid.com

22
the online auction, and making sure that the auction concluded with the same winners as the
actual action. Some of the auctions had significant chunks of missing data, in which case the
simulated auctions did not converge to the same equilibria as the actual auctions. In such cases,
we opted to drop them from our data set.
In addition to investigating the data, we pre-processed the data to compute values for the
parameters needed in the WTP model. For example, for each bidding instance, we computed the
number of bids that were lower than the new bid. This is one of the input parameters into the
WTP prediction models. In addition, to facilitate the computation of the WTP prediction
accuracy, we recorded the final bids of each bidder. This value was used as an indicator of the
bidders actual WTP, and was compared to the predicted WTP to measure our models accuracy.
A major assumption of our WTP prediction model is that bidders are practicing a MBR
strategy when bidding in these auctions. In practice, and as observed in past research, the
strategies adopted by bidders in multi-unit online auctions are varied. Our WTP methods are thus
applicable for a sub- class of bidders who use a MBR strategy.
5.2 Logit Model for Classifying Myopic Best Response Bidders
The model for bidder WTP prediction presented in section 3 above assumes a single
bidding strategy – the MBR strategy. Bapna et.al (2001), indicate that there are potentially
several categories of bidding strategies in discriminatory online multi-unit auctions. It is likely
that similar categories exist in uniform price multi-unit auctions. However, no research has
explicitly analyzed this. Table 4 reviews the bidder classification by Bapna et al (2001), and
relates it to the effect of predicting bidder WTP based on the MBR assumption.

23
Bidder Type Characteristics Predicted WTP
Evaluators Early one time high bidders; clear idea on their willingness to pay; bids higher than minimum required
Over prediction; actual bid equal to WTP
Participators Makes low initial bid, progressively monitor auction and make revisions
Initially under prediction; accuracy increase with revisions.
Opportunists Place minimum required bid just before auction closes
Accurate prediction of WTP
Table 4: Bidder Categories and Predicted WTP
From the classification presented above, our model can be applied to the class of bidders
who exhibit the participatory and opportunistic bidding behavior. The constitution of bids in
these two classes of bidders is the same, based on the straightforward bidding approach, and
differing only in the auction joining times. However, applying the model to the evaluators would
yield erroneous results, as the bid of an evaluator is equal to the actual willingness to pay of that
particular bidder. It is therefore necessary to identify evaluators and isolate them before applying
the WTP prediction model.
We developed a logistic regression model to classify bidding instances where bidders
applied a MBR strategy in the constitution of bids. A key consideration in developing the model
was that it should rely on information that is available to the auctioneer, in real time, when a
bidding instance occurs. This consideration will guarantee that the auctioneer will have all the
requisite data to classify a bidder’s strategy and subsequently predict his WTP.
5.2.1 Dependent Variable: At each bidding instance our prediction model estimates the
consumer’s willingness to pay for a product. By definition, the final bid made by bidder adopting
a MBR strategy represents a conservative estimate of their actual willingness to pay. So if our
predicted WTP at a particular bidding instance is no more that 10% greater than the final bid of a
specific bidder, we assume that the bid that led to the prediction was constituted using a MBR
24
strategy. The above operationalization would be sufficient if bidders themselves did not revise
their willingness to pay as the auction progresses. To accommodate revisions in willingness to
pay, we further classify as MBR, bidders whose predicted WTP value lies below 110 % of the
final bid value. This classification scheme yields a value for the dependent variable, which is the
strategy classification. It is important to note that it does not really matter whether bidders
explicitly carry out such an optimization. Under a broader umbrella, such behavior could be
viewed simply as being rational. Another way of looking at this is that it indicates that the
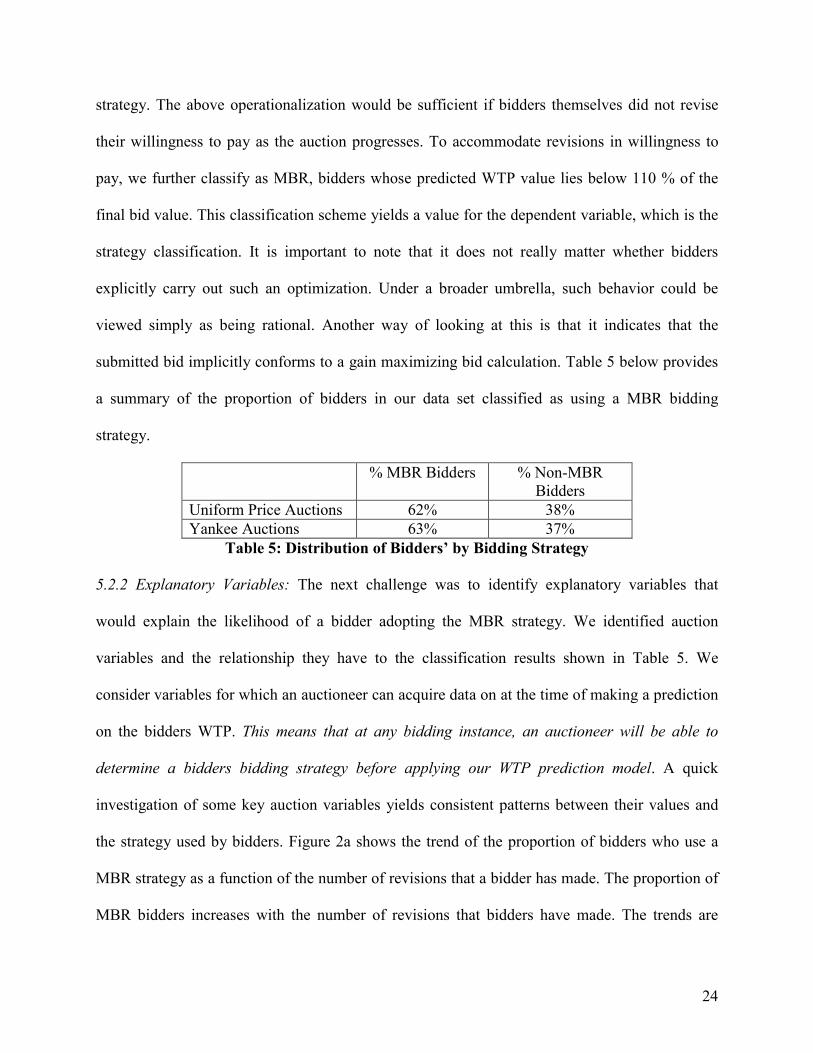
submitted bid implicitly conforms to a gain maximizing bid calculation. Table 5 below provides
a summary of the proportion of bidders in our data set classified as using a MBR bidding
strategy.
% MBR Bidders % Non-MBR Bidders
Uniform Price Auctions 62% 38% Yankee Auctions 63% 37%
Table 5: Distribution of Bidders’ by Bidding Strategy
5.2.2 Explanatory Variables: The next challenge was to identify explanatory variables that
would explain the likelihood of a bidder adopting the MBR strategy. We identified auction
variables and the relationship they have to the classification results shown in Table 5. We
consider variables for which an auctioneer can acquire data on at the time of making a prediction
on the bidders WTP. This means that at any bidding instance, an auctioneer will be able to
determine a bidders bidding strategy before applying our WTP prediction model. A quick
investigation of some key auction variables yields consistent patterns between their values and
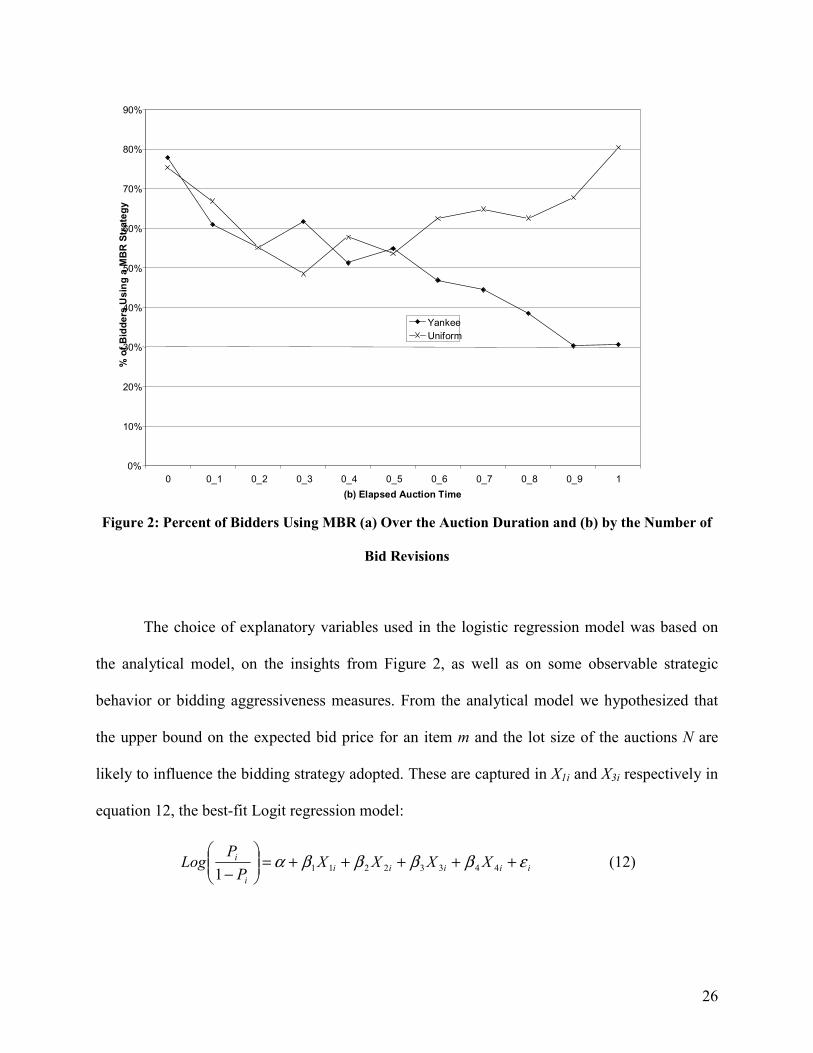
the strategy used by bidders. Figure 2a shows the trend of the proportion of bidders who use a
MBR strategy as a function of the number of revisions that a bidder has made. The proportion of
MBR bidders increases with the number of revisions that bidders have made. The trends are

25
similar in Yankee auctions and uniform price auctions. Figure 2b reveals the proportion of
bidders using the MBR strategy as the auction progresses. The trend generally declines over the
auction duration for the Yankee auction. That is, the proportion of bidders using a MBR strategy
declines as the auction progresses. On the other hand, the uniform price auctions exhibit a
decline in the proportion of MBR bidders for the first half part of the auction, after which the
proportion of bidders using a MBR strategy starts to increase.
0%
20%
40%
60%
80%
100%
120%
1 2 3 4 >4 (a) Number of Bid Revisions
YankeeUniform
% o
f bid
ders
usi
ng a
MB
R S
trat
egy
26
Figure 2: Percent of Bidders Using MBR (a) Over the Auction Duration and (b) by the Number of
Bid Revisions
The choice of explanatory variables used in the logistic regression model was based on
the analytical model, on the insights from Figure 2, as well as on some observable strategic
behavior or bidding aggressiveness measures. From the analytical model we hypothesized that
the upper bound on the expected bid price for an item m and the lot size of the auctions N are
likely to influence the bidding strategy adopted. These are captured in X1i and X3i respectively in
equation 12, the best-fit Logit regression model:
iiiiii
i XXXXP
PLog εββββα +++++=
− 443322111
(12)
0% 10% 20% 30% 40% 50% 60% 70% 80% 90%
0 0_1 0_2 0_3 0_4 0_5 0_6 0_7 0_8 0_9 1(b) Elapsed Auction Time
% o
f Bid
ders
Usi
ng a
MB
R S
trat
egy
YankeeUniform

27
Where:
iP - Probability that the bidder is using the MBR strategy
iX 1 - Ratio of current bid to a suggested market price
NKX i =2 - Ratio of number of current winning bids that are smaller than the current bid, to
lot size
iX 3 - Normalize elapsed auction time.
=iX 4 Number of bid revisions that the bidders has made up to the bidding instance being
considered (not the same as the ex-post total number of revisions)
X2i and X4i capture the strategic behavior of the bidders. These variables together capture
the range of strategic behavior presented in Table 4. High values of X4i would indicate that the
bidder was either a participator or an opportunist. A ratio close to 1 for X1i would suggest an
evaluatory, non MBR, type of bidder.
Using a statistical analysis software package (SPSS), we regressed the data on the model
proposed at equation 12 above. The estimates of the model coefficients and their statistical
significance are shown in Table 6a and 6b for Yankee auction and Uniform price auctions
respectively. The difference in coefficient estimates between the two data set reveals
distinctions in the way bidders bid in the two auctions, not surprising given the two contrasting
pricing rules. All the model variables are significant in explaining the predicted classification. In
Appendix 3, we present correlation matrices for the variables used in the model. The values
support independence among the predictor variables.
28
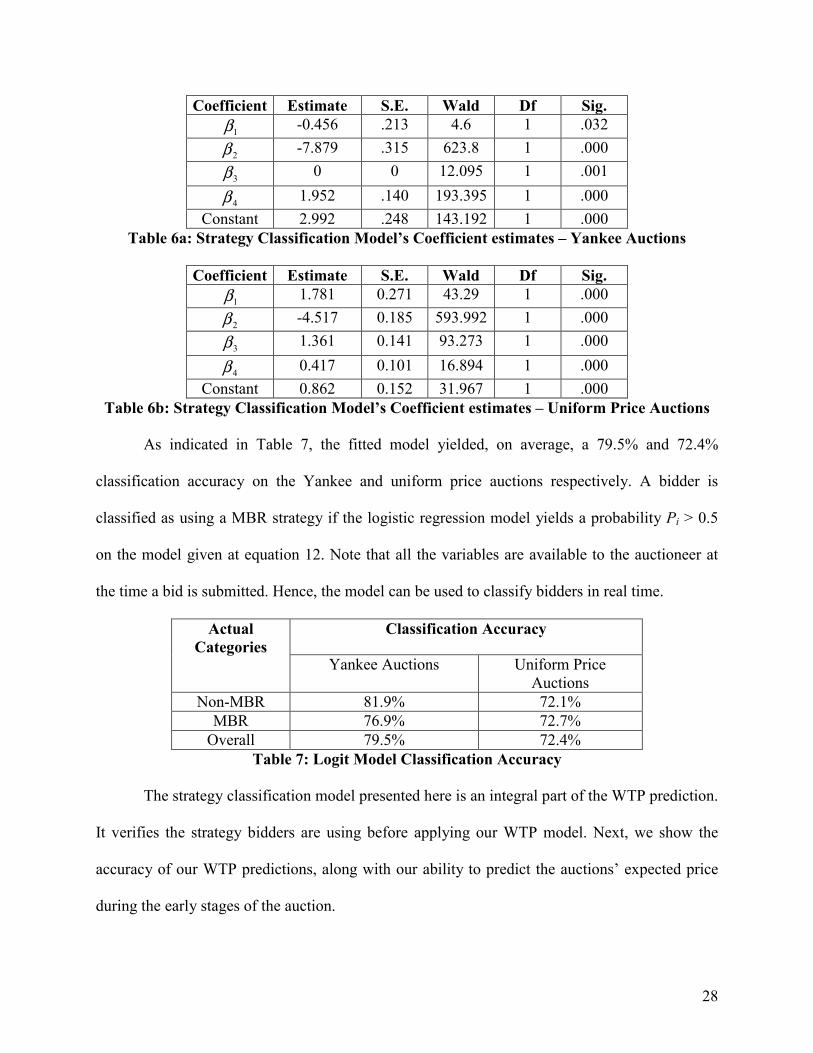
Coefficient Estimate S.E. Wald Df Sig. 1β -0.456 .213 4.6 1 .032
2β -7.879 .315 623.8 1 .000
3β 0 0 12.095 1 .001
4β 1.952 .140 193.395 1 .000 Constant 2.992 .248 143.192 1 .000
Table 6a: Strategy Classification Model’s Coefficient estimates – Yankee Auctions
Coefficient Estimate S.E. Wald Df Sig. 1β 1.781 0.271 43.29 1 .000
2β -4.517 0.185 593.992 1 .000
3β 1.361 0.141 93.273 1 .000
4β 0.417 0.101 16.894 1 .000 Constant 0.862 0.152 31.967 1 .000
Table 6b: Strategy Classification Model’s Coefficient estimates – Uniform Price Auctions
As indicated in Table 7, the fitted model yielded, on average, a 79.5% and 72.4%
classification accuracy on the Yankee and uniform price auctions respectively. A bidder is
classified as using a MBR strategy if the logistic regression model yields a probability Pi > 0.5
on the model given at equation 12. Note that all the variables are available to the auctioneer at
the time a bid is submitted. Hence, the model can be used to classify bidders in real time.
Classification Accuracy Actual Categories
Yankee Auctions Uniform Price Auctions
Non-MBR 81.9% 72.1% MBR 76.9% 72.7%
Overall 79.5% 72.4% Table 7: Logit Model Classification Accuracy
The strategy classification model presented here is an integral part of the WTP prediction.
It verifies the strategy bidders are using before applying our WTP model. Next, we show the
accuracy of our WTP predictions, along with our ability to predict the auctions’ expected price
during the early stages of the auction.

29
6. Empirical Validation Of Prediction Model
Using data collected from the online auctions as described in section 4.1, we preceded to validate
the accuracy of the predicted willingness to pay. We created a program that can replicate and
manage the stream of the bid arrival process as it occurred in the actual auction. As each bid was
recorded, we used the WTP prediction model given in Tables 3 and 4 to predict the bidders’
willingness to pay. Note, that at the time that we collected the data, Ubid.com did not feature a
suggested retail price, hence, for demonstrative purposes, we used the value of the maximum bid
in the Yankee auctions for the parameter m, that caps the support of the WTP distribution.
Alternatively, m could be computed as the average retail price from using a price comparison
agent, such as MySimon.com. We compared the predicted WTP to the actual WTP as given by
the final bid of a specific bidder. We use the bidders’ final bids as proxies for their actual WTP.
Note, that the final bid is a realistic estimate of the actual WTP for the losers of both uniform and
discriminatory multi-unit auctions, and a conservative estimate of the winners of such auctions.
6.1 Accuracy of the WTP Prediction Model
Table 8 shows the percentage difference between WTP as predicted by our model and the actual
WTP. The results show that on average, our predictions are 3 percent and 4.7 percent lower than
bidders’ actual willingness to pay in Yankee and uniform price auctions respectively. The table
also shows a 95 percent confidence interval for the observed deviation between the predicted and
actual WTP.
Yankee Auctions
Uniform Price Auctions
Average Deviation -3% -4.7% Standard Deviation 22% 13.67% 95% confidence interval on Deviation
[-5%,-1%] [-7.2%,-2.33%]
Table 8: Predictions Accuracy of Bidders’ WTP

30
In order to get further insights into the workings of our prediction model we classify our
prediction errors according to auctions’ duration as well as the number of bid revisions made by
bidders. These results are displayed in Figures 3a and 3b respectively.
-7.00%
-6.00%
-5.00%
-4.00%
-3.00%
-2.00%
-1.00%
0.00%
1.00%
2.00%
0 0.1 0.2 0.3 0.4 0.5 0.6 0.7 0.8 0.9
Elapsed Auction Time
% D
evia
tion
of P
redi
cted
val
uatio
ns fr
om a
ctua
l val
uatio
ns
UniformYankee
Figure 3a: Accuracy of the WTP model over the Auction Duration
Over the auction duration, the model for Yankee price auctions over-predicts bidders willingness
to pay in the initial part of the auction, and the prediction accuracy generally improves as the
auction proceeds. The predictions for the uniform auction are consistently below the actual
bidders’ willingness to pay and the prediction accuracy increases as the auction progresses.
Towards the latter stages of the auction, our model over predicts bidders willingness to pay for
the Yankee auctions. These patters of prediction accuracy seem consistent with the underlying

31
incentives that each auction format provides to the bidders, as well as some differences induced
by the mechanism designs.
Figure 3b reveals the patterns of the prediction accuracy of our model with the number of
bid revisions the bidders made in the auctions.
-10.00%
-8.00%
-6.00%
-4.00%
-2.00%
0.00%
2.00%
4.00%
1 2 3 4 5 6
Number of Bid Revisions
% a
vera
ge d
evia
tion
of p
redi
ctio
ns fr
om a
ctua
l val
uatio
ns
UniformYankee
Figure 3b: Accuracy of the WTP model as a function of Bid Revisions
The highest prediction accuracy for Yankee auctions is witnessed among the class of bidders
who submit between two and three bid revisions before the close of the auction, whereas the
prediction accuracy is more or less consistently just under the 5% mark, except for the 3 bid
revision case, for the uniform multi-unit auction, irrespective of the number of bid revisions.
6.2 Inference on Final Auction Revenue
Another aspect of our prediction model that we investigated was its capability to infer the
final auction revenue. We estimate such a revenue curve by considering the outcome, say from a
32
hypothetical mechanism, which induces the bidders were to offer prices that are equal to their
predicted willingness to pay. If the predictions are accurate, the auctioneer should be able to
infer the final auction revenue from the predicted willingness to pay. Such inference can be done
in the early stages of the auctions and can be used a strategic tool by the auctioneers to
dynamically adjust the mechanism’s design. These adjustments could be made through dynamic
buy-it-now prices, bid increments or lot sizes. A detailed analysis of these is beyond the scope of
this paper, but we do present our estimates of the auction’s closing price, estimated as the auction
progresses. The earlier such an estimate can be made, with accuracy, the more utility it has for
the auctioneer to use it to dynamically calibrate the mechanism. At any stage of the auction, the
revenue for the uniform and the discriminatory auctions, say Ru and RD respectively, auction can
be estimated as:
Ru = N *W(N) (13)
RD =∑=
N
iiW
1)( (14)
Where W(i) represents the ith highest estimated WTP, at that time. Figure 4 presents a
comparison of the progression of the actual auction revenue to the predicted revenue (as per
equations 13 and 14), over time.

33
-70.0%
-60.0%
-50.0%
-40.0%
-30.0%
-20.0%
-10.0%
0.0%
10.0%
20.0%
0 0.1 0.2 0.3 0.4 0.5 0.6 0.7 0.8 0.9 1
Elapsed Auction Time(a) Yankee Auctions
Ave
rage
% D
evia
tion
% Deviation of predicted revenue from final auction revenue
% deviation of runing auction revenue from final auction revenue
-100.0%
-80.0%
-60.0%
-40.0%
-20.0%
0.0%
20.0%
0 0.1 0.2 0.3 0.4 0.5 0.6 0.7 0.8 0.9 1
Elapsed Auction Time(b) Uniform Price Auctions
Ave
rage
% D
evia
tion
% Deviation of predicted auction price from final auction price
% deviation of bids from final auction price
Figure 4: Deviation of Predicted Auction Revenue from the Final auction Revenue (a)
Yankee auctions; (b) Uniform price auction

34
7. Conclusions and Future Research
This work illustrates how the enhanced information acquisition and processing
capabilities of the online environment can be used to understand the micro-level details of the
price formation process in two popular types of progressive multi-unit online auctions. Making a
minimalist myopic best response bidding assumption to ties bidders observed bids to their
underlying willingness to pay, together with a Logit classification model that can be
implemented with information available at run-time, we are able to derive tight estimates of
bidder’s willingness to pay in real time. Our estimation and strategy classification procedure,
applied to 987 online auctions with over 78,000 bids, allows us to come, on average within 3%
of revealed willingness to pay for Yankee auctions, and within 4.7% for uniform multi-unit
auctions.
Particularly interesting is the fact that there exists an opportunity to design mechanisms
that can significantly shorten the duration of such auctions. For all practical purposes, an
auctioneer using our estimation procedure can expect predicting up to 90% of the auction’s
underlying revenue by the 40th time percentile for two of the most popular types of multi-unit
online auctions. We have recently observed the multi-unit auctioneer Ubid.com to be using a
static “ubuy-it” price in parallel with Yankee bidding. Our intuition, based on the insights from
the prediction results we have presented in this paper, is that a dynamic ubuy-it price is going to
lead to a more allocatively efficient mechanism. The details of determining the dynamic buy-it-
now prices in the multi-unit setting, using the information acquisition and processing capabilities
that are at our disposal in the online auction environment, remains a promising area of future
research.

35
References:
1. Ausubel Lawrence M., “An Efficient Ascending-Bid Auction For Multiple Objects”,
Working Paper No. 97-06,(1997) University of Maryland, Department of Economics.
2. Bajari, P., Hortascu, A., “Winner’s Curse, Reserve Prices and Endogenous Entry:
Empirical Insights from eBay Auctions”, Working Paper, (2000), Department of
Economics, Stanford University.
3. Bapna, R., Goes, P., and Gupta, A. "Analysis and Design of Business-to-Consumer Online
Auctions," Management Science, 49(1), 2003a, 85-101.
4. Bapna, R., Goes, P., and Gupta, A. “Online Auctions: Insights and Analysis,”
Communications of the ACM, 44 (11), (2001), 42–50.
5. Bapna, R., Goes, P., and Gupta, A., "Replicating Online Yankee Auctions to Analyze
Auctioneers' and Bidders' Strategies," forthcoming in Information Systems Research,
2003b.
6. Biais, B., Hillion, P., and Spatt, C., “Price Discovery an Learning During the Pre-opening
Period in the Paris Bourse”, Journal of Polictical Economy, 107( 6), (1999), 1218 – 1248.
7. Carare, O., “Need for Speed: Demand Estiamtion Using Auction Data,” UT Dallas working
paper, 2003, available at http://www.utdallas.edu/~oxc023000/.
8. Crampton, P., “ Ascending Auctions”, European Economic Reciew, 42, (1998), 3-5.
9. Dekel, E., Fudenberg, D., and Levine, D.K, “Learning to Play Bayesian Games” –
Working Paper (2001).
10. Engelbrecht-Wiggans, R., and Kahn, C.M., “Multi-Unit Auctions With Uniform Prices”,
Economic Theory, 12 , (1998), 227-258.
11. Engelbrecht-Wiggans, R., “ An example of Multi-Unit Auctions with atypical Many
Equilibria”, Economic Letters, 65, (1999), 67-69
12. Engelbrecht-Wiggans R., List, J., and Lucking-Reiley, D. “Demand Reduction in Multi-
unit Auctions with Varying Numbers of Bidders: Theory and Field Experiments” (1999).
13. Laffont, J. J., Ossard, H., and Vuong, Q., “Econometrics of First-Price Auctions,”
Econometrica , 63 ( 4). , (1995), 953-980.
36
14. Menezes, M. F., “Multi-unit English auctions” , European Journal of Political Economy,
12, (1996), 671- 684.
15. McAfee, R. P., and McMillan, J., "Auctions and Bidding," Journal of Economic Literature,
25, (1987), 699-738.
16. Milgrom, P., “Auctions and Bidding: A Primer," Journal of Economic Perspectives, 3
(1989), 3-22.
17. Milgorm P. R. and Weber, R. J. , “A Theory of Auctions and Competitive Bidding,”
Econometrica, 50 (5), (1982), 1089 – 1122.
18. Nautz and Wolfstetter, Bid Shading and Risk Aversion in Multi-unit Auctions with Many
Bidders, Economics Letters, 56, (1997), 195-200
19. Parkes, D.C., and Ungar, L. H., “ Preventing Strategic Manipulation in Iterative Auctions:
Proxy Agents and Price-Adjustment”, Proceedings of the 17th National Conference on
Artificial Intelligence, (2000), 82-89.
20. Paarsch, H. J., Deciding Between Common Values and Private Vale Paradigms in
Empirical Models of Auctions, Journal of Econometrics, (1992), 51, 191 –215.
21. Rothkopf, M. H., and Harstad, R. M., “Modeling Competitive Bidding: A Critical Essay,”
Management Science, 40 (3), (1994), 364-384

37
(Appendices are to be treated as online supplements)
Appendix 1.: Exhaustive Summary of Feasible Auction Outcomes
When 21 xzx << Price Probability
Uniform Yankee
zWzW >< 21 , z z
( )( )
−−− 2
1
2
1*1xmzm
When 2xz > Price
Case Uniform Yankee Probability
zWxxW <<< 2221 , 2x z ( )
( )( )( )
−−
−
−−− 2
1
22
22
2
11xmxm
xmzm
zWxzwx <<<< 2211 ,
( )2
2 zx + z ( )
( )( ) ( )
( )
−−−−
−−− 2
1
222
22
2
1xm
zmxmxmzm
zWxzW <<> 221 , ( )2
2 zx + z ( )
( )( )( )
−−
−−− 2
1
2
22
2
1xmzm
xmzm
zWxW >< 221 , 2x z ( )
( )( )( )
−−
−
−−
21
22
22
2
1xmxm
xmzm
zWzWx ><< 212 , ( )2
1 zx + z ( )
( )( ) ( )
( )
−−−−
−−
21
222
22
2
xmzmxm
xmzm
zWzW >> 21 , W W ( )
( ) ( )21
22
4
xmxmzm
−−−

38
Appendix 2. Online Auction Data Variables Monitored by Tracking Agent:
Variables Description Auction variables Lot Number Product Description Current Bid Bid Increment Number of Bids Quantity Opening Bid Retail Price Open Date Close Date Auction Type
A unique ID that identifies each auction Product description details The current minimum winning bid level Auction’s pre-set bid increment Number of bidders who have already submitted bids. Number of items being sold Pre-set minimum starting bid Displayed retail price The time the auction begun Pricing method (Yankee or Uniform)
Bidder variables Member ID Bid Amount Quantity Won Bid Date Status
A unique ID that identifies each bidder The amount a bidder tendered The quantity bid for The quantity allocated to the bidder The time the bid was submitted Winning or losing status.

39
Appendix 3: Corrleation data A: Yankee Auctions Dataset
X1 X2 X3 X4 X1 1 X2 -0.146 1 X3 -0.277 -0.13 1 X4 -0.929 -0.106 0.248 1
B: Uniform Price Auctions Dataset
X1 X2 X3 X4 X1 1 X2 -0.394 1 X3 -0.368 -0.13 1 X4 -0.052 -0.082 0.222 1
Variables:
X1- Ratio of current bid to a suggested market price
X2- Ratio of number of current winning bids that are smaller than the current bid, to lot size
X3- Normalize elapsed auction time.
X4 - Number of bid revisions.