1 ppi inclusive growth, infra & construction v3
TRANSCRIPT

1
Inclusive Growth, Infrastructure and the
Role of the Construction Industry
Philippine Institute for Development StudiesSurian sa mga Pag-aaral Pangkaunlaran ng Pilipinas
www.pids.gov.ph
Adoracion M. NavarroSenior Research Fellow
Pandi, Bulacan28 April 2016
Philippine Press Institute’s Seminar-Workshop on Sustainable Construction Reporting
2
OUTLINE• Macroeconomic trends and poverty alleviation
• Suggested analytical frameworks
• State of physical infrastructure • Role and contribution of the construction
industry

3
Macroeconomic trends and poverty alleviation

4
Macroeconomic trends
1999 2000 2001 2002 2003 2004 2005 2006 2007 2008 2009 2010 2011 2012 2013 2014 2015 0.0%1.0%2.0%3.0%4.0%5.0%6.0%7.0%8.0%9.0%
3.1%
4.4%
2.9%3.6%
5.0%
6.7%
4.8%5.2%
6.6%
4.2%
1.1%
7.6%
3.6%
6.8% 6.9%6.1% 5.8%
GDP Growth Rate
GDP Growth, at constant 2000 prices
Source: Philippine Statistics Authority
5
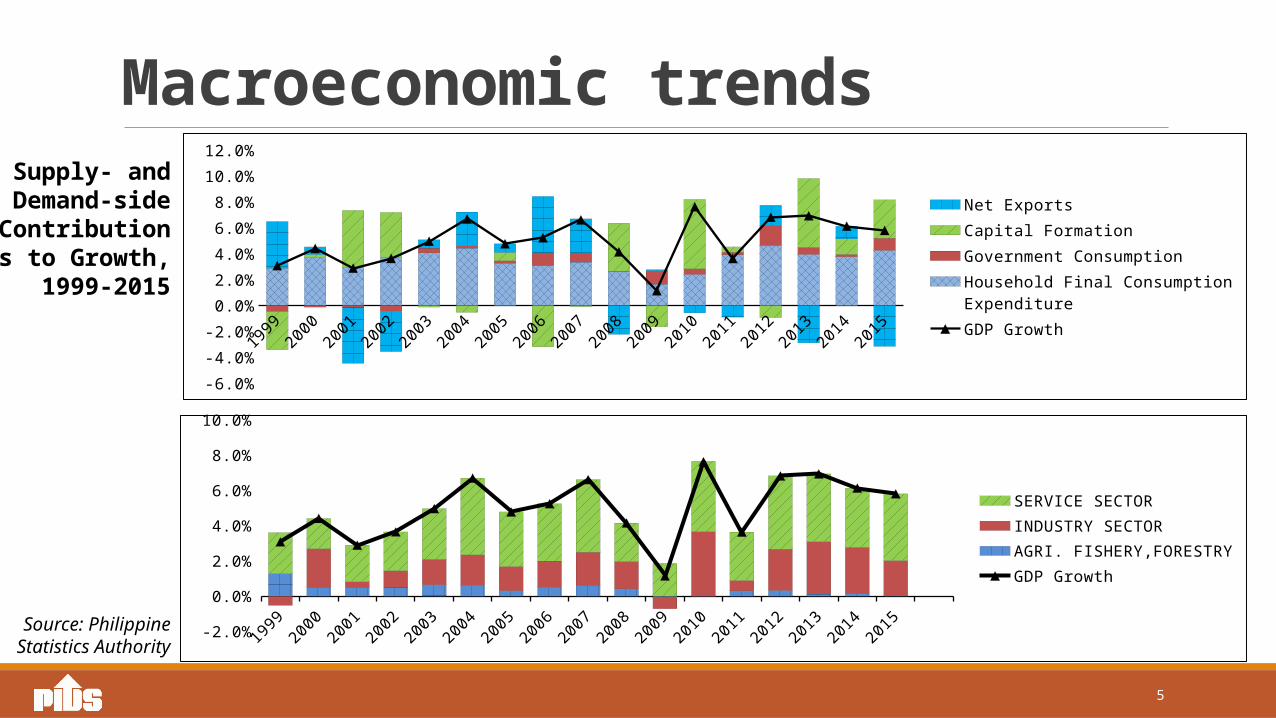
Macroeconomic trends
1999 2000 2001 2002 2003 2004 2005 2006 2007 2008 2009 2010 2011 2012 2013 2014 2015
-6.0%
-4.0%
-2.0%
0.0%
2.0%
4.0%
6.0%
8.0%
10.0%
12.0%
Net ExportsCapital FormationGovernment ConsumptionHousehold Final Consumption ExpenditureGDP Growth
1999 2000 2001 2002 2003 2004 2005 2006 2007 2008 2009 2010 2011 2012 2013 2014 2015-2.0%
0.0%
2.0%
4.0%
6.0%
8.0%
10.0%
SERVICE SECTORINDUSTRY SECTORAGRI. FISHERY,FORESTRYGDP Growth
Supply- and Demand-side
Contributions to Growth,
1999-2015
Source: Philippine Statistics Authority

6
Poverty alleviation• Poverty incidence among
Filipinos has been declining since 2008
From an estimate of 28.8 percent in first sem 2006, it went down to 26.3 in first sem 2015
• The same trend can be observed with regards to the poverty incidence among families
From 23.4 percent in first sem 2006, it went down to 21.1 percent in first sem 2015
2006 2009 2012 20150.0
5.0
10.0
15.0
20.0
25.0
30.0
35.0
23.4 22.9 22.3 21.1
28.8 28.6 27.9 26.3
Poverty Incidence among Families (%)Poverty Incidence among Population (%)
Poverty Incidence among Families and Population: first semesters of 2006, 2009, 2012 and 2015
Source: Philippine Statistics Authority

7
Poverty alleviation
NCRRegion IV-A
Region IIIRegion IIRegion I
Region XICAR
Region IV-BRegion VI
Region VIIRegion IXRegion VRegion X
CaragaRegion XII
Region VIIIARMM
0.0 10.0 20.0 30.0 40.0 50.0 60.04.5
10.413.0
16.517.2
20.520.6
22.024.2
27.030.930.9
34.935.3
37.439.3
53.4
First Semester Poverty Incidence among Families (%)
NCRRegion IV-A
Region IIIRegion IIRegion I
CARRegion XI
Region IV-BRegion VIIRegion VIRegion VRegion IXRegion X
CaragaRegion XII
Region VIIIARMM
0.0 10.0 20.0 30.0 40.0 50.0 60.0 70.06.5
13.415.8
21.521.7
26.726.7
29.830.530.5
39.039.0
40.943.944.5
47.359.0
First Semester Poverty Incidence among Population (%)
First Semester Poverty Incidence among Families and Population, Per Region: 2015
Source: Philippine Statistics Authority

8
Income inequality is the bigger challenge
2009 20121st Decile 2.9% 3.0%2nd Decile 3.9% 3.9%3rd Decile 4.6% 4.6%4th Decile 5.5% 5.4%5th Decile 6.5% 6.5%6th Decile 7.8% 7.8%7th Decile 9.8% 9.5%8th Decile 12.2% 12.1%9th Decile 16.2% 16.3%
10th Decile 30.5% 30.8%
2000 2003 2006 2009 201220
25
30
35
40
45
50
55
60
46.1744.04 44.2 42.91 43.04
Gini-Coefficient
Inequality in the Philippines: 2000, 2003, 2006, 2009 and 2012
Source: World Bank
Per Capita Income Decile, % Distribution
Sour
ce: P
hilip
pine
Sta
tistic
s Aut
horit
y
• Gini coefficient has decreased (inequality declined) from 46.17% in 2000 to 43.04% in 2012. Minimal movement from 2009 to 2012.
• With respect to income distribution, the richest decile earns approximately 10 times more than the poorest decile. The same trend can be seen in 2009.
9
Suggested analytical frameworks

10
What Adam Smith saidAn Inquiry into the Nature and Causes of the Wealth of Nations (1776):
“Good roads, canals, and navigable rivers, by diminishing the expense of carriage, put the remote parts of the country more nearly upon a level with those in the neighborhood of the town. They are upon that account the greatest of all improvements. They encourage the cultivation of the remote, which must always be the most extensive circle of the country… Though they introduce some rival commodities into the old market, they open many new markets to its produce.”

11
Physical infrastructure promotes inclusive growth
• enables connectivity and increases opportunity for engaging in economic activities
• stimulates mobility of production inputs like labor, financial capital, machineries, and equipment
• speeds up the delivery of social services to remote areas.
Source: http://goo.gl/DTtm0c

12
Infrastructure and urbanization• Infrastructure also facilitates the
process of urbanization Urbanization is a process characterized by
the spatial concentration of production activities as well as clustering and sorting in other human activities (Scott and Storper, 2014)
Infrastructure allows smooth interaction of the production space and the social space.
Urban development plans should have strong focus on the need to facilitate the circulation of people within and between the production spaces and social spaces
Production Space
Circulation Space
Social Space
production space where work and employment are
concentrated
circulation space as represented by infrastructures and arterial connections
social space as manifested in
residential neighborhoods
Urban land nexus

13
State of physical infrastructure

14
Roads• Road Network
Location and Road ClassificationLength (km)
Paved Unpaved Total
Metro ManilaArterial 88 - 88Secondary 943 - 943Total 1,032 - 1,032
PhilippinesArterial 12,747 2,812 15,559Secondary 8,259 5,551 13,810Total 21,006 8,363 29,370
Good, 34.0%
Fair, 31.5%
Poor, 17.1%Bad, 9.3%
No As-sessment,
8.1%
Location and Road Classification
National Road Condition, 2014
Source: DPWH, Stakeholder Relations Office
Source: DPWH Atlas, 2014

15
Mass Rail Transport & Bus Rapid Transit
Planned systems:• LRT 1 extension to Bacoor, Cavite• LRT 6, which will extend LRT 1 Bacoor
terminus to Dasmariñas• LRT 2 extension to Port Area, Manila• LRT 2 extension to Masinag, Antipolo• LRT 4, which will connect EDSA-Ortigas to
Taytay, Rizal• MRT 7, which will link North EDSA to San
Jose del Monte, Bulacan• new rail lines to be built over the existing
PNR routes, Tutuban-Malolos and Tutuban-Calamba
• BRT• Cebu BRT• Metro Manila BRT via Quezon Ave• EDSA BRT
Figure 2. Philippine Rail Network Source: DOTC

16
Airports• National Airport System
• No of Airports with Commercial Flight Operations = 42• No of Airports without Commercial Flight Operations = 43
• Runway Congestion• Maximum aircraft movement per hour is 40, but can spike up to 48 per hour in peak hours• Congestion leads to cascading delays; PAL estimates losses of Php 84,000 per 30-min delay
Philippine Airports, by Classification
Source: Civil Aviation Authority of the Philippines
CLASSIFICATION CAAP Authorities PPP Total
International 7 3 1 11
Principal Class 1 14 - - 14
Principal Class 2 18 - 1 19Community 40 1 - 41Total 79 4 2 85

17
Ports• National Port System
Type No. of PortsBaseports 26Terminal Ports 82Satellite and RORO Ports 103
Source: Philippine Ports Authority
Shipcalls 2012 2013 2014
Domestic 335,272 345,945 347,841
Foreign 10,598 10,572 9,639
Total 345,870 356,517 357,480
Source: Philippine Ports Authority Sour
ce: P
hilip
pine
Por
ts A
utho
rity
No. of Ports, by Type
Domestic and Foreign Shipcalls, 2012-2014
Figu
re 3
. Map
of P
hilip
pine
Por
ts

18
Infra Quality across ASEAN
Myanmar
Cambodia
Philippines
Vietnam
Lao PDR
Indonesia
Thailand
Malaysia
Singapore
0 1 2 3 4 5 6 7
2.3
3.3
3.3
3.3
3.6
3.7
4.4
5.7
6.2
Myanmar
Cambodia
Philippines
Lao PDR
Vietnam
Indonesia
Thailand
Malaysia
Singapore
0 1 2 3 4 5 6 7 8
2.6
3.7
3.7
3.8
4.2
4.4
5.1
5.7
6.8
Quality of Roads, across ASEAN Quality of Air Transport Infra, across ASEAN
Source: The Global Competitiveness Report 2015–2016, World Economic ForumNote: Values are on a 1-to-7 scale. A total of 14 economies were surveyed.

19
Infra Quality across ASEANQuality of Railroad Infra, across ASEANQuality of Port Infra, across ASEAN
Source: The Global Competitiveness Report 2015–2016, World Economic ForumNote: Values are on a 1-to-7 scale. A total of 140 economies were surveyed.
Cambodia
Myanmar
Philippines
Thailand
Vietnam
Indonesia
Malaysia
Singapore
0 1 2 3 4 5 6
1.6
1.8
2.2
2.4
3.2
3.6
5.1
5.7
Lao PDR
Myanmar
Philippines
Cambodia
Indonesia
Vietnam
Thailand
Malaysia
Singapore
0 1 2 3 4 5 6 7 8
2.2
2.6
3.2
3.7
3.8
3.9
4.5
5.6
6.7

20
ICT Indicators across ASEAN
Myanmar
Lao PDR
Philippines
Indonesia
Thailand
Vietnam
Malaysia
Cambodia
Singapore
0 20 40 60 80 100 120 140 160 180
49.5
67.0
111.2
126.2
144.4
147.1
148.8
155.1
158.1
Myanmar
Cambodia
Philippines
Vietnam
Thailand
Indonesia
Lao PDR
Malaysia
Singapore
0 5 10 15 20 25 30 35 40
1.0
2.8
3.1
6.0
8.5
11.7
13.4
14.6
35.5
Source: The Global Competitiveness Report 2015–2016, World Economic Forum
Mobile Subscriptions/100 pop., across ASEAN Fixed-Telephone Lines/100 pop., across ASEAN

21
ICT Indicators across ASEAN
2000 2001 2002 2003 2004 2005 2006 2007 2008 2009 2010 2011 2012 2013 20140.00
10.00
20.00
30.00
40.00
50.00
60.00
70.00
80.00
90.00
BRU, 68.77
CMB, 9.00
IND, 17.14LAO, 14.26
MAL, 67.50
MYA, 2.10
PHI, 39.69
SIN, 82.00
THA, 34.89
VIE, 48.31
Philippines
Myanmar
Indonesia
Laos
Malaysia
Brunei
Cambodia
Vietnam
Thailand
Singapore
0 20 40 60 80 100 120 140
3.64
6.54
6.68
6.92
7.03
7.99
9.04
17.7
19.82
122.43
Percentage of Internet Users, 2000-2014 Household Speed Index (in Mbps)
Source: International Telecommunications Union, 2015 Sour
ce: O
okla
, May
201
5
22
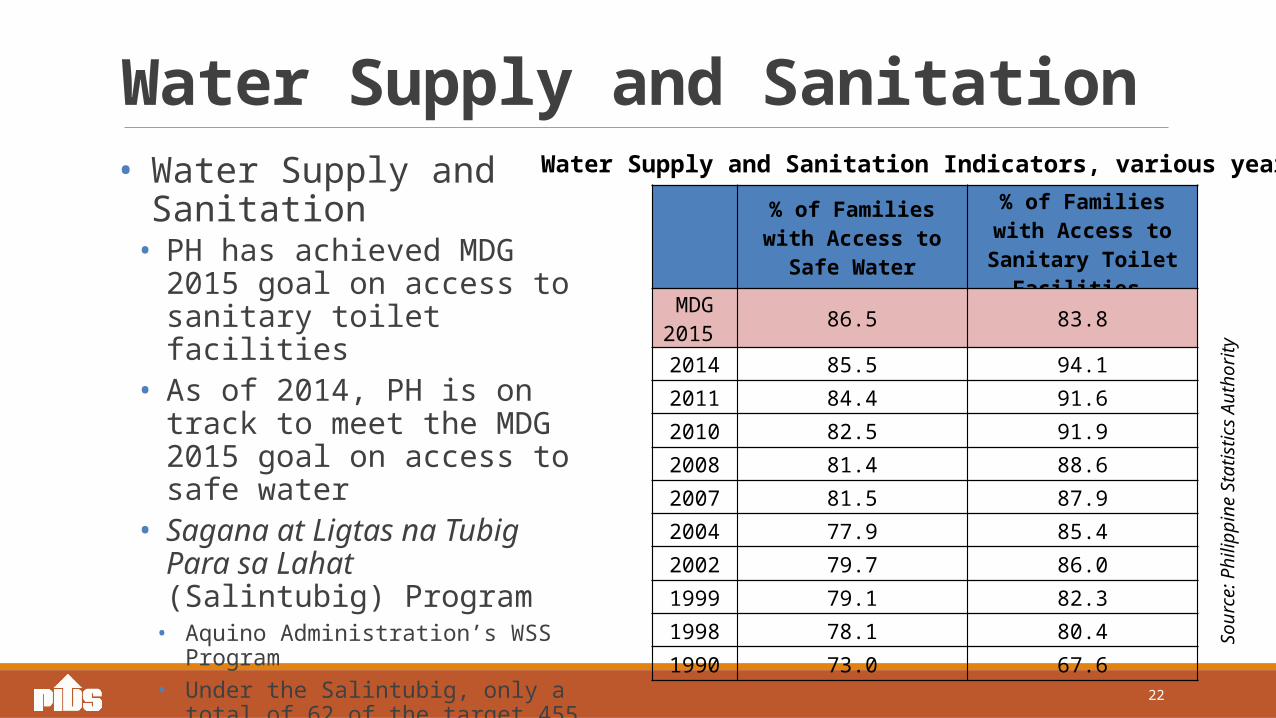
Water Supply and SanitationWater Supply and Sanitation Indicators, various years
Sour
ce: P
hilip
pine
Sta
tistic
s Aut
horit
y
% of Families with Access to Safe Water
% of Families with Access to Sanitary Toilet
Facilities
MDG 2015 86.5 83.8
2014 85.5 94.12011 84.4 91.62010 82.5 91.92008 81.4 88.62007 81.5 87.92004 77.9 85.42002 79.7 86.01999 79.1 82.31998 78.1 80.41990 73.0 67.6
• Water Supply and Sanitation• PH has achieved MDG 2015 goal
on access to sanitary toilet facilities
• As of 2014, PH is on track to meet the MDG 2015 goal on access to safe water
• Sagana at Ligtas na Tubig Para sa Lahat (Salintubig) Program
• Aquino Administration’s WSS Program• Under the Salintubig, only a total of 62 of
the target 455 municipalities have reportedly graduated as of June 2015.

23
Energy• Generation Mix
Source: DOE Database of Power Plants as of September 2015.
Dependable Capacity Installed Capacity

24
Energy• In a USAID study prepared by CATIF, electricity prices in the Philippines
are not competitive compared to selected ASEAN countries.
PHL SGP INA MAL THAPer kWh
Residential 0.3608 0.2523 0.1156 0.1302 0.2484Commercial 0.3727 0.2523 0.2447 0.2353 0.2869Low voltage Industrial 0.3021 0.2432 0.1999 0.2082 0.2765High voltage Industrial 0.2995 0.2183 0.1769 0.1894 0.2557
Conversion Factors for Local Currency UnitsUS dollars, average in 2011 43.31 1.26 8,770.43 3.06 30.49PPP$, 2011 24.79 1.03 6,565.87 1.9 17.42
Cross-peso, average in 2011 34.4567 0 14.1716 1.4219
Comparison of 2011 Electricity Tariffs after Adjusting for Price Differences (in 2011 PPP dollars)
Sour
ce: C
ATIF,
201
3

25
Energy• Based on the 2015-2016
World Economic Forum – Global Competitiveness Report, the Philippines ranks 89th among 140 countries in terms of quality of electricity.
• Philippines - among the bottom three in terms of quality of electricity supply
Source: WEF Global Competitiveness Report 2015-2016Note: Values are on a 1-to-7 scale, with 7 being the highest rating. Survey includes 140 countries. Brunei Darussalam is not included.
Quality of Electricity Supply, across ASEAN Countries
Myanmar
Cambodia
Philippines
Indonesia
Vietnam
Lao PDR
Thailand
Malaysia
Singapore
0.0 1.0 2.0 3.0 4.0 5.0 6.0 7.0
2.7
3.1
4.0
4.1
4.1
4.7
5.2
5.8
6.7

26
Role and contribution of the construction industry

27
Share of construction in GDP• On the production
side, largest sectoral share is from the Service Sector (57%), followed by the Industry Sector.
• In the Industry Sector, manufacturing is 23% of GDP, while the construction industry is 6% of GDP.
AGRI.FISHERY,FORESTRY, 9%
SERVICE SECTOR, 57%
Manufacturing, 23%
Construction, 6%Elec., Gas and Water
3% Mining & Quarrying, 1%
Share of GDP by Industrial Origin, 2015
Source: Philippine Statistics Authority, 2015

28
Capital Formation and Construction• On the expenditure side,
23% of the GDP can be attributed to Capital Formation. Since 2012, the share of Capital Formation in GDP has been increasing
• In 2015, capital formation increased by 13.6% compared to the 5.4% growth it registered in 2014
• Among the components of Capital Formation, construction remains second in terms of percentage share (9.3%) in 2015, next to Durable Equipment (11.9%)
1998 1999 2000 2001 2002 2003 2004 2005 2006 2007 2008 2009 2010 2011 2012 2013 2014 2015 0.0%
5.0%
10.0%
15.0%
20.0%
25.0%
30.0%
23.5%
9.3%
11.9%
1.3%0.7%
Total Capital Formation ConstructionDurable Equipment Breeding Stock & Orchard Dev'tIntellectual Property Products
Capital Formation and its Sub-sectors, as Percent of GDP
Source: Philippine Statistics Authority

29
Public and Private Construction
1999 2000 2001 2002 2003 2004 2005 2006 2007 2008 2009 2010 2011 2012 2013 2014 20150
100,000
200,000
300,000
400,000
500,000
600,000
700,000
800,000
-15.0%
-10.0%
-5.0%
0.0%
5.0%
10.0%
15.0%
20.0%
-10.6%
8.5%
-6.2%
-0.6%
3.6%
-0.7% -2.1%
7.7%
11.3%
4.2%
1.6%
17.5%
-8.4%
17.6%
11.0%
10.9%
8.4%
PUBLIC PRIVATETotal Construction (Growth Rates)
Value and Growth Rates of Private and Public Construction, 1999-2015
Source: Philippine Statistics Authority
• In terms of real values (at constant 2000 prices), total construction value has been increasing since 2011. However, the growth rates has been steadily decreasing. In 2015, construction has been down to 8.4% growth, from 10.9% the previous year.
• Private contribution to construction has been growing faster than public contribution. In 2015, growth rate of the private sector has been 4.3%, while the public sector’s contribution is only 4.1%.
2010 2011 2012 2013 2014 2015
Public (Growth
Rate)1.4% -11.6% 3.6% 3.5% 1.3% 4.1%
Private (Growth
Rate)16.1% 3.2% 14.0% 7.5% 9.6% 4.3%
Growth Rates of Public & Private Construction, 2010-2015
Source: Philippine Statistics Authority

30
Public and Private Construction
• The increase in the value of construction as percent of GDP is primarily driven by the private sector.
• Since 2011, the share of total value of construction as percent of GDP has been increasing. In 2011, it was 7.6%, and is not at 9.3% in 2015.
• The 9.3% share of GDP in 2015 is the highest in the last 15 years.
• The private sector has the larger share with 7.2% of the GDP in 2015, while public only has 2.1%.
• This has been the highest share of the private sector as percent of GDP since 1998.
• As for the public sector’s share, 2.1% is the highest since 2011.
1998 1999 2000 2001 2002 2003 2004 2005 2006 2007 2008 2009 2010 2011 2012 2013 2014 20150.0%
2.0%
4.0%
6.0%
8.0%
10.0%
12.0%
3.6%2.9% 3.1% 2.9% 2.4% 2.2% 1.8% 1.8%
2.4% 2.3% 2.2% 2.6% 2.5%1.5% 1.6% 1.8% 1.8% 2.1%
7.2%
6.5% 6.7%6.0%
6.2% 6.2%6.0% 5.5%
5.1% 5.5% 5.6% 5.3%6.1%
6.1%6.7% 6.9% 7.3% 7.2%
10.9%
9.4%9.8%
8.9%8.6% 8.4%
7.9%7.3% 7.5%
7.8% 7.8% 7.9%
8.6%
7.6%
8.4%8.7%
9.1% 9.3%
PUBLIC (as % of GDP) PRIVATE (as % of GDP)GROSS VALUE IN CONSTRUCTION (as % of GDP)
Construction Growth Rates and Private vs Public Value in Construction, 1999-2015

31
Philippine Institute for Development Studies
Surian sa mga Pag-aaral Pangkaunlaran ng Pilipinas
Service through policy research
WEBSITE: www.pids.gov.ph
FACEBOOK: facebook.com/PIDS.PH
TWITTER: twitter.com/PIDS_PH
Thank you!