1 performance of the polish economy in the days of global economic turbulence „ mapping the...
TRANSCRIPT

1
Performance of the Polish economy
in the days of global economic turbulence
„Mapping the previous 20 years and the next 20 years”
Jan Krzysztof Bielecki,Chairman of the Economic Council to
the Polish PM Donald Tusk
Tel Aviv, December, 2010

2
Map of the presentation
„All about maps”:
-Map of European growth in crisis year of 2009
-Panoramic map (20 years) of how we got there
-Map of the CEE – why you should think countries, not „the region”
-Map of what remains to be done
-How The Economist sees the changes on the map of Europe in the next 5 years

Polish economy is growing even during the time of crisis – in very tough 2009…
Real GDP growth rate
in Europe 2009
(y-o-y change)
EU: - 4,2
Euro area: - 4,1
Source: European Commission
FRA- 2,2
ESP- 3,6
PRT-2,7
IRL- 7,1
GBR- 4,9
BEL- 3,1
NLD - 4,0 DEU
- 5,0LUX - 3,4
CHE- 1,5
ITA- 5,0
NOR- 1,5
SWE- 4,9
DNK- 4,9
FIN- 7,8
EST - 14,1
LVA - 18,0
LTU - 15,0
POL 1,7
CZE - 4,2 SVK -4,7
AUT - 3,6
SVN- 7,8
HUN - 6,3 ROU - 7,1
BGR - 5,0
GRC- 2,0
CYP - 1,7
5

4
PANORAMIC MAP OF HOW WE GOT THERE

5
Poland was the first transition country to exceed its 1989 GDP level
Source: EBRD, Pekao Research
Real GDP (1989=100)
0
20
40
60
80
100
120
140
160
180
200
1989
1991
1993
1995
1997
1999
2001
2003
2005
2007
Bulgaria
Estonia
Hungary
Latvia
Lithuania
Poland
Romania
Russia
SlovakRep

6
Following two years of painful reforms, back on the growth track
Source: EBRD Transition Report 2008

7
Key transition indicators suggest Poland scores very close to „best pupils in its class”
Source: EBRD Transition Report 2008* Latvia,Estonia and Croatia were considered more advanced in banking reform...
*

8
Dynamic increase of foreign trade is one of the key drivers of investments and growth
Source: Statistical Office, Pekao Research
0
20
40
60
80
100
120
140
160
1990 1995 2000 2005 2009
Exports Imports
Foreign trade turnover (current prices, bn USD)

9
MAP OF THE CEE – WHY YOU SHOULD THINK BY COUNTRIES AND NOT BY „THE REGION”

10
The crisis was an „acid test” for the growth model of CEE countries…

11
These countries that expanded their budgets too much (often with credit booms) - suffered

12
Poland is less dependent from external conditions than other countries in the region
Source: World Bank

13
Polish banking sector lent mostly in local currency – smaller FX risk
Source: World Bank
14
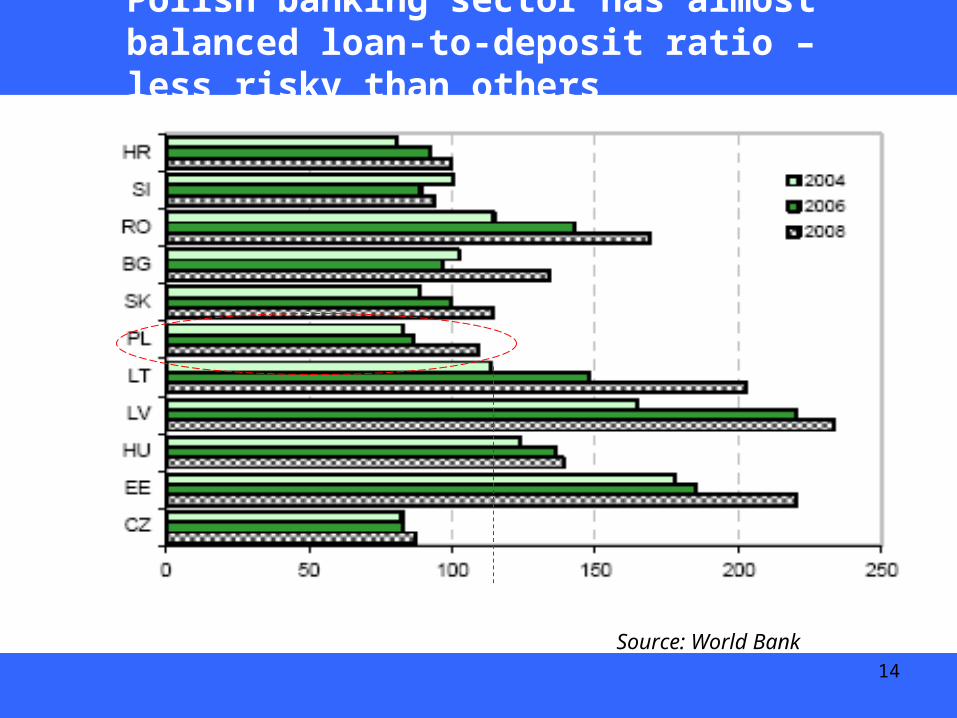
Polish banking sector has almost balanced loan-to-deposit ratio – less risky than others
Source: World Bank

15
MAP OF WHAT REMAINS TO BE DONE

16
Key challenges for the government - deficits
General government fiscal balance, % of GDP
Source: World Bank

17
Key challenges for the government - debt
General government public debt, % of GDP
Source: World Bank

18
However, indebtedness remains one of the lower ones compared to other EU countries…
Source: World Bank
Debt to GDP ratio
EURO AREA
UE
UK
Sweden
Spain
Slovenia Slovakia (without OPF)
Romania
Portugal
Poland (without OPF)
NL
Malta
Luxembourg
Lithuania
Latvia
Italy
Ireland
Hungary
Greece
Germany
FranceFinnland
Estonia
DennmarkCzech Republic
Cyprus
BulgariaBelgium
Austria
0
2
4
6
8
10
12
14
0 20 40 60 80 100 120 1402010 level (%)
Incr
ease
bet
wee
n 20
10 a
nd 2
009
(in p
p)
19
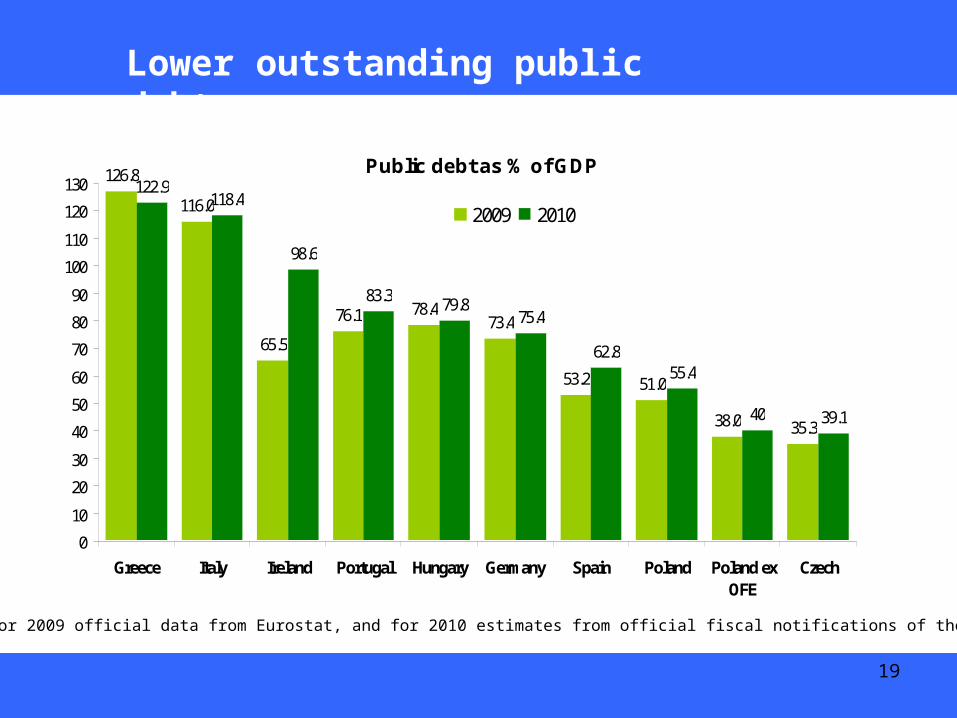
Lower outstanding public debt……
Public debt as % of GDP126.8
116.0
65.5
76.1 78.473.4
53.2 51.0
38.0 35.3
122.9118.4
98.6
83.3 79.875.4
62.855.4
40 39.1
0
10
20
30
40
50
60
70
80
90
100
110
120
130
Greece Italy Ireland Portugal Hungary Germany Spain Poland Poland exOFE
Czech
2009 2010
Source: for 2009 official data from Eurostat, and for 2010 estimates from official fiscal notifications of the countries

20
……is reflected in lower credit risk
CDS rates
0100200300400500600700800900
10001100
Oct
08
Nov
08De
c 08
Jan
09Fe
b 09
Mar
09
Apr 0
9M
ay 0
9Ju
n 09
Jul 0
9Au
g 09
Sep
09O
ct 0
9No
v 09
Dec
09Ja
n 10
Feb
10M
ar 1
0Ap
r 10
May
10
Jun
10Ju
l 10
Jul 1
0Au
g 10
Sep
10O
ct 1
0No
v 10
pts
Poland Czech Rep. Hungary GreeceSpain Portugal Ireland Italy
Note: CDS rates reflect cost of protection against default of debt issuer

21
yield % spread bp yield % spread bp yield % spread bp
Greece 12.59 1087 11.46 976 10.30 881
Portugal 6.00 428 4.78 308 5.25 376
Hungary 5.75 403 4.75 305 5.25 376
Spain 5.53 381 5.33 363 5.08 359
Ireland 4.55 283 3.39 169 3.36 187
Italy 3.66 194 2.86 116 2.84 135
Poland 3.42 170 2.48 78 2.44 95
YIELD AND SPREAD TO BUNDS (5Y) AT THE END OF A MONTH
November 10 October 10 September 10
yield % spread bp yield % spread bp yield % spread bp
Greece 12.01 933 10.67 815 10.56 826
Ireland 9.42 683 7.10 445 6.64 452
Portugal 7.16 449 6.00 348 6.38 408
Hungary 6.22 354 5.75 323 5.70 339
Spain 5.58 290 4.21 169 4.14 183
Poland 4.81 213 3.93 141 3.97 166
Italy 4.69 202 3.90 138 3.87 156
YIELD AND SPREAD TO BUNDS (10Y) AT THE END OF A MONTH
November 10 October 10 September 10
Note: for every country yields (in %) and spreads to Bunds (in bps) for bonds denominated in euro
…..and cost of debt servicing

22
Key challenges for the government - summary
Ambitious privatization plans –almost 740 enterprises in the next two-three years
Extensive infrastructure building plans (motorways, energy sector), to be boosted with EU funds. Almost 1100km of motorways under construction
Challenge of maintaining fiscal discipline amid economic slowdown, ambitious infrastructure construction plans and the challenge of structural changes in economy and society

23
Key challenges according to the European Commission latest report
- curbing structural deficit
- continuing catching-up process
- securing steady competitiveness gains via continuous upgrade of the export structure
- maintaining macroeconomic stability
Source: European Commision, „Poland – leading the pack in the recovery phase”, May 2010

24
MAP OF EUROPE IN 2015 ?

25Source: „The Economist”, May 2010
Europe in 2015… by „The Economist”

26
Thank you for your attention …

27
Enclousers

28
Relatively strong performance of Polish stock market
Stock indices (end 2009=100)
70
80
90
100
110
120
130
Dec
-09
Jan-
10
Feb
-10
Mar
-10
Apr
-10
May
-10
Jun-
10
Jul-1
0
Aug
-10
Sep
-10
Oct
-10
Nov
-10
Emerging markets World Poland Czech Hungary
29
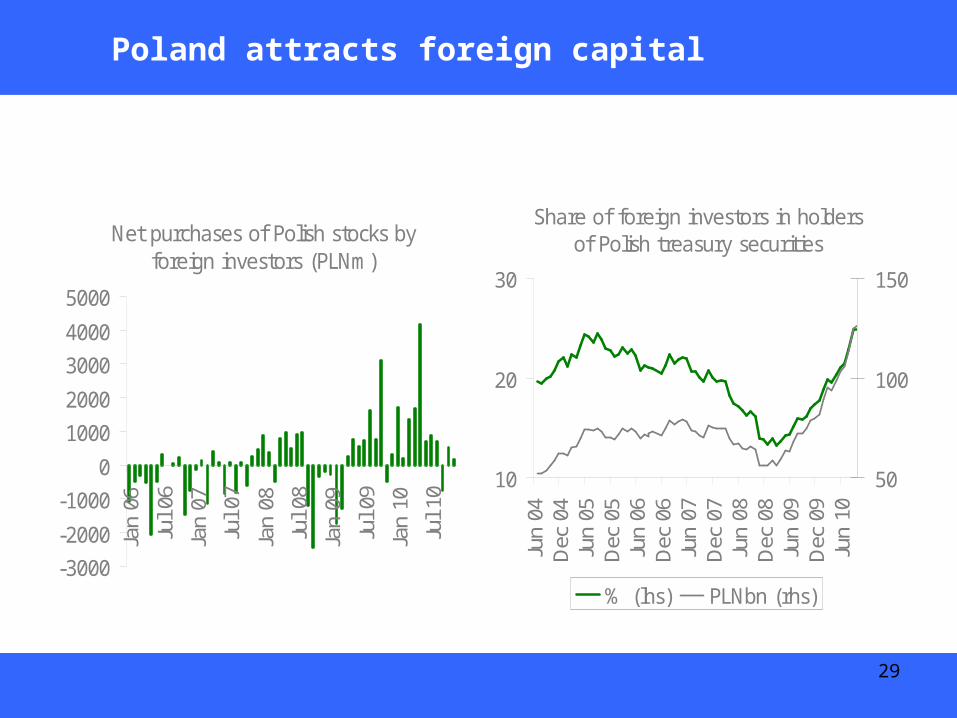
Net purchases of Polish stocks by foreign investors (PLNm)
-3000
-2000
-1000
0
1000
2000
3000
4000
5000
Jan
06
Jul 0
6
Jan
07
Jul 0
7
Jan
08
Jul 0
8
Jan
09
Jul 0
9
Jan
10
Jul 1
0
Share of foreign investors in holders of Polish treasury securities
10
20
30
Jun
04D
ec 0
4Ju
n 05
Dec
05
Jun
06D
ec 0
6Ju
n 07
Dec
07
Jun
08D
ec 0
8Ju
n 09
Dec
09
Jun
10
50
100
150
% (lhs) PLNbn (rhs)
Poland attracts foreign capital