1 of 1 02/09/2014 9:52 am - queensu.ca · kinesiology, recreation & physical education 84 16 5...
TRANSCRIPT

Home » Public Accountability » CUDO » CUDO 2010
A. General InformationAddress information1.Qualifications offered/awarded2.Degrees conferred by program3.Male enrolment by program4.Female enrolment by program5.Total enrolment by program6.Full-time enrolment by immigrationstatus
7.
B. AdmissionApplicants and registrants by type andprogram
1.
Program undergrad admissionrequirements
2.
Entering average ranges by program3.Application fee4.Students accepted for a term otherthan fall
5.
Deferred admission6.
C. Transfer Admission fromPost-Secondary Institutions
Enroll transfer students?1.Number of transfer students (appliedand registered)
2.
Transfer credit policies3.
D. Library CollectionsLibrary collections1.
E. Student LifeGeographic origin of first year students1.Students living on campus2.Activities offered3.Housing4.
F. Student Experience InformationResults from NSSE (National Surveyof Student Engagement) 2008
1.
Results from the CGPSS (CanadianGraduate Professional StudentSurvey) 2010
2.
G. Annual Student ExpensesTuition, ancillary fees, room and board,other
1.
First year tuition and ancillary fees byprogram
2.
H. Instructional Faculty and Class SizeNumber of instructional facultymembers
1.
Undergraduate class size by year level2.
I. University Revenue and ExpensesRevenue1.Expenses2.
J. ResearchResearch awards by Granting Council1.
K. Other Useful Information
Academic plans1.Key performance indicator includinggraduation rates)
2.
Retention rate 20083.
CUDO Home »
Visit the Council of Ontario Universities for similar information on other Ontario universities.
Office of Institutional Research and Planning - CUDO 2010 http://www.queensu.ca/irp/accountability/CUDO/cudo2010.html
1 of 1 02/09/2014 9:52 AM

Home » Public Accountability » CUDO » CUDO 2010 » Section A
Mailing Address99 University AvenueKingston, ON K7L 3N6Canada
Street Address99 University AvenueKingston, ON K7L 3N6Canada
Admissions InformationAdmissions ServicesGordon Hall, 74 Union StreetKingston, ON CANADATel: 613-533-2218Fax: 613-533-6810Email: [email protected]
Main Phone Number (Switchboard)613-533-2000 Internet Addresswww.queensu.ca
Program
Bachelors &1st Professional Degree
Master's Degree
Doctoral Degree
Agricultural & Biological Science 605 40 15Business & Commerce 278 403 6Computer Science 49 23 14Education 712 39 5Engineering 530 102 57Fine & Applied Arts 161 16 3Humanities 358 109 17
Home| Print ReportNext»
Section A1 - Address information
Section A2 - Qualifications Offered/Awarded in Calendar Year 2009
Degree/Diploma/Certificate # AwardedUndergraduate certificate 54Undergraduate diploma 39Bachelor's degree 3,1591st professional degree* 887Graduate certificate 0Graduate diploma 0Master's degree 1,235Doctoral degree 188Total 5,562Note: Includes all degrees/diplomas/certificates that are offered/awarded.
*1st professional degree refers to second-entry programs and includes Law, Medicine, Dentistry, Optometry, VeterinaryMedicine, Theology, Consecutive Education
Source: Institutional submissions to MTCU on degrees awarded
Section A3 - Degrees Conferred by Program, 2009
Number of degrees conferred in the calendar year 2009 (includes affiliates)
Office of Institutional Research and Planning - Section A http://www.queensu.ca/irp/accountability/CUDO/cudo2010/sectionA.html
1 of 4 02/09/2014 9:53 AM
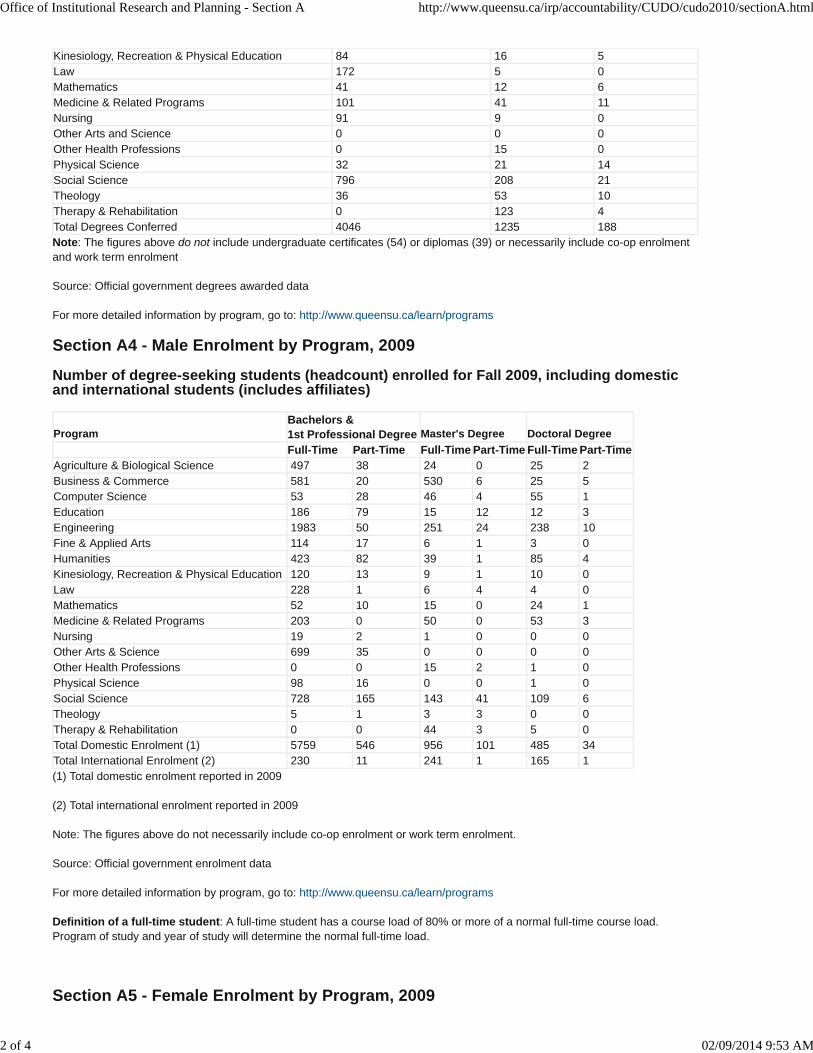
Kinesiology, Recreation & Physical Education 84 16 5Law 172 5 0Mathematics 41 12 6Medicine & Related Programs 101 41 11Nursing 91 9 0Other Arts and Science 0 0 0Other Health Professions 0 15 0Physical Science 32 21 14Social Science 796 208 21Theology 36 53 10Therapy & Rehabilitation 0 123 4Total Degrees Conferred 4046 1235 188Note: The figures above do not include undergraduate certificates (54) or diplomas (39) or necessarily include co-op enrolmentand work term enrolment
Source: Official government degrees awarded data
For more detailed information by program, go to: http://www.queensu.ca/learn/programs
Section A4 - Male Enrolment by Program, 2009
Number of degree-seeking students (headcount) enrolled for Fall 2009, including domesticand international students (includes affiliates)
Program
Bachelors &1st Professional Degree
Master's Degree
Doctoral Degree
Full-Time Part-Time Full-Time Part-Time Full-Time Part-TimeAgriculture & Biological Science 497 38 24 0 25 2Business & Commerce 581 20 530 6 25 5Computer Science 53 28 46 4 55 1Education 186 79 15 12 12 3Engineering 1983 50 251 24 238 10Fine & Applied Arts 114 17 6 1 3 0Humanities 423 82 39 1 85 4Kinesiology, Recreation & Physical Education 120 13 9 1 10 0Law 228 1 6 4 4 0Mathematics 52 10 15 0 24 1Medicine & Related Programs 203 0 50 0 53 3Nursing 19 2 1 0 0 0Other Arts & Science 699 35 0 0 0 0Other Health Professions 0 0 15 2 1 0Physical Science 98 16 0 0 1 0Social Science 728 165 143 41 109 6Theology 5 1 3 3 0 0Therapy & Rehabilitation 0 0 44 3 5 0Total Domestic Enrolment (1) 5759 546 956 101 485 34Total International Enrolment (2) 230 11 241 1 165 1(1) Total domestic enrolment reported in 2009
(2) Total international enrolment reported in 2009
Note: The figures above do not necessarily include co-op enrolment or work term enrolment.
Source: Official government enrolment data
For more detailed information by program, go to: http://www.queensu.ca/learn/programs
Definition of a full-time student: A full-time student has a course load of 80% or more of a normal full-time course load.Program of study and year of study will determine the normal full-time load.
Section A5 - Female Enrolment by Program, 2009
Office of Institutional Research and Planning - Section A http://www.queensu.ca/irp/accountability/CUDO/cudo2010/sectionA.html
2 of 4 02/09/2014 9:53 AM

Number of degree-seeking students (headcount) enrolled for Fall 2009, including domesticand international students (includes affiliates)
Program
Bachelors &1st Professional Degree
Master's Degree
Doctoral Degree
Full-Time Part-Time Full-Time Part-Time Full-Time Part-TimeAgriculture & Biological Science 847 65 41 0 23 1Business & Commerce 588 22 206 5 27 4Computer Science 29 6 8 1 13 0Education 668 419 39 32 38 3Engineering 660 10 99 4 61 6Fine & Applied Arts 419 46 42 3 26 1Humanities 852 133 61 5 94 0Kinesiology, Recreation & Physical Education 262 8 30 5 12 0Law 250 2 3 3 1 0Mathematics 73 8 5 2 6 1Medicine & Related Programs 199 0 74 2 59 0Nursing 328 29 28 5 10 0Other Arts & Science 1577 29 0 0 0 0Other Health Professions 0 0 30 9 10 0Physical Science 51 12 1 1 0 0Social Science 1491 203 213 58 116 13Theology 3 8 4 7 0 0Therapy & Rehabilitation 0 0 258 5 16 4Total Domestic Enrolment (1) 8078 979 1051 147 442 33Total International Enrolment (2) 219 21 91 0 70 0(1) Total domestic enrolment reported in 2009
(2) Total international enrolment reported in 2009
Note: The figures above do not necessarily include co-op enrolment or work term enrolment.
Source: Official government enrolment data
For more detailed information by program, go to http://www.queensu.ca/academics/programs
Definition of a full-time student: A full-time student has a course load of 80% or more of a normal full-time course load.Program of study and year of study will determine the normal full-time load.
Section A6 - Total Enrolment by Program, 2009
Number of degree-seeking students (headcount) enrolled for Fall 2009, including domesticand international students (includes affiliates)
Program
Bachelors &1st Professional Degree
Master's Degree
Doctoral Degree
Full-Time Part-Time Full-Time Part-Time Full-Time Part-TimeAgriculture & Biological Science 1344 103 65 0 48 3Business & Commerce 1169 42 736 11 52 9Computer Science 82 34 54 5 68 1Education 854 498 54 44 50 6Engineering 2643 60 350 28 299 16Fine & Applied Arts 533 63 48 4 29 1Humanities 1275 215 100 6 179 4Kinesiology, Recreation & Physical Education 382 21 39 6 22 0Law 478 3 9 7 5 0Mathematics 125 18 20 2 30 2Medicine & Related Programs 402 0 124 2 112 3Nursing 347 31 29 5 10 0Other Arts & Science 2276 64 0 0 0 0
Office of Institutional Research and Planning - Section A http://www.queensu.ca/irp/accountability/CUDO/cudo2010/sectionA.html
3 of 4 02/09/2014 9:53 AM

Other Health Professions 0 0 45 11 11 0Physical Science 149 28 1 1 1 0Social Science 2219 368 356 99 225 19Theology 8 9 7 10 0 0Therapy & Rehabilitation 0 0 302 8 21 4Total Domestic Enrolment (1) 13837 1525 2007 248 927 67Total International Enrolment (2) 449 32 332 1 235 1(1) Total domestic enrolment reported in 2009(2) Total international enrolment reported in 2009
Note: The figures above do not necessarily include co-op enrolment or work term enrolment.
Source: Official government enrolment data
For more detailed information by program, go to: http://www.queensu.ca/learn/programs
Definition of a full-time student: A full-time student has a course load of 80% or more of a normal full-time course load.Program of study and year of study will determine the normal full-time load.
Section A7 - Full-Time Enrolment by Immigration Status, Fall 2009
Number of degree-seeking international full-time students (headcount) enrolled for Fall 2009
Bachelor & 1st Professional Degree(includes Theology)
Canadian Enrolment: 13,837
Student Visa Enrolment: 449
Master's Degree (includes Theology)
Canadian Enrolment: 2,007
Student Visa Enrolment: 332
Doctoral Degree
Canadian Enrolment: 927
Student Visa Enrolment: 235
Note: The figures above do not necessarily include co-op enrolment or work term enrolment.
Source: Official government enrolment data
Office of Institutional Research and Planning - Section A http://www.queensu.ca/irp/accountability/CUDO/cudo2010/sectionA.html
4 of 4 02/09/2014 9:53 AM

Home » Public Accountability » CUDO » CUDO 2010 » Section B
Program
Applicants/Registrants who attended anOntario Secondary School in the previous year
All Other Applicants/Registrants(Non-Secondary School)
Total
Arts/Humanities/Social ScienceTotal applicants (first choice) 1958 641 2599Total registrants (first choice) 850 204 1054Total applications (all choices) 6539 1623 8162Total registrants (all choices) 1126 255 1381Science Total applicants (first choice) 1097 498 1595Total registrants (first choice) 459 148 607Total applications (all choices) 4968 1425 6393Total registrants (all choices) 653 210 863Commerce/Management/Business AdministrationTotal applicants (first choice) 898 486 1384Total registrants (first choice) 208 60 268Total applications (all choices) 2853 1421 4274Total registrants (all choices) 237 79 316EducationTotal applicants (first choice) 471 94 565Total registrants (first choice) 81 6 87Total applications (all choices) 1254 274 1528Total registrants (all choices) 96 9 105Physical/Health Education/RecreationTotal applicants (first choice) 90 27 117Total registrants (first choice) 33 10 43Total applications (all choices) 418 73 491Total registrants (all choices) 41 10 51Engineering and Applied ScienceTotal applicants (first choice) 663 343 1006Total registrants (first choice) 351 123 474Total applications (all choices) 2516 974 3490Total registrants (all choices) 474 175 649Fine and Applied Arts Total applicants (first choice) 53 15 68Total registrants (first choice) 11 3 14Total applicants (all choices) 258 57 315Total registrants (all choices) 16 4 20MusicTotal applicants (first choice) 52 15 67
Home| Print Report« Back| Next»
Section B1 - Applicants and Registrants by Program, 2009
Full-time, first-year applicants and registrants in first entry programs by type and program:
Office of Institutional Research and Planning - Section B http://www.queensu.ca/irp/accountability/CUDO/cudo2010/sectionB.html
1 of 4 02/09/2014 9:53 AM

Total registrants (first choice) 30 4 34Total applications (all choices) 195 53 248Total registrants (all choices) 42 7 49NursingTotal applicants (first choice) 130 64 194Total registrants (first choice) 41 13 54Total applications (all choices) 564 184 748Total registrants (all choices) 62 17 79Source: OUAC
Section B2 - Undergraduate Program Admission Requirements
For general information on university programs, including admission requirements, go to OUAC’s eINFO at www.electronicinfo.ca
For more detailed information and up-to-date policy on admission requirements: http://www.queensu.ca/admission/apply/firstyear/requirements.html
Section B3 - Secondary School Entering Grade Averages of Full-Time, First-YearStudents by Range and Program, 2010 (PRELIMINARY)
The following tables show the percentage of full-time, first year students by average range and program. Averagesare based on final grades for Grade 12 university destination courses.
Program Average %Arts Percent who received an entering average of 95% and above 4.3%Percent who received an entering average between 90% and 94% 20.4%Percent who received an entering average between 85% and 89% 36.5%Percent who received an entering average between 80% and 84% 33.4%Percent who received an entering average between 75% and 79% 5.4%Percent who received an entering average between 70% and 74% 0.1%Percent who received an entering average below 70% 0.0%Overall average 86.2%Science Percent who received an entering average of 95% and above 15.5%Percent who received an entering average between 90% and 94% 48.0%Percent who received an entering average between 85% and 89% 29.2%Percent who received an entering average between 80% and 84% 6.5%Percent who received an entering average between 75% and 79% 0.9%Percent who received an entering average between 70% and 74% 0.0%Percent who received an entering average below 70% 0.0%Overall average 90.5%Business and Commerce Percent who received an entering average of 95% and above 19.7%Percent who received an entering average between 90% and 94% 52.1%Percent who received an entering average between 85% and 89% 27.5%Percent who received an entering average between 80% and 84% 0.7%Percent who received an entering average between 75% and 79% 0.0%Percent who received an entering average between 70% and 74% 0.0%Percent who received an entering average below 70% 0.0%Overall average 91.6%Education Percent who received an entering average of 95% and above 13.8%Percent who received an entering average between 90% and 94% 67.9%Percent who received an entering average between 85% and 89% 12.8%Percent who received an entering average between 80% and 84% 4.6%Percent who received an entering average between 75% and 79% 0.9%Percent who received an entering average between 70% and 74% 0.0%Percent who received an entering average below 70% 0.0%Overall average 91.7%
Office of Institutional Research and Planning - Section B http://www.queensu.ca/irp/accountability/CUDO/cudo2010/sectionB.html
2 of 4 02/09/2014 9:53 AM

Physical Education Percent who received an entering average of 95% and above 0.0%Percent who received an entering average between 90% and 94% 17.6%Percent who received an entering average between 85% and 89% 55.9%Percent who received an entering average between 80% and 84% 26.5%Percent who received an entering average between 75% and 79% 0.0%Percent who received an entering average between 70% and 74% 0.0%Percent who received an entering average below 70% 0.0%Overall average 86.8%Engineering Percent who received an entering average of 95% or above 12.0%Percent who received an entering average between 90% and 94% 33.5%Percent who received an entering average between 85% and 89% 40.0%Percent who received an entering average between 80% and 84% 13.2%Percent who received an entering average between 75% and 79% 1.3%Percent who received an entering average between 70% and 74% 0.0%Percent who received an entering average below 70% 0.0%Overall average 89.1%Fine Arts Percent who received an entering average of 95% or above 3.2%Percent who received an entering average between 90% and 94% 29.0%Percent who received an entering average between 85% and 89% 35.5%Percent who received an entering average between 80% and 84% 29.0%Percent who received an entering average between 75% and 79% 3.2%Percent who received an entering average between 70% and 74% 0.0%Percent who received an entering average below 70% 0.0%Overall average 86.9%Music Percent who received an entering average of 95% or above 7.0%Percent who received an entering average between 90% and 94% 30.2%Percent who received an entering average between 85% and 89% 46.5%Percent who received an entering average between 80% and 84% 14.0%Percent who received an entering average between 75% and 79% 2.3%Percent who received an entering average between 70% and 74% 0.0%Percent who received an entering average below 70% 0.0%Overall average 88.0%Nursing Percent who received an entering average of 95% or above 4.3%Percent who received an entering average between 90% and 94% 33.3%Percent who received an entering average between 85% and 89% 53.6%Percent who received an entering average between 80% and 84% 8.7%Percent who received an entering average between 75% and 79% 0.0%Percent who received an entering average between 70% and 74% 0.0%Percent who received an entering average below 70% 0.0%Overall average 88.8%Overall Percent who received an entering average of 95% or above 10.0%Percent who received an entering average between 90% and 94% 34.5%Percent who received an entering average between 85% and 89% 34.3%Percent who received an entering average between 80% and 84% 18.5%Percent who received an entering average between 75% and 79% 2.7%Percent who received an entering average between 70% and 74% 0.03%Percent who received an entering average below 70% 0.0%Overall average 88.5%Source: OUAC
Sections B4 / B5 / B6
2010-11 Application fee / Students accepted for a term other than fall / DeferredAdmission
Office of Institutional Research and Planning - Section B http://www.queensu.ca/irp/accountability/CUDO/cudo2010/sectionB.html
3 of 4 02/09/2014 9:53 AM

OUAC 101 Secondary School 105 Non-secondary schoolsApplication $120 $125Application Choices $40 $40Application (if outside Canada) $130 $135Note: The "application fee" applies to the initial three university/program choices. The "additional choices" fee must be paid foreach university/program choice beyond the initial three.
Source: OUAC
Admission in Winter, Spring and Summer Terms
Are first-year students accepted for terms other than the fall? (Please not that acceptance for terms other than fall might vary byprogram.)
-Yes
Note: This applies only to Arts & Science, part-time students. See www.queensu.ca/admission/ for more details.
Source: Individual institutions
Deferred Admission
Does your institution allow students to postpone enrolment after admission? (Please note that policy on deferred admissionmight vary by program.)
-Yes
If yes, maximum period of postponement:
-One year
See www.queensu.ca/admission/ for more details.
Source: Individual institutions
Office of Institutional Research and Planning - Section B http://www.queensu.ca/irp/accountability/CUDO/cudo2010/sectionB.html
4 of 4 02/09/2014 9:53 AM

Home » Public Accountability » CUDO » CUDO 2010 » Section C
Home| Print Report« Back| Next»
Section C1 / C2 / C3Transfer Admission From Other Postsecondary Institutions Enrolment of Transfer Students
Do you enrol transfer students in first entry undergraduate programs?- yes
If yes above, may transfer students earn advanced standing credit by transferring credits earned from course work completed at othercolleges/universities?- yes
Source: Individual Institutions
Transfer Students
Number of students who applied and enrolled as degree-seeking transfer students in Fall 2009:
Applicants: 570
Registrants: 43
Note: Transfer students are those students who attended another post-secondary institution.
Source: OUAC
Transfer Credit Policies
Full-time: http://www.queensu.ca/admission/apply/upperyear/transfer-ft.html
Part-time: http://www.queensu.ca/admission/apply/upperyear/transfer-pt.html
Source: Individual Institutions
Office of Institutional Research and Planning - Section C http://www.queensu.ca/irp/accountability/CUDO/cudo2010/sectionC.html
1 of 1 02/09/2014 9:54 AM

Home » Public Accountability » CUDO » CUDO 2010 » Section D
Material Number of Holdings Monograph Volumes - Print n/a Monograph Volumes - Electronic 415,438 Microform Units 4,059,040 Government Documents (not counted elsewhere) 1,120,094 Manuscripts and Archives (linear metre) n/a Printed Music Scores n/a Cartographic Materials 159,589 Graphic Materials 28,568 Audio Materials n/a Film and Video Materials n/a Serials - Print and Microform 7,909 Serials - Electronic 53,327
Home| Print Report« Back| Next»
Section D1 - Library Collections
The number of holdings for the 2008-09 year for each of the following categories:
Note:Students entering Ontario universities today have access to a growing variety of world-class electronic informationresources that are accessible to them 24x7x365. Our libraries are leaders in transforming traditional library services by adoptinginnovative technological solutions such as ScholarsPortal, a shared gateway to scholarly resources and RACER, aprovince-wide interlibrary loan service. Through these resources and services our libraries are preparing students for today’sworld of information. Our libraries also provide a wide array of unique resources, services, and facilities. For more detailedinformation, click here: http://spotdocs.scholarsportal.info/display/sp/home
Source: Ontario Council of University Libraries (OCUL) Statistics report
Office of Institutional Research and Planning - Section D http://www.queensu.ca/irp/accountability/CUDO/cudo2010/sectionD.html
1 of 1 02/09/2014 9:54 AM

Home » Public Accountability » CUDO » CUDO 2010 » Section E
Home| Print Report« Back| Next»
Section E1 - Residence of First-Time, Full-Time, First Year Undergraduate Studentsin Previous Year
Percent from Ontario: 80.83%
Percent from rest of Canada: 13.87%
Percent from outside Canada: 5.29%
Source: OUAC
Section E2 - Percentage of Full-Time, Undergraduate Students Who Live onCampus, Fall 2009
First Year: 83.3%Total Undergraduate: 26.0%
Source: Individual institutions
Section E3 - Extracurricular Activities Offered
Alma Mater Society: http://www.myams.org/
Current Clubs (AMS): http://www.myams.org/clubs.aspx
International Centre: http://quic.queensu.ca/
Athletics and Recreation: http://www.gogaelsgo.com/
Student Affairs: http://www.queensu.ca/studentaffairs/index.html
In and Around Queen's and Kingston: http://www.queensu.ca/visit/
Section E4 - Housing
Queen's Community Housing: http://housing.queensu.ca/community_housing/
Residences: http://housing.queensu.ca/residences/
Society of Graduates and Professional Students Housing: http://www.sgps.ca/services/housing.html
Office of Institutional Research and Planning - Section E http://www.queensu.ca/irp/accountability/CUDO/cudo2010/sectionE.html
02/09/2014 9:55 AM

Home » Public Accountability » CUDO » CUDO 2010 » Section F
Home| Print Report« Back| Next»
Section F1 - Student Experience Information Results from the NSSE (National Survey of Student Engagement) 2008 Survey How would you evaluate your entire educational experience at this institution?
Excellent Good Fair PoorFirst Year 54.0% 36.0% 9.0% 1.0%Senior Year 44.0% 43.0% 10.0% 2.0% If you could start over again, would you go to the same institution you are now attending? Definitely Yes Probably Yes Probably No Definitely NoFirst Year 61.0% 29.0% 8.0% 2.0%Senior Year 51.0% 33.0% 12.0% 4.0%For more NSSE results, to the Student Surveys section.
Section F2 - Results from the CGPS (Canadian Graduate Professional Student)2010 Survey
Masters Survey
DefinitelyProbablyMaybeProbablyNot
DefinitelyNot
If you were to start your graduate/professional career again, would youselect the same university?
26.8% 34.0% 23.4% 11.7% 4.1%
Would you recommend this university to someone considering yourprogram?
35.2% 33.1% 19.7% 7.6% 4.5%
Overall, how would you rate the quality of: Excellent Very Good Good Fair Pooryour academic experience at this university? 23.5% 39.7% 20.9% 10.5% 5.4%your student life experience at this university? 23.9% 30.1% 24.3% 15.6% 6.2%your graduate/professional program at this university? 24.2% 35.7% 20.9% 14.4% 4.7%your overall experience at this university? 23.8% 31.4% 26.4% 12.3% 6.1%
Professional Masters Survey
DefinitelyProbablyMaybeProbablyNot
DefinitelyNot
Office of Institutional Research and Planning - Section F http://www.queensu.ca/irp/accountability/CUDO/cudo2010/sectionF.html
1 of 2 02/09/2014 9:57 AM

If you were to start your graduate/professional career again, would youselect the same university?
28.9% 45.9% 17.0% 5.2% 3.0%
Would you recommend this university to someone considering yourprogram?
46.7% 32.6% 14.1% 4.4% 2.2%
Overall, how would you rate the quality of: Excellent Very Good Good Fair Pooryour academic experience at this university? 21.9% 46.9% 21.1% 7.8% 2.3%your student life experience at this university? 22.7% 36.7% 24.2% 12.5% 3.9%your graduate/professional program at this university? 20.3% 44.5% 20.3% 12.5% 2.3%your overall experience at this university? 23.4% 41.4% 25.0% 7.0% 3.1%
Office of Institutional Research and Planning - Section F http://www.queensu.ca/irp/accountability/CUDO/cudo2010/sectionF.html
2 of 2 02/09/2014 9:57 AM

Home » Public Accountability » CUDO » CUDO 2010 » Section G
Expense Domestic International Tuition Fees: $5230 $18,730 Ancillary Fees: $1035 $903 Room and Board (single room on-campus): $10,563 $10,563 Room Only (west campus only, no meals): $5,737 $5,737 Board Only (on-campus, meal plan): na na Books and Supplies: $1,100 $1,100 Transportation: $500 - $1,000 $500 - $100 Other Expenses*: $1,800 - $2,700 $1,800 - $2,700
Home| Print Report« Back| Next»
Section G1 - Annual Student Expenses
First-year average undergraduate Arts & Science full-time tuition, ancillary fees, room and board, and other expenses, 2010-11.
NOTE: These expenses are for the full 2010-11 academic year, which refers to the period of time generally extending fromSeptember to June, usually equated to two semesters or three trimesters. Ancillary fees include only charges that all full-timestudents must pay that are not included in tuition (e.g., registration, health, or activity fees) and do not include optional fees (e.g.,parking, laboratory use).
*Included in other: telephone, personal expenses, clothing/laundry and recreation
Costs vary by program. For further information, go to http://www.queensu.ca/studentawards/costs.html
Source: COU and institutions
Section G2 - First-year tuition and ancillary domestic fees by program, 2010-11
Program Tuition Ancillary TotalArts and Science $5,230.00 $1,035.32 $6,265.32Business Administration, Commerce $12,127.50 $1,195.89 $13,323.39Computer Science $5,230.00 $1,050.32 $6,280,32Computer, Electrical, Software Engineering $8,874.00 $1,118.03 $9,992.03Education (excluding AQs) $5,155.00 $1.051.32 $6,206.32Engineering, Applied Science, Engineering Management $8,874.00 $1,118.03 $9,992.03Environmental Studies/Science $5,230.00 $1,035.32 $6,265.32Law $13,170.00 $1,078.37 $14,248.37Medicine $18,228.00 $1,210.39 $19,438.39Music $5,230.00 $1,035.32 $6,265.32Nursing $5,225.00 $1,078.89 $6,303.89Physical and Health Education/Kinesiology $5,230.00 $1,030.35 $6,260.35Source: Council of Ontario Universities (COU)
Office of Institutional Research and Planning - Section G http://www.queensu.ca/irp/accountability/CUDO/cudo2010/sectionG.html
1 of 1 02/09/2014 9:57 AM

Home » Public Accountability » CUDO » CUDO 2010 » Section H
Full-TimePart-TimeTotal Number of Instructional Faculty 833 -Total number who are women 290 -Total number with doctorate, first professional, or other highest leveldegree
814
Home| Print Report« Back| Next»
Section H1 - Instructional Faculty and Class Size
Number of instructional faculty members (excluding clinicians) for Fall 2009:
Source: Individual institutions
Section H2 - Undergraduate Class Size by Year Level, 2009 Class Sections First Year Second Year Third Year Fourth Year # % # % # % # %<30 students 255 53.6% 141 43.4% 258 54.1% 627 92.9%30 - 60 students 112 23.5% 60 18.5% 144 30.2% 30 4.4%61 - 100 students 49 10.3% 50 15.4% 44 9.2% 9 1.3%101 - 250 students 37 7.8% 61 18.8% 28 5.9% 9 1.3%251+ students 23 4.8% 13 4.0% 3 0.6% 0 0.0%Total 476 100.0% 325 100.0% 477 100.0% 675 100.0%
Class Sub-Sections (i.e. lab, tutorial) First Year Second Year Third Year Fourth Year # % # % # % # %<20 students 74 15.2% 70 26.4% 64 37.2% 39 54.9%20 - 40 students 300 61.7% 136 51.3% 65 37.8% 18 25.4%41+ students 112 23.0% 59 22.3% 43 25.0% 14 19.7%Total 486 100.0% 265 100.0% 172 100.0% 71 100.0%Note: The distribution of class sizes differs by faculty and program. The smallest class sizes, including one-on-one instructionand independent study courses, are located primarily in several specific programs. The data presented here are a reasonableapproximation based on a variety of delivery methods that does not always conform to the "primary meet" structure.
Source: Individual institutions
Office of Institutional Research and Planning - Section H http://www.queensu.ca/irp/accountability/CUDO/cudo2010/sectionH.html
1 of 1 02/09/2014 9:57 AM

I1. Revenue for the Fiscal Year Ended April 30, 2009
Operating Other NC Subtotal AncillaryEntities
ConsolidatdEntities Not Consolidatd Subtotal Trust Capital
Total Expendable
Funds Endowment
1 Government Grants and Contracts:a) Ontario MTCU(i) Basic Formula Grant 147965 0 147965 0 0 0 0 0 0 147965 0(ii) Non-Formula Grant 0 0 0 0 0 0 0 0 0 0 0(iii) Other MTCU Grants and Contracts 20616 0 20616 290 3005 0 3005 2899 14031 40841 0b) Other Ontario Government Grants and Contracts 10951 0 10951 0 20700 392 21092 2419 0 34462 0Total Ontario Grants and Contracts 179532 0 179532 290 23705 392 24097 5318 14031 223268 0c) Federal 0 0 0 0 89752 0 89752 198 0 89950 0d) Municipal 0 0 0 0 0 0 0 -30 0 -30 0e) Other Provinces 0 0 0 0 0 0 0 1 0 1 0f) Foreign 0 0 0 0 0 0 0 80 0 80 0
2 Feesa) Tuition Fees 145769 18167 163936 0 0 0 0 0 0 163936 0b) Miscellaneous Fees 8014 0 8014 40413 0 0 0 0 0 48427 0
3 Borrowings 0 0 0 189 0 0 0 0 28500 28689 04 Donations and Non-Govt Grants & Contracts 2724 0 2724 0 58004 4757 62761 17755 6992 90232 153655 Sales of Services and Products 0 0 0 28071 0 0 0 0 0 28071 06 Investment Income
a) Endowment 4615 0 4615 0 1541 0 1541 35540 0 41696 -112182b) Other Investment Income -30812 0 -30812 11 29 0 29 15 0 -30757 -7602
7 Miscellaneous 12528 0 12528 2558 0 0 0 8536 0 23622 0Total 322370 18167 340537 71532 173031 5149 178180 67413 49523 707185 -104419
http://www.queensu.ca/financialservices/reports.html
Source: COU. COFO-UO Financial Report

I2. Expenses for the Fiscal Year Ended April 30, 2009
Operating Other NC Subtotal AncillaryEntities
ConsolidatdEntities Not Consolidatd Subtotal Trust Capital Total
1 Salaries and Wages(i) Academic Ranks 109524 1520 111044 0 7239 0 7239 3025 0 121308(ii) Other Instruction & Research 12404 450 12854 0 41963 1849 43812 2047 0 58713(iii) Other Salaries & Wages 93458 1539 94997 14467 14097 550 14647 16629 0 140740Total Salaries and Wages 215386 3509 218895 14467 63299 2399 65698 21701 0 320761
2 Employee Benefits 44268 474 44742 2411 9852 318 10170 4992 0 62315Total Salaries and Benefits 259654 3983 263637 16878 73151 2717 75868 26693 0 383076
3 Library Acquisitions 10112 0 10112 0 177 0 177 637 0 109264 Equipment and Furniture Purchases 9481 47 9528 1366 23972 263 24235 4144 6458 457315 Equipment Rental and Maintenance 3531 131 3662 884 2411 13 2424 261 0 72316 Printing and Duplicating 2714 12 2726 102 978 57 1035 176 0 40397 Materials and Supplies 20511 4685 25196 8585 31135 1795 32930 4321 102 711348 Communications 3233 155 3388 1143 92 0 92 112 0 47359 Professional Fees 8824 2184 11008 256 3933 83 4016 5460 40 20780
10 Costs of Goods Sold 0 0 0 2459 0 0 0 0 0 245911 Travel 6454 845 7299 596 10373 188 10561 3173 0 2162912 Utilities 14477 0 14477 4847 843 0 843 40 0 2020713 Renovations and Alterations 5209 0 5209 22 397 1 398 81 717 642714 Externally Contracted Services 2217 0 2217 18778 9108 7 9115 867 0 3097715 Scholarships, Bursaries, etc. 27920 0 27920 0 8352 0 8352 21203 0 5747516 Debt Repayments 85 0 85 2947 0 15 15 0 -1625 142217 Interest 0 0 0 5514 0 0 0 0 388 590218 Building, Land and Site Services 400 0 400 82 15 0 15 0 102853 10335019 Other Operational Expenditures 10248 2682 12930 6391 1310 8 1318 1587 0 2222620 Internal Cost Allocations -18358 501 -17857 1889 16900 0 16900 -932 0 021 External Cost Recoveries 0 423 423 0 0 0 0 0 0 423
TOTAL 366712 15648 382360 72739 183147 5147 188294 67823 108933 820149
http://www.queensu.ca/financialservices/reports.html
Source: COU. COFO-UO Financial Report
Home » Public Accountability » CUDO » CUDO 2010 » Section J
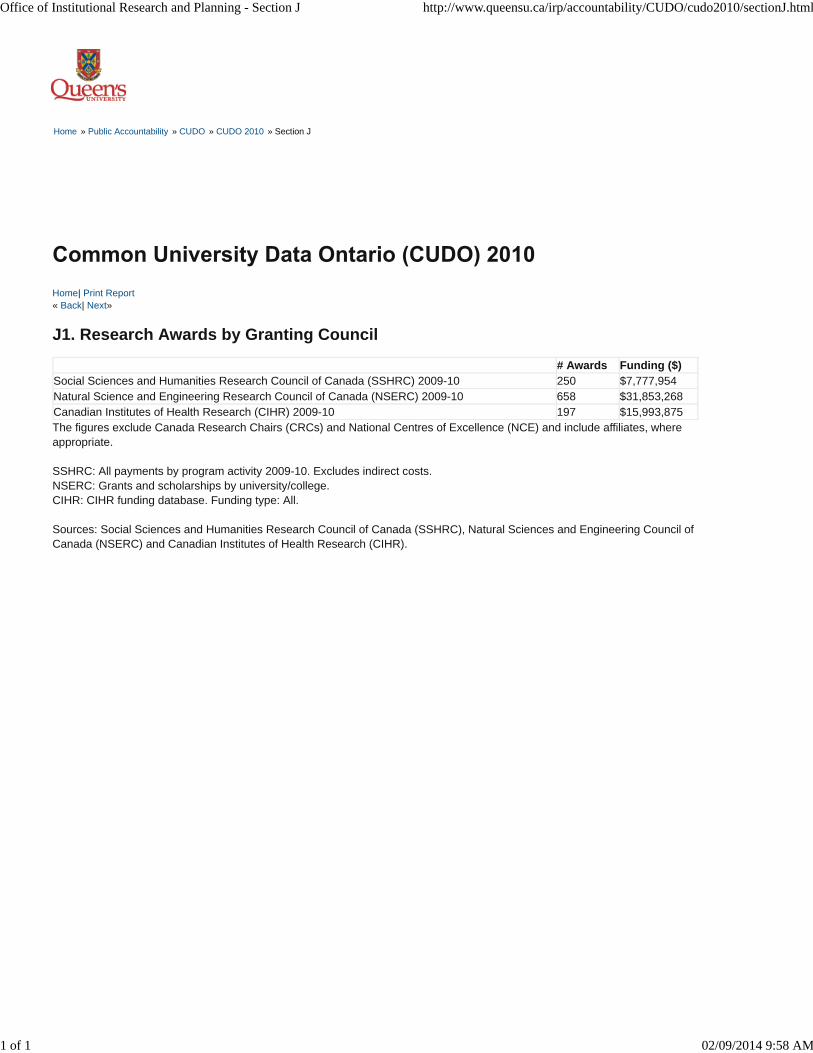
# Awards Funding ($)Social Sciences and Humanities Research Council of Canada (SSHRC) 2009-10 250 $7,777,954Natural Science and Engineering Research Council of Canada (NSERC) 2009-10 658 $31,853,268Canadian Institutes of Health Research (CIHR) 2009-10 197 $15,993,875
Home| Print Report« Back| Next»
J1. Research Awards by Granting Council
The figures exclude Canada Research Chairs (CRCs) and National Centres of Excellence (NCE) and include affiliates, whereappropriate. SSHRC: All payments by program activity 2009-10. Excludes indirect costs.NSERC: Grants and scholarships by university/college.CIHR: CIHR funding database. Funding type: All. Sources: Social Sciences and Humanities Research Council of Canada (SSHRC), Natural Sciences and Engineering Council ofCanada (NSERC) and Canadian Institutes of Health Research (CIHR).
Office of Institutional Research and Planning - Section J http://www.queensu.ca/irp/accountability/CUDO/cudo2010/sectionJ.html
1 of 1 02/09/2014 9:58 AM

Home » Public Accountability » CUDO » CUDO 2010 » Section K
Home| Print Report« Back
Section K1- Academic Plans
Queen's Strategic Framework 2014 - 2019: http://queensu.ca/strategicframework
Queen's Academic Plan: http://www.queensu.ca/principal/wherenext.html
Queen's Enrolment Management Framework: http://www.queensu.ca/provost/enrolmentplanning.html
University Library Strategic Plan: http://library.queensu.ca/library/about/vision/stratplan
Office of Advancement Strategic Direction: http://www.queensu.ca/advancement/vp/overviewofstrategicdirection.html
Campus Master Plan: http://www.queensu.ca/cmp/
Queen's Strategic Research Plan: http://www.queensu.ca/vpr/SRP.html
Section K2 - Key Performance Indicators
Employment Rates of 2006 Graduates in Undergraduate Programs
Program 2-Year Employment Rate (%) 6-Month Employment Rate (%)Agriculture & Biological Science 98.2 97.5Business & Commerce 100.0 100.0Computer Science 90.9 87.5Education 96.1 93.6Engineering 99.1 91.3Fine & Applied Arts 96.0 100.0Humanities 95.0 100.0Kinesiology, Recreation & Physical Education 100.0 100.0Law 100.0 95.8Mathematics 100.0 100.0Medicine and Related Programs 100.0 100.0Nursing 100.0 100.0Physical Science 100.0 100.0Social Science 96.3 96.3Therapy and Rehabilitation 100.0 100.0Overall Average 97.5 95.9Employment Rates: The employment rate is defined as the number of employed persons expressed as a percentage of thelabour force where the labour force is those persons who were employed, or unemployed but looking for work. To determineemployment rates of recent graduates, Ontario universities conducted a survey of all 2006 graduates of undergraduate degreeprograms. Graduates were asked questions regarding their employment situation six months and two years after graduation.
Source: MTCU and Institutions
Office of Institutional Research and Planning - Section K http://www.queensu.ca/irp/accountability/CUDO/cudo2010/sectionK.html
1 of 2 02/09/2014 9:59 AM
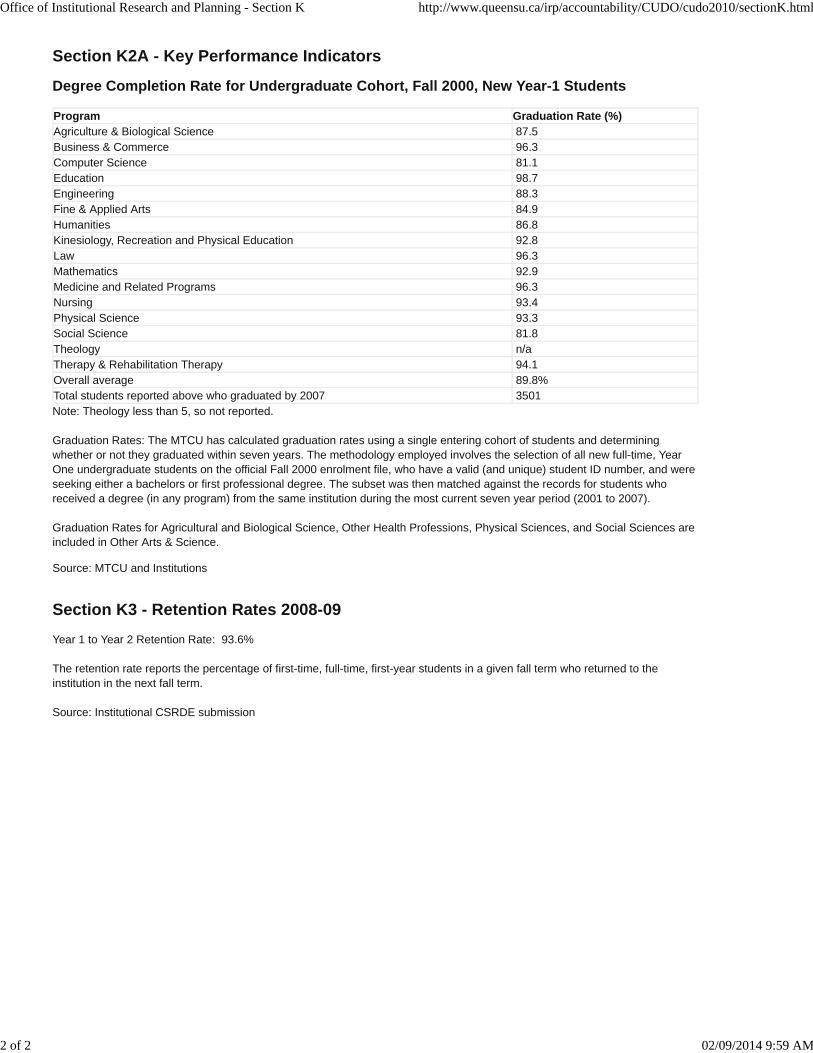
Section K2A - Key Performance Indicators
Degree Completion Rate for Undergraduate Cohort, Fall 2000, New Year-1 Students
Program Graduation Rate (%)Agriculture & Biological Science 87.5Business & Commerce 96.3Computer Science 81.1Education 98.7Engineering 88.3Fine & Applied Arts 84.9Humanities 86.8Kinesiology, Recreation and Physical Education 92.8Law 96.3Mathematics 92.9Medicine and Related Programs 96.3Nursing 93.4Physical Science 93.3Social Science 81.8Theology n/aTherapy & Rehabilitation Therapy 94.1Overall average 89.8%Total students reported above who graduated by 2007 3501Note: Theology less than 5, so not reported.
Graduation Rates: The MTCU has calculated graduation rates using a single entering cohort of students and determiningwhether or not they graduated within seven years. The methodology employed involves the selection of all new full-time, YearOne undergraduate students on the official Fall 2000 enrolment file, who have a valid (and unique) student ID number, and wereseeking either a bachelors or first professional degree. The subset was then matched against the records for students whoreceived a degree (in any program) from the same institution during the most current seven year period (2001 to 2007).
Graduation Rates for Agricultural and Biological Science, Other Health Professions, Physical Sciences, and Social Sciences areincluded in Other Arts & Science.
Source: MTCU and Institutions
Section K3 - Retention Rates 2008-09 Year 1 to Year 2 Retention Rate: 93.6% The retention rate reports the percentage of first-time, full-time, first-year students in a given fall term who returned to theinstitution in the next fall term. Source: Institutional CSRDE submission
Office of Institutional Research and Planning - Section K http://www.queensu.ca/irp/accountability/CUDO/cudo2010/sectionK.html
2 of 2 02/09/2014 9:59 AM