1 nutrient management - international plant nutrition...
TRANSCRIPT

�
1.1RelevanceandcausesofyieldgapsMost rice farmers achieve less than 60% of the climatic and genetic yield potential at a particular site. A simple model can be used to illustrate the factors that explain the “yield gap” (Fig. �).
The yield potential or maximum yield (Ymax
) is limited by climate and rice variety only, with all other factors at optimal levels. Y
max fluctuates from year to year (±10%) because
1 NutrientManagementC. Witt1, R.J. Buresh2, S. Peng2, V. Balasubramanian2, and A. Dobermann2
1 IPNI-IPI Southeast Asia Program, Singapore; 2 International Rice Research Institute, Los Baños, Philippines.
Relative yield (%)
60
40
�00
80
20
0
Yield reduced because
of nutrient imbalance and poor
management
Yield reduced because
of nutrient imbalance
Economic yield target
Yield potential of a variety for a given
climate
Ymax
Ya
YYtarget
Yield gap � (20%)
Yield gap 2 (20%)
Yield gap 3 (20%)
Fig. �. Example for the effect of nutrient and crop management on yield potential or maximum yield (Y
max), yield target (Y
target), attainable yield
(Ya), and actual yield (Y).
2
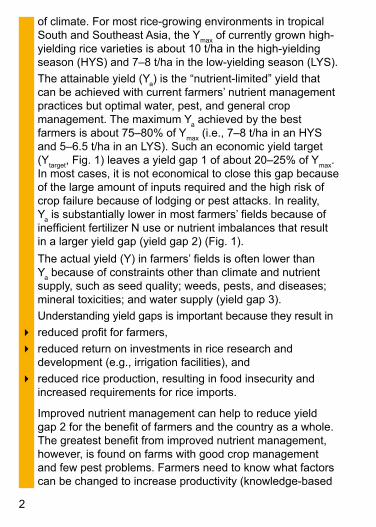
of climate. For most rice-growing environments in tropical South and Southeast Asia, the Y
max of currently grown high-
yielding rice varieties is about �0 t/ha in the high-yielding season (HYS) and 7–8 t/ha in the low-yielding season (LYS).
The attainable yield (Ya) is the “nutrient-limited” yield that
can be achieved with current farmers’ nutrient management practices but optimal water, pest, and general crop management. The maximum Y
a achieved by the best
farmers is about 75–80% of Ymax
(i.e., 7–8 t/ha in an HYS and 5–6.5 t/ha in an LYS). Such an economic yield target (Y
target, Fig. �) leaves a yield gap � of about 20–25% of Y
max.
In most cases, it is not economical to close this gap because of the large amount of inputs required and the high risk of crop failure because of lodging or pest attacks. In reality, Y
a is substantially lower in most farmers’ fields because of
inefficient fertilizer N use or nutrient imbalances that result in a larger yield gap (yield gap 2) (Fig. �).
The actual yield (Y) in farmers’ fields is often lower than Y
a because of constraints other than climate and nutrient
supply, such as seed quality; weeds, pests, and diseases; mineral toxicities; and water supply (yield gap 3).
Understanding yield gaps is important because they result in
4 reduced profit for farmers,
4 reduced return on investments in rice research and development (e.g., irrigation facilities), and
4 reduced rice production, resulting in food insecurity and increased requirements for rice imports.
Improved nutrient management can help to reduce yield gap 2 for the benefit of farmers and the country as a whole. The greatest benefit from improved nutrient management, however, is found on farms with good crop management and few pest problems. Farmers need to know what factors can be changed to increase productivity (knowledge-based

3
management) and should know that larger yield increases result when several constraints (e.g., pest and disease problems and inappropriate nutrient management) are overcome simultaneously.
Crop management
Many general crop management practices affect crop response to improved nutrient management.
Consider the following points:
4 Use high-quality seed of a suitable high-yielding variety.
4 Transplant young seedlings (e.g., �0–20 days old).
4 Level the soil properly and maintain an appropriate water level over the whole field to achieve good crop uniformity. This reduces overall water requirements.
4 Choose a suitable planting density to establish an efficient leaf canopy (e.g., 20–40 hills/m2 with �–3 plants/hill in transplanted rice and 80–�20 kg seed per ha in broadcast, wet-seeded rice).
4 Do not allow weeds to compete with rice plants for space, water, light, and nutrients.
The full potential of improved nutrient management can only be reached with good crop management.
Pests and diseases
Pests and diseases affect crop response to improved nutrient management by damaging the leaf canopy, the plant stem, and the grain. The most common pests in irrigated rice are sheath blight, bacterial leaf blight, stem rot, stem borer, tungro, brown planthopper, rats, and birds.
Consider the following points:
4 Use varieties that are resistant to commonly occurring pests and diseases.

4
4 Avoid excessive N fertilizer use to prevent the development of a lush green foliage that attracts pests and diseases.
4 Before applying N fertilizer, assess the general crop stand, leaf color (using a leaf color chart), and pest and disease incidence.
4 Damage by many diseases (e.g., brown leaf spot, sheath blight, bacterial leaf blight, stem rot, and blast) is greater where excessive N fertilizer and insufficient potassium (K) fertilizer have been used in rice crops affected by K deficiency.
4 Practice integrated pest management (IPM) in cooperation with other farmers.
Efficient N fertilizer use and balanced nutrition minimize the risks of lodging, pests, and diseases.
Nutrient managementA yield target will be reached only when the correct amount of nutrients is supplied at the right time to match the crop’s nutrient requirement during the season.
Efficient and cost-effective nutrient management strategies should aim to
4 maximize crop uptake of nutrients from fertilizers and soil indigenous sources through good crop management practices,
4 make full use of nutrients available in the form of straw, other crop residues, and animal manures,
4 use mineral fertilizers as required to overcome specific nutrient limitations,
4 minimize the risk of crop failure by selecting realistic and economic yield targets and practicing the efficient use of fertilizer and balanced nutrition, and
4 maximize revenue by considering the cost of inputs, including labor, organic manure, and inorganic fertilizer.

5
1.2BasicconceptsofbalancedN,P,andKmanagement
Nutrient input-output
The nutrient budget (B) for a rice field can be estimated as follows (all components measured in kg nutrient per ha):
B = M + A + W + N2 - C - PS - G
where
Inputs: M is the nutrient source added (inorganic and organic); A is atmospheric deposition (rainfall and dust); W is irrigation water, floodwater, and sediments (dissolved and suspended nutrients); and N
2 is biological N
2 fixation.
Outputs: C is net crop removal with grain and straw (total uptake less nutrients returned in crop residues); PS is losses from percolation and seepage; and G is total gaseous N losses from denitrification and NH
3 volatilization.
Soil indigenous nutrient supply and balanced nutrition
Indigenous nutrient supply is the amount of a particular nutrient from all sources except mineral fertilizer (i.e., soil, crop residues, irrigation water) available to the crop during a cropping season.
A reliable, practical indicator of soil nutrient supply is the nutrient-limited yield, which can be measured as grain yield in a nutrient omission plot (e.g., N-limited yield in an omission plot receiving fertilizer P and K but no fertilizer N; see Step 2 in Section �.8).
Balanced fertilization means supplying the crop with the correct amount of all nutrients not supplied in sufficient amounts from indigenous sources (Fig. 2).
In the early years of the Green Revolution, yield increases were mainly achieved through the use of N fertilizers, often subsidized by governments, in combination with modern

6
inbred varieties. Encouraged by the yield response, farmers increased fertilizer N rates to what are now often excessive levels, while applying insufficient amounts of fertilizer P and K. This results in an unbalanced supply of nutrients to the crop. Furthermore, nutrients that were formerly not limiting often became limiting with increasing yield targets (Fig. 2).
Intensive rice cropping with larger yields and 2–3 crops/year results in a risk of depleting the soil’s reserves of P and K because
4nutrients removed in grain may not be replaced by nutrients contained in crop residues, organic manures, and mineral fertilizer,
Fig. 2. Example for limitations in soil indigenous N, P, and K supply estimated as grain yield in omission plots. For the old yield target, the soil would have limitations in N, but not in P and K supply, whereas, for the new yield target, soil nutrient supply would be limiting for all three nutrients in the order N>K>P.
Grain yield (t/ha)7
6
4
5
2
0
3
�
New yield target
Old yield target
0 N 0 K0 POmission plot:
Applied nutrients: +PK +NK

7
4farmers remove straw (which contains large amounts of K) from the field for use as animal bedding and fuel or for industrial use, and
4the amount of P and K removed with grain increases.
Note that the optimal ratio of fertilizer N:P:K to be applied is site-specific as it depends on the yield target and the supply of each nutrient from soil indigenous sources.
If plant growth is limited by nutrient supply only, optimal nutritional balance is achieved with plant uptake of about �5 kg N, 2.6 kg P, and 15 kg K per ton of grain yield (Table 1).
1.3Fertilizer-useefficienciesFertilizer is used efficiently when
4a large proportion of the applied fertilizer is taken up by the crop (termed recovery efficiency, RE) and
4there is a large increase in yield for each kg of fertilizer applied (termed agronomic efficiency, AE).
RE (%) = × 100 Plant N (N fertilized - N unfertilized) in kg/ha
Fertilizer N in kg/ha
AE (kg/kg) = Grain yield (N fertilized - N unfertilized) in kg/ha
Fertilizer N in kg/ha
Table 1. Optimal plant N, P, and K uptake at harvest of modern rice varieties.
traptnalP N P K
)dleiyniargt/ekatpugk(
niarG � 8.� 2
wartS 6 8.0 3�
warts+niarG 5� 6.2 5�

8
Recovery efficiency and agronomic efficiency are maximized when
4 the amount of nutrients applied takes into account the amount supplied by the soil,
4 crops are provided with a balanced supply of all nutrients required,
4 fertilizers are placed in the soil where uptake is greatest (e.g., deep placement of urea tablets),
4 N fertilizers are applied according to changes in plant N status during the growing season by using a leaf color chart,
4 high-quality seed of adapted varieties is used,
4 general crop husbandry (e.g., weed control, plant spacing, nursery management, water management) is carried out to a high standard, and
4 pests and diseases are controlled using integrated pest management techniques.
1.4Site-specificnutrientmanagement(SSNM)The SSNM strategy described here aims to achieve sustainable, large, and economic yields through proper nutrient and crop management by
4 making efficient use of all available nutrient sources, including organic manure, crop residues, and inorganic fertilizer according to availability and cost,
4 following plant need-based N management strategies using the leaf color chart (LCC),
4 using nutrient omission plots to determine the soil indigenous nutrient supply (particularly for P and K),
4 providing the crop with a balanced supply of nutrients (N, P, K, and micronutrients),
�
4 replacing nutrients (particularly P and K) removed with grain and straw to avoid depleting soil nutrient reserves,
4 selecting the least costly combination of fertilizer sources,
4 using high-quality seeds, optimum planting density, integrated pest management, and good crop management to fully exploit the benefit of SSNM, and
4 adjusting SSNM to local needs (i.e., evaluate yield and profit in farmers’ fields with farmer participation).
1.5DevelopingafertilizerprogramFertilizer programs based on SSNM can be developed
4 by farmers for individual fields or
4 by extension campaign planners for larger and relatively uniform areas with similar soil nutrient supply characteristics, referred to as recommendation domains (Section �.7).
Use participatory approaches by involving researchers, extension workers, and local farmers in the development of suitable fertilizer strategies. New recommendations should also be evaluated in demonstration plots for at least �–2 cropping seasons before wide-scale implementation. Table 2 gives a suggested time frame for the development of a fertilizer program.
Notes:✍ Remember to prioritize production constraints: Which
technologies offer the greatest potential for increased productivity?
✍ Try not to introduce too many new recommendations at one time. Focus on two to three technologies (e.g., improved seed quality and an improved fertilizer NPK program).
�0
✍ Use participatory techniques to test the new recommendations on a limited number of farms for one or two seasons and then adjust the recommendations based on the feedback gathered from farmers.
✍ Nutrient deficiencies in rice are most common for N, P, and K, but also for other nutrients such as Zn and S, particularly with increased intensification of rice cropping.
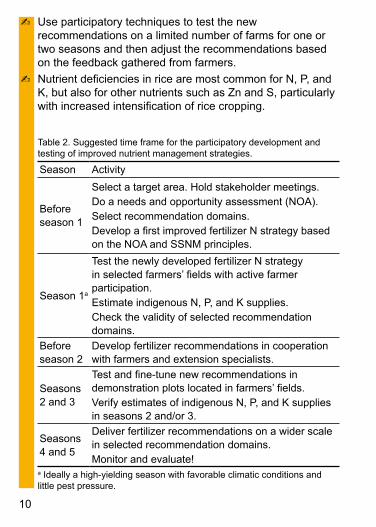
a Ideally a high-yielding season with favorable climatic conditions and little pest pressure.
Table 2. Suggested time frame for the participatory development and testing of improved nutrient management strategies.
Season Activity
Before season �
Select a target area. Hold stakeholder meetings.Do a needs and opportunity assessment (NOA).Select recommendation domains.Develop a first improved fertilizer N strategy based on the NOA and SSNM principles.
Season �a
Test the newly developed fertilizer N strategy in selected farmers’ fields with active farmer participation.Estimate indigenous N, P, and K supplies.Check the validity of selected recommendation domains.
Before season 2
Develop fertilizer recommendations in cooperation with farmers and extension specialists.
Seasons 2 and 3
Test and fine-tune new recommendations in demonstration plots located in farmers’ fields.Verify estimates of indigenous N, P, and K supplies in seasons 2 and/or 3.
Seasons 4 and 5
Deliver fertilizer recommendations on a wider scale in selected recommendation domains.Monitor and evaluate!

��
1.6NeedsandopportunityassessmentAt current production levels and fertilizer prices, most profit increases in rice farming in Asia can be achieved by increasing yield and in part by decreasing costs. Fertilizer costs can be minimized by selecting the least costly combination of locally available fertilizer sources and efficient and balanced use of fertilizer (e.g., investing more in the most limiting nutrient while saving on a less limiting nutrient).
Understanding farmers’ biophysical and socioeconomic production constraints is of fundamental importance for the development of an extension campaign strategy, and this can best be achieved through a needs and opportunity assessment (NOA):
4 evaluate current farmers’ crop, nutrient, and pest management practices to identify management-related constraints,
4assess farmers’ awareness of the productivity constraints identified during the survey,
4 assess whether there is sufficient opportunity to increase productivity considering the farmers’ interest (and the “opportunity cost” of the farmers’ time) and the capacity of all stakeholders (farmers, nongovernmental organizations, extension personnel, local government units, etc.) to implement a program.
Selection of suitable target areas
Select a target area based on the results of the NOA, initial field visits, discussions with stakeholders, and administrative boundaries. Suitable target areas for the introduction of improved nutrient management strategies will likely have one or more of the following characteristics:
4Insufficient or unbalanced use of fertilizer, resulting in a low attainable yield despite high yield potential (Section �.�).

�2
Find out about local fertilizer use from farmers, fertilizer suppliers, and extension workers.
4Occurrence of nutrient deficiency symptoms (Section 2).
4Occurrence of pest problems linked to nutrient imbalance or overuse of fertilizer N (e.g., sheath blight).
4Inefficient fertilizer N use because of high total N rates or inadequate splitting and timing, for example, if farmers
8use fertilizer N rates of >175 kg/ha,
8apply large amounts of fertilizer N during early crop growth (>50 kg N per ha within the first 10 days after transplanting/days after sowing (DAT/DAS) or >75 kg N per ha within the first 20 DAT/DAS),
8apply topdressings of >50 kg N per ha per split,
8need to apply >55 kg fertilizer N per ha (120 kg urea per ha) per ton yield increase over yield in a 0 N plot, and
8encounter problems with lodging.
4Evidence of strong mining of soil indigenous P or K, for example, if farmers grow two or more crops per year at moderate to high yield levels, and in the past five years
8applied <20 kg P2O
5 per ha per crop or
8applied <�0 kg K2O per ha per crop and removed most
straw.
Prices, availability, and quality of nutrient sources
Improved fertilizer practices will be adopted by farmers only if
4the practices are shown to produce a greater economic return for farmers and
4high-quality mineral fertilizers are available in sufficient quantity in the farmers’ locality.
Crosschecks on fertilizer prices and fertilizer quality should be included as part of the NOA.
�3
Gross margin analysis
Before testing new recommendations in the field, complete a gross margin or profit analysis to determine
4the value of all input costs expressed as grain yield (i.e., the “breakeven yield”),
4the additional cost of inputs required under the new practice,
4the additional costs (e.g., labor) required to implement the new fertilizer practice, and
4the net increase in profit compared with the old practice.
Willingness to change
Farmers are the most important partners in the development of improved fertilizer recommendations and should be consulted right from the beginning through NOAs and participatory approaches during the validation of new strategies.
Investigators must confirm that land, labor, and capital are available in sufficient amounts to permit the adoption of new technology. Investigate what sources of credit and what interest rates apply where farmers need to borrow funds for the purchase of inputs.
Farmers are more likely to adopt a new fertilizer program if the strategy
4results in a yield increase of at least 0.5 t/ha (“seeing is believing”),
4provides a significant increase in farm profit, and
4can be integrated with current farmers’ overall management practices (including labor requirements).

�4
1.7RecommendationdomainsDevelop fertilizer recommendations in the target area based on an identified recommendation domain. Recommendation domains can be developed using a minimum set of available biophysical and socioeconomic characteristics that determine uniformity of yield potential, indigenous nutrient supply, and an expected response to fertilizer within the domain. A recommendation domain can be characterized as an area with
4one watershed boundary,
4a common cropping system and crop calendar,
4similar access to irrigation water,
4similar soil fertility status (based on existing information on soil fertility, including maps on soil texture and other soil properties, topography, local knowledge of farmers and extension workers), and
4boundaries that possibly include several administrative units.
The soil fertility status in a recommendation domain can be verified by estimating the soil indigenous nutrient supplies using omission plots (see Section 1.8). The size of a recommendation domain can vary widely depending on the spatial variability of the parameters mentioned above.
Recommendations
Recommendations are then developed together with farmers, using participatory approaches. Separate recommendations may be provided for different
4yield targets (or levels of inputs), 4crop establishment methods,4varieties, and 4residue management practices
to respond to the current practices, needs, and interests of farmers in the recommendation domain.

�5
1.8DevelopmentoffertilizerN,P,andKrecommendations
This section describes how to calculate balanced fertilizer N, P, and K rates to achieve a yield target and gives suggestions for the timing and splitting of fertilizer N and K (Table 3). The approach can be used by extension campaign planners to develop a recommendation for a larger domain (Section �.7) or by farmers to develop a fertilizer recommendation for a single field.
If a full fertilizer program is to be developed for a recommendation domain, the fertilizer calculation involves the following steps:
Step 1. Selecting an economic yield target.
Step 2. Estimating soil nutrient supplies.
Step 3. Calculating fertilizer N rates and use of plant need-based N management.
Step 4. Calculating fertilizer P2O
5 rates.
Step 5. Calculating fertilizer K2O rates.
The methods to calculate fertilizer rates provided in this chapter are based on the following general assumptions that
4 high-yielding rice varieties with a harvest index of about 0.50 are used,
4 an economic yield target of not more than 75–80% of the yield potential is selected,
4 balanced N, P, and K fertilization is followed,
4 N fertilizer is supplied in an optimal number of correctly timed splits using the leaf color chart (LCC),
4 good crop management practices are followed, and
4 other constraints such as water supply, weed infestation, and pests and diseases do not limit crop growth severely.

�6
Tabl
e 3.
Mat
rix fo
r de
velo
ping
fert
ilize
r N
, P, a
nd K
rec
omm
enda
tions
.
Uni
tD
ry s
easo
nW
et s
easo
n
Ste
p1
.Sel
ect
ane
con
om
icy
ield
tar
get
Y
ield
pot
entia
l
A
ctua
l yie
ld in
farm
ers’
fiel
d (a
vera
ge)
Y
ield
targ
et
t/ha
t/ha
t/ha
Ste
p2
.Est
imat
eso
iln
utr
ien
tsu
pp
lies
fro
my
ield
ino
mis
sio
np
lots
N
-lim
ited
yiel
d (y
ield
in 0
N p
lot)
P
-lim
ited
yiel
d (y
ield
in 0
P p
lot)
K
-lim
ited
yiel
d (y
ield
in 0
K p
lot)
t/ha
t/ha
t/ha
Ste
p3
.Cal
cula
tef
erti
lizer
Nr
ates
an
du
seo
fp
lan
tn
eed
-bas
edN
man
agem
ent
R
equi
red
yiel
d in
crea
se (
yiel
d ta
rget
less
yie
ld in
0 N
plo
t)
E
stim
ated
tota
l am
ount
of r
equi
red
fert
ilize
r N
E
arly
N a
pplic
atio
n (w
ithin
14
DA
T o
r 21
DA
S)
t/ha
kg/h
a
kg/h
a
O
ptio
n 1:
Rea
l-tim
e ap
proa
ch
N r
ate
thro
ugho
ut th
e se
ason
(
t
o
D
AT
/DA
S)
Crit
ical
LC
C v
alue
Rea
ding
inte
rval
kg/h
a
Pan
el n
o.
days

�7
a L =
low
, M =
med
ium
, H =
hig
h.
Uni
tD
ry s
easo
nW
et s
easo
n
O
ptio
n 1:
Fix
ed-t
ime
appr
oach
1st t
op d
ress
ing
of fe
rtili
zer
N a
t act
ive
tille
ring
2nd
top
dres
sing
of f
ertil
izer
N a
t pan
icle
initi
atio
n
Opt
iona
l ext
ra to
p dr
essi
ng a
t ear
ly h
eadi
ng
Crit
ical
LC
C v
alue
kg/h
a
kg/h
a
kg/h
a
Pan
el n
o.
Ste
p4
.Cal
cula
tef
erti
lizer
P2O
5ra
tes
M
aint
enan
ce fe
rtili
zer
P2O
5 ra
tes
kg/h
a
Ste
p5
.Cal
cula
tef
erti
lizer
K2O
rat
es
A
mou
nt o
f str
aw r
etur
ned
befo
re s
easo
n
M
aint
enan
ce fe
rtili
zer
K2O
rat
es
�st a
pplic
atio
n at
D
AT
/DA
S (
%)
2nd
appl
icat
ion
at
DA
T/D
AS
(
%
)
L/M
/Ha
kg/h
a
kg/h
a
kg/h
a

�8
Step 1. Selecting an economic yield target
4Select a yield target that is based on the average yield of the past 3–5 crops (same season) attainable with farmers’ current good crop management practices when nutrient-related constraints are overcome (see NPK plots, Fig. 3).
4 The yield target reflects the total amount of nutrients that must be taken up by the crop. It is location- and season-specific, depending on climate, cultivar, and crop management.
4 Select a yield target of not more than 75–80% of the potential yield (Y
max) determined with crop simulation
models. Yield targets that are too close to the potential yield may require larger amounts of fertilizer inputs and increase the risks of crop failure and profit losses.
4 Select a higher yield target in the high-yielding season (favorable climatic conditions) and a moderate yield target in lower-yielding seasons (less favorable climatic conditions and greater risks of crop failure because of lodging or pests and diseases).
Step 2. Estimating soil nutrient supplies
Use grain yield in nutrient omission plots (under favorable weather conditions and good growing conditions) as an indicator of the potential soil supply of N, P, and K in a cropping season (Fig. 3). Use good-quality seeds and follow proper crop management, including water and pest control.
4Select 10–20 representative farmers’ fields for a recommendation domain and establish a 20 m × 5 m plot in each farmer’s field. Divide the plot into four 5 m × 5 m omission plots (bunds must be 25 cm wide and 25 cm high to prevent nutrient movement between plots):
0 N The N-limited yield is measured in an N omission plot that receives fertilizer P and K, but no fertilizer

��
N. Install bunds to prevent cross-plot contamination when the farmer applies fertilizer N to other parts of the field during the season.
0 P The P-limited yield is measured in a P omission plot. The plot receives fertilizer N and K, but no fertilizer P. Apply sufficiently large amounts of fertilizer N and K to reach the yield target.
0 K The K-limited yield is measured in a K omission plot. The plot receives fertilizer N and P, but no fertilizer K. Apply sufficiently large amounts of fertilizer N and P to reach the yield target.
NPK The attainable yield is measured in a plot that receives fertilizer N, P, and K. Apply sufficiently large amounts of fertilizer N, P, and K to reach the yield target for the recommendation domain.
In 0 P, 0 K, and NPK plots, follow a proper splitting pattern for fertilizer N to avoid lodging. Apply sufficient Zn and other micronutrients to all plots if deficiencies of these nutrients commonly occur.
Irrigation canal
Farmer’s field
5 mNPK
+N, +P, +K
5 m
0 N
+P, +K
5 m
0 P
+N, +K
5 m
0 K
+N, +P
5 m
Fig. 3. Design of a set of NPK and omission plots in a farmer’s field. As much as possible, avoid field endings, where farmers turn when plowing.

20
4At crop maturity, measure grain yield from a central 2 m x 2.5 m area in each omission plot. Cut all panicles and place them on a plastic sheet to prevent yield loss. Strip all spikelets carefully, remove unfilled spikelets, and spread the grain on the plastic sheet. Dry the grain in full sunlight for one whole day to reach grain moisture content of about �2–�6%. It may take 2–3 days to sun-dry the grain fully in a rainy season. Express grain yield (GY) in t/ha.
4Average the yield estimates obtained from the �0–20 farmers’ fields for each omission plot type to obtain
8the average N-limited yield (yield in 0 N plots),
8 the average P-limited yield (yield in 0 P plots),
8the average K-limited yield (yield in 0 K plots), and
8the attainable yield (yield in NPK plots)
for the recommendation domain.
4 If yield measurements in the omission plots indicate large differences in soil nutrient supply within particular areas of your recommendation domain, consider dividing the domain into two or more areas. As a rule of thumb, the average yield in omission plots should differ consistently by at least � t/ha to justify two separate domains.
Notes: ✍ It is essential to adopt a proper N management strategy
for 0 P, 0 K, and NPK plots, as the P and K uptake of rice is affected strongly by the management of N, the most commonly limiting nutrient. Fertilizer N rates should be sufficiently high to reach about 75–80% of the yield potential, and timing and splitting of fertilizer N should be optimal (Step 3). Do not follow the current farmers’ N management practice in 0 P, 0 K, and NPK plots!

2�
✍ Depending on yield and season, apply at least 30–45 kg P
2O
5 per ha in 0 K plots and 50–�00 kg K
2O per ha in 0 P
plots.
✍ The use of GY as an indicator of potential nutrient supply is only valid if measured in a season with favorable climatic conditions and proper crop management. Yield should not be limited by other factors such as the supply of other nutrients, water supply, and pests and diseases. Do not use data if yield losses from lodging, rats, pests, etc., were large.
✍ Nutrient supply measured as GY is smaller in wet broadcast-seeded rice than in transplanted rice because plant-based measures of indigenous nutrient supply are also affected by variety and crop establishment method. It is therefore important to measure the soil nutrient supply in farmers’ fields using the farmers’ crop establishment methods.
✍ If the current farmers’ practice includes the application of organic fertilizers such as farmyard manure in addition to inorganic fertilizer, apply the same amount of organic fertilizer in each omission plot.
Step 3. Calculating fertilizer N rates and use of plant need-based N management
Two complementary approaches (real-time and fixed-time) have been used successfully in farmers’ fields to manage fertilizer N efficiently. Table 3 gives the major features of both approaches. We recommend testing both strategies side by side using participatory approaches in farmers’ fields to evaluate their performance before wider-scale dissemination. Consider socioeconomic factors when developing fertilizer N management strategies (labor availability and cost, prices of rice and fertilizer, available fertilizer sources, current application practices).
22
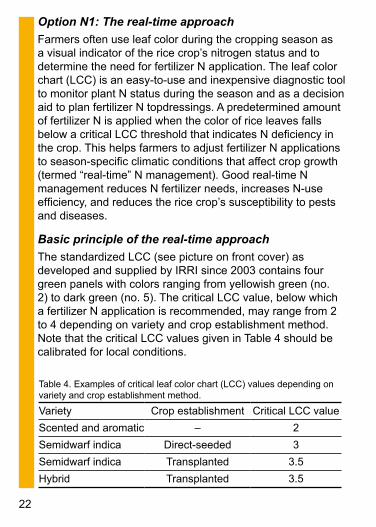
Option N1: The real-time approach
Farmers often use leaf color during the cropping season as a visual indicator of the rice crop’s nitrogen status and to determine the need for fertilizer N application. The leaf color chart (LCC) is an easy-to-use and inexpensive diagnostic tool to monitor plant N status during the season and as a decision aid to plan fertilizer N topdressings. A predetermined amount of fertilizer N is applied when the color of rice leaves falls below a critical LCC threshold that indicates N deficiency in the crop. This helps farmers to adjust fertilizer N applications to season-specific climatic conditions that affect crop growth (termed “real-time” N management). Good real-time N management reduces N fertilizer needs, increases N-use efficiency, and reduces the rice crop’s susceptibility to pests and diseases.
Basic principle of the real-time approach
The standardized LCC (see picture on front cover) as developed and supplied by IRRI since 2003 contains four green panels with colors ranging from yellowish green (no. 2) to dark green (no. 5). The critical LCC value, below which a fertilizer N application is recommended, may range from 2 to 4 depending on variety and crop establishment method. Note that the critical LCC values given in Table 4 should be calibrated for local conditions.
Table 4. Examples of critical leaf color chart (LCC) values depending on variety and crop establishment method.
Variety Crop establishment Critical LCC value
Scented and aromatic – 2
Semidwarf indica Direct-seeded 3
Semidwarf indica Transplanted 3.5
Hybrid Transplanted 3.5

23
Guidelines for using the leaf color chart
4Take LCC readings once every 7 to �0 d, starting after �4 DAT for transplanted rice (TPR) or 2� DAS for wet-seeded rice (WSR). The last reading is taken when the crop starts flowering (first flowering). If farmers prefer to take fewer measurements, recommend the fixed-time approach (option N2) in which LCC readings are taken at critical crop growth stages such as active tillering and panicle initiation (see A-�).
4Choose the topmost fully expanded leaf (Y leaf) for leaf color measurement because it is a good indicator of the N status of rice plants. The color of a single leaf is measured by comparing the color of the middle part of the leaf with the colors on the chart. If the leaf color falls between two values, the mean of the two values is taken as the LCC reading. For example, if the leaf color lies between values 3 and 4, it is noted as 3.5.
4During measurement, always shade the leaf being measured with your body because the leaf color reading is affected by the sun’s angle and sunlight intensity. If possible, the same person should take LCC readings at the same time of day each time measurements are taken.
4Take readings of �0 leaves from hills chosen randomly within a field. If six or more leaves show color values below the established critical values, immediately apply N fertilizer.
4Recommended N application rates for semidwarf indica varieties are given in Table 5.
Guidelines for calibrating the leaf color chart
LCC calibration trials can be established at a research farm or in farmers’ fields. Select 3–4 of the most common local varieties and compare the performance of the rice crop using different critical LCC values (e.g., 3, 3.5, and 4). Apply fertilizer N using the LCC as described above. In addition to

24
fertilizer use, also record grain yield and yield components (optional), qualitative scores for insect pest and disease incidence, and the extent of lodging.
4Choose a factorial design for on-station experiments, for example, three varieties and three critical LCC values as treatments in a randomized complete block design with four replications.
4Use farms as replicates if you decide to conduct the calibration trials in farmers’ fields. Select at least four farmers’ fields per variety as replicates and test 2–3 critical LCC values in each field.
4Include a plot without fertilizer application to calculate the agronomic efficiency (AE, kg grain yield increase per unit fertilizer N applied, see Section 1.3) for different treatments.
4The critical LCC values mainly depend on variety and crop establishment method (Table 4), while the amount of fertilizer N to be applied per split application is season-specific and depends mainly on the expected yield increase as affected by climate (Table 5).
Notes:✍ Because the LCC approach is a plant-based N management
approach, only an approximate estimate of N-limited yield
Table 5. Proposed amounts of fertilizer N to be applied to semidwarf indica varieties each time the leaf color falls below the critical LCC value.
Expected yield increase over 0 N plot (t/ha)
Application rate during period after �4 DAT or 2� DAS up to panicle initiation (kg N/ha) a
�–2 25
2–3 35
3–4 45a Apply about 25 kg N/ha after panicle initiation up to first flowering.
25
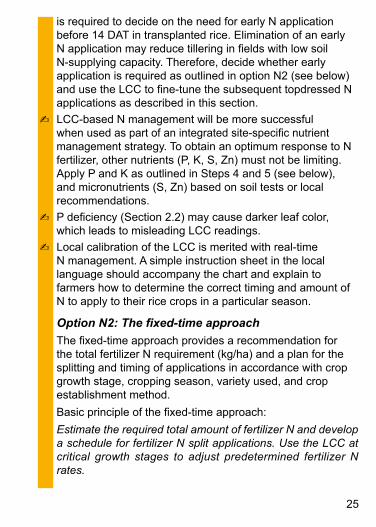
is required to decide on the need for early N application before �4 DAT in transplanted rice. Elimination of an early N application may reduce tillering in fields with low soil N-supplying capacity. Therefore, decide whether early application is required as outlined in option N2 (see below) and use the LCC to fine-tune the subsequent topdressed N applications as described in this section.
✍ LCC-based N management will be more successful when used as part of an integrated site-specific nutrient management strategy. To obtain an optimum response to N fertilizer, other nutrients (P, K, S, Zn) must not be limiting. Apply P and K as outlined in Steps 4 and 5 (see below), and micronutrients (S, Zn) based on soil tests or local recommendations.
✍ P deficiency (Section 2.2) may cause darker leaf color, which leads to misleading LCC readings.
✍ Local calibration of the LCC is merited with real-time N management. A simple instruction sheet in the local language should accompany the chart and explain to farmers how to determine the correct timing and amount of N to apply to their rice crops in a particular season.
Option N2: The fixed-time approach
The fixed-time approach provides a recommendation for the total fertilizer N requirement (kg/ha) and a plan for the splitting and timing of applications in accordance with crop growth stage, cropping season, variety used, and crop establishment method.
Basic principle of the fixed-time approach:
Estimate the required total amount of fertilizer N and develop a schedule for fertilizer N split applications. Use the LCC at critical growth stages to adjust predetermined fertilizer N rates.

26
Use Table 6 to derive the total fertilizer N rate based on
4 the expected yield response to fertilizer N application calculated from the difference between yield target and yield in 0 N plots (Steps 1 and 2) and
4 the attainable agronomic N efficiency (AEN, see pages 7-8).
Rule of thumb: Apply 40–60 kg fertilizer N per ha for each ton of expected grain yield response to fertilizer N application.
Apply less N to crops in the rainy season (less sunshine, lower yield response) and apply more N to crops in the dry season (more sunshine, higher yield response).
Select an expected yield response of ≥ 4 t/ha over the yield in the 0 N plot only for high-yielding seasons with very favorable climatic conditions.
Experience in tropical Asia indicates that an AEN of 25
is often achievable with good crop management in high-yielding seasons, and an AE
N of �6.7 or 20 is achievable
with good crop management in low-yielding seasons.
Table 6. Fertilizer N rates according to the attainable yield response (yield target – yield in 0 N plots) and the expected agronomic N efficiency (AE
N, kg grain yield increase/kg fertilizer N).
Agronomic N efficiency (∆kg grain/kg fertilizer N)
�6.7 20 25
Yield response to fertilizer N application (t/ha)
Fertilizer N rate (kg/ha)
� 60 50 402 �20 �00 803 �80 �50 �20
4 3 200 �60
5 3 3 200
3indicates unrealistic yield targets.

27
Note that the AEN is usually higher at low N rate than at
high N rate. The aim of effective, environmentally sound N management in the tropics is to achieve high, economic yields while realizing an optimal AE
N between �6.7 and 25
kg grain increase per kg fertilizer N. In subtropical climate, yield responses can be > 5 t/ha with optimal AE
N > 25 kg/kg,
in which case suggested fertilizer N rates in Table 6 would need to be adjusted.
4 Divide total fertilizer N recommendations into 2–4 split applications. Use more splits with long-duration varieties and in high-yielding seasons. Apply more N when the crop demand for N is large (e.g., between mid-tillering and flowering). Make a large single fertilizer N application of > 45 kg N per ha only if weather conditions are very favorable and crop response to N is large.
4 Use Tables 7–9 to develop approximate rates for N split applications. Growth stages are given, but the actual application date depends on variety (crop duration). For tropical rice, panicle initiation is about 60 days before harvest, and active tillering is approximately midway between �4 DAT or 2� DAS and panicle initiation.
4 Use the following guidelines to determine the need for early N application to young rice before 14 DAT or 21 DAS:
8 Eliminate early application when yield response is ≤1 t/ha. At yield responses between � and 3 t/ha, typically apply about 20 to 30 kg N per ha. At yield response > 3 t/ha, apply about 25% to 30% of the total N.
8 Reduce or eliminate early N applications when high-quality organic materials or composts are applied.
8 Avoid large early fertilizer N applications (i.e., >50 kg N per ha) in transplanted rice because early growth is slow and N uptake is poor during the first 3 weeks after transplanting.

28
8 Increase early N application for low tillering and large panicle type varieties when old seedlings (>24 days old) or short-duration varieties are used, where the plant spacing is wide (<20 hills/m2) to enhance tillering, or in areas with low air and water temperature at transplanting or sowing (e.g., at higher elevations).
8 Incorporate early N into the soil before planting or apply early N within 14 days after transplanting or 21 days after sowing. Use NH
4-N and not NO
3-N as an early N
source. There is no need to use the LCC with the early N application.
4 Use the LCC to assess leaf N status and the crop needs for N after 14 DAT and 21 DAS. Adjust fertilizer N rates upward when leaves are yellowish green and downward when leaves are green.
4 Apply a late N dose (e.g., at early heading) to delay leaf senescence and enhance grain filling, but only to healthy crops with good yield potential. Hybrid rice and large panicle type varieties in high-yielding seasons often require an N application at early heading. To reduce the risk of lodging and pests, do not apply excessive amounts of N fertilizer between panicle initiation and flowering, particularly in the low-yielding seasons.
4 For the standardized IRRI LCC with most rice varieties, the leaf colors mentioned in Tables 7–� correspond to LCC values as follows:
8 Yellowish green = LCC value 3,
8 Intermediate = LCC value 3.5 (intermediate between 3 and 4), and
8 Green = LCC value 4.
4 The fertilizer rates in Tables 7–9 are for relatively high N-use efficiencies (agronomic N efficiency or AE
N) of about
16.7– 20 kg grain increase/kg fertilizer N applied in seasons

2�
with 1–2 t/ha expected response to fertilizer N and 25 kg grain increase/kg fertilizer N applied in seasons with 3–4 t/ha expected response to fertilizer N (see Table 6).
4 Use the LCC to monitor plant N status to optimize the amount of split applications in relation to crop demand and soil N supply. The N rates for specific leaf colors (LCC values) in Tables 7–9 are intended to provide sufficient flexibility to accommodate conditions when the crop response to fertilizer in a given season and location differs markedly from the expected yield increase to fertilizer N.
4 N rates in Tables 7–9 can be fine-tuned and tailored to accommodate location-specific crop-growing conditions and rice varieties.
1. Transplanted rice (inbred variety) (see Table 7)
With 20–40 hills/m2, high-yielding conventional variety, continuous flooding or intermittent irrigation. Transplanted rice has slower leaf area development, dry matter accumulation, and N uptake during early growth, but high growth rates and N uptake after mid-tillering to grain filling.
2. Wet-seeded rice (see Table 7)
With 80–�50 kg seed per ha, broadcast, high-yielding conventional variety, continuous flooding after crop emergence. Broadcast wet-seeded rice has more rapid leaf area development, dry matter accumulation, and N uptake during early growth, but a slower growth rate and N uptake after panicle initiation, particularly during grain filling. Early leaf senescence and lodging are more severe in wet-seeded rice than in transplanted rice. Wet-seeded rice needs little or no late N application.
3. Transplanted rice (hybrid) (see Table 8)
With 20–30 hills/m2, hybrid rice with high yield potential, continuous flooding or intermittent irrigation. Transplanted

30
hybrid rice often responds to late N application in high-yielding seasons.
Table 8. An approximate fertilizer N splitting for transplanted hybrid rice with high N-use efficiency.
Expected yield increase over 0 N plot
� t/ha
2 t/ha
3 t/ha
4 t/ha
Growth stage Leaf color a Fertilizer N rate (kg/ha)Preplant to �4 DAT – 20 30 45
Active tillering
Yellowish green 35 45 45 60Intermediate 25 35 35 45Green – – 25 25
Panicle initiation
Yellowish green 35 45 60 60Intermediate 25 35 45 45
Green – 25 25 35
Early heading Yellowish green – – 20 20a See text on page A-6 in the Annex for corresponding LCC values.
Table 7. An approximate fertilizer N splitting for transplanted and wet-seeded inbred rice with high N-use efficiency.
Expected yield increase over 0 N plot
� t/ha
2 t/ha
3 t/ha
4 t/ha
Growth stage Leaf colora Fertilizer N rate (kg/ha)
Preplant to �4 DAT or 2� DAS – 20 30 45
Active tillering
Yellowish green 35 45 45 60Intermediate 25 35 35 45Green – – 25 25
Panicle initiation
Yellowish green 35 45 60 60Intermediate 25 35 45 45
Green – 25 25 35a See text on page A-6 in the Annex for corresponding LCC values.

3�
4. Transplanted rice (large panicle type) (see Table 9)
High-yielding rice with very large panicles (panicle weight type rice), relatively low tillering and good resistance to lodging. Includes some new plant type rice and some hybrid rice such as the Chinese “super” hybrid rice.
Notes:✍ Do not topdress N when heavy rainfall is expected.
Step 4. Calculating fertilizer P2O
5 rates
The major objective of P management is to prevent P deficiency rather than treat P-deficiency symptoms. If low soil P supply is the reason the targeted yields are not achieved, management must focus on the buildup and maintenance of adequate soil-available P levels to ensure
Table 9. An approximate fertilizer N splitting for large panicle type (panicle weight type) rice.
Expected yield increase over 0 N plot
� t/ha
2 t/ha
3 t/ha
4 t/ha
Growth stage Leaf colora Fertilizer N rate (kg/ha)Preplant to �4 DAT 25 30 40 50
Active tillering
Yellowish green – 35 45 45Intermediate – 25 35 35Green – – 25 25
Panicle initiation
Yellowish green 45 45 45 60Intermediate 35 35 35 45
Green 25 25 25 35
Early heading – – 25b 25b
a See text on page A-6 in the Annex for corresponding LCC values.b Apply N regardless of LCC reading.

32
that P supply does not limit crop growth and N-use efficiency.
P is not easily lost from the system, but inputs from sources such as irrigation water and straw are generally small. P fertilizer application has residual effects that can last several years, and maintenance of soil P supply requires long-term strategies tailored to site-specific conditions that consider P inputs from all sources.
Sustainable P management requires the replenishment of soil P reserves, especially at high yield levels in double and triple rice-cropping systems, even if a direct yield response to P application is not expected.
Rule of thumb: Where the soil P supply is small, apply 20 kg fertilizer P
2O
5 per ha for each ton of target grain yield
increase (difference between yield target and yield in 0 P plot).
The maintenance fertilizer P rates given in Table 10 are designed to replenish the P removed with grain and straw, assuming a low to moderate return of crop residues. Look up the fertilizer P
2O
5 rate based on
4the yield target (Step �) and
4an estimate of soil P supply measured as yield in a 0 P omission plot (Step 2).
Theoretically, fertilizer P application would not be required if a yield response were not expected for the selected yield target (i.e., if yield target = yield in nutrient omission plot). This “zero-P fertilizer” strategy results in mining the soil of P reserves and may affect yields in the medium to long term, especially if other nutrient sources such as straw or manure are not applied.

33
Table 10. Maintenance fertilizer P2O
5 rates according to yield targets and
P-limited yield in 0 P plots.
Yield target (t/ha) 4 5 6 7 8
Yield in 0 P plot (t/ha)
Fertilizer P2O
5 rate (kg/ha)
3 20 40 60 3 3
4 �5 25 40 60 3
5 0 20 30 40 606 0 0 25 35 457 0 0 0 30 408 0 0 0 0 35
3indicates unrealistic yield targets.
Notes:✍ Use a lower yield target (t/ha) in Table �0 where a yield
increase of more than 3 t/ha over the yield in the 0 P plot would be required. Aiming at such high yield increases would first require a buildup of soil fertility over several seasons.
✍ To prevent mining of soil P reserves, the following rules of thumb can also be applied:
8If most of the straw is retained in the field (e.g., after combine harvest or harvest of panicles only) and the nutrient input from manure is small, apply at least 4 kg P
2O
5 per ha for each ton of grain harvested (e.g., 20 kg
P2O
5 for a yield of 5 t/ha) to replenish P removed with
grain.
8If straw is fully removed from the field and nutrient input from other sources (manure, water, sediment) is small, apply at least 6 kg P
2O
5 per ha for each ton of
grain harvested (e.g., 30 kg P2O
5 for a yield of 5 t/ha) to
replenish P removed with grain and straw.
34
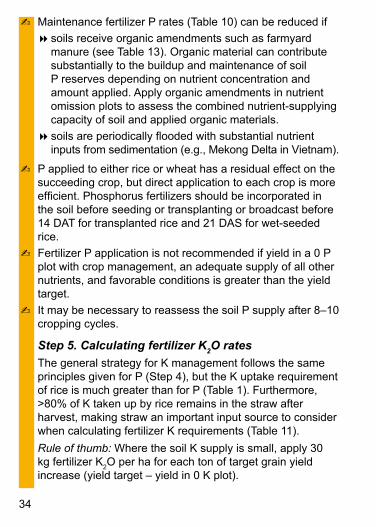
✍ Maintenance fertilizer P rates (Table 10) can be reduced if
8soils receive organic amendments such as farmyard manure (see Table �3). Organic material can contribute substantially to the buildup and maintenance of soil P reserves depending on nutrient concentration and amount applied. Apply organic amendments in nutrient omission plots to assess the combined nutrient-supplying capacity of soil and applied organic materials.
8soils are periodically flooded with substantial nutrient inputs from sedimentation (e.g., Mekong Delta in Vietnam).
✍ P applied to either rice or wheat has a residual effect on the succeeding crop, but direct application to each crop is more efficient. Phosphorus fertilizers should be incorporated in the soil before seeding or transplanting or broadcast before �4 DAT for transplanted rice and 2� DAS for wet-seeded rice.
✍ Fertilizer P application is not recommended if yield in a 0 P plot with crop management, an adequate supply of all other nutrients, and favorable conditions is greater than the yield target.
✍ It may be necessary to reassess the soil P supply after 8–�0 cropping cycles.
Step 5. Calculating fertilizer K2O rates
The general strategy for K management follows the same principles given for P (Step 4), but the K uptake requirement of rice is much greater than for P (Table �). Furthermore, >80% of K taken up by rice remains in the straw after harvest, making straw an important input source to consider when calculating fertilizer K requirements (Table 11).
Rule of thumb: Where the soil K supply is small, apply 30 kg fertilizer K
2O per ha for each ton of target grain yield
increase (yield target – yield in 0 K plot).

35
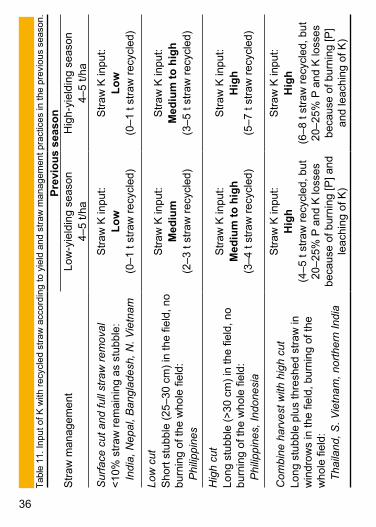
The maintenance fertilizer K rates given in Table 12 are designed to replenish the K removed with grain and straw by considering the amount of straw returned to the field from the previous crop.
Look up the required fertilizer K2O rate in Table �2 based on
4the yield target (Step �),
4the estimate of soil K supply measured as yield in a 0 K omission plot (Step 2), and
4the amount of K recycled with straw yield and the straw management level in the previous season (Table ��).
Substantial mining of soil K reserves may affect yields in the medium to long term, especially if most straw is removed. As a minimum, sufficient K should be applied to replenish the K removed with grain and straw.
Notes:✍ The maintenance fertilizer K rates given in Table 12 can be
reduced if
8soils receive organic amendments such as farmyard manure (see Table �3 for typical K content of organic materials). Organic material can contribute substantially to the buildup and maintenance of soil K reserves depending on nutrient concentration and amount applied. Apply organic amendments in nutrient omission plots to assess the combined nutrient-supplying capacity of soil and applied organic materials; or
8soils are periodically flooded with substantial nutrient inputs from sedimentation (e.g., Mekong Delta in Vietnam).
✍ Use a lower yield target (t/ha) in Table �2 where a yield increase of >3 t/ha over the yield in the 0 K plot would be required. Aiming at such large yield increases would most likely require a buildup of soil fertility over a longer period.
36
Tab
le �
�. In
put o
f K w
ith r
ecyc
led
stra
w a
ccor
ding
to y
ield
and
str
aw m
anag
emen
t pra
ctic
es in
the
prev
ious
sea
son.
Str
aw m
anag
emen
tP
revi
ou
sse
aso
nLo
w-y
ield
ing
seas
on4–
5 t/h
aH
igh-
yiel
ding
sea
son
4–5
t/ha
Sur
face
cut
and
full
stra
w r
emov
al<
�0%
str
aw r
emai
ning
as
stub
ble:
Indi
a, N
epal
, Ban
glad
esh,
N. V
ietn
am
Str
aw K
inpu
t:L
ow
(0–�
t st
raw
rec
ycle
d)
Str
aw K
inpu
t:L
ow
(0–�
t st
raw
rec
ycle
d)
Low
cut
Sho
rt s
tubb
le (
25–3
0 cm
) in
the
field
, no
burn
ing
of th
e w
hole
fiel
d:P
hilip
pine
s
Str
aw K
inpu
t:M
ediu
m(2
–3 t
stra
w r
ecyc
led)
Str
aw K
inpu
t:M
ediu
mt
oh
igh
(3–5
t st
raw
rec
ycle
d)
Hig
h cu
tLo
ng s
tubb
le (
>30
cm
) in
the
field
, no
burn
ing
of th
e w
hole
fiel
d:P
hilip
pine
s, In
done
sia
Str
aw K
inpu
t:M
ediu
mt
oh
igh
(3–4
t st
raw
rec
ycle
d)
Str
aw K
inpu
t:H
igh
(5–7
t st
raw
rec
ycle
d)
Com
bine
har
vest
with
hig
h cu
tLo
ng s
tubb
le p
lus
thre
shed
str
aw in
w
indr
ows
in th
e fie
ld, b
urni
ng o
f the
w
hole
fiel
d:T
haila
nd, S
. Vie
tnam
, nor
ther
n In
dia
Str
aw K
inpu
t:H
igh
(4–5
t st
raw
rec
ycle
d, b
ut
20–2
5% P
and
K lo
sses
be
caus
e of
bur
ning
[P] a
nd
leac
hing
of K
)
Str
aw K
inpu
t:H
igh
(6–8
t st
raw
rec
ycle
d, b
ut
20–2
5% P
and
K lo
sses
be
caus
e of
bur
ning
[P]
and
leac
hing
of K
)

37
✍ Alternatively, consider the following rules of thumb:
8If most of the straw is retained in the field (e.g., after combine harvest) and the nutrient input from manure is small, apply at least 3.5 kg K
2O per ha for each ton of
grain harvested (e.g., �7.5 kg K2O for a yield of 5 t/ha) to
replenish K removed with grain.
Table 12. Maintenance fertilizer K2O rates according to yield target, rice
straw inputs, and K-limited yield in 0 K plots.
3indicates unrealistic yield targets.
Yield target (t/ha) 4 5 6 7 8
Straw inputs
Yield in 0 K plot (t/ha)
Fertilizer K2O rate (kg/ha)
Low (< � t/ha)
3 45 75 �05 3 3
4 30 60 �0 �20 3
5 45 75 �05 �356 60 �0 �207 75 �05
8 �0
Medium (2–3 t/ha)
3 30 60 �0 3 3
4 0 35 65 �5 3
5 20 50 80 ��06 35 65 �57 50 80
8 65
High (4–5 t/ha)
3 30 60 �0 3 3
4 0 30 60 �0 3
5 0 30 60 �06 �0 35 707 25 55
8 40

38
8If straw is fully removed from the field and nutrient input from other sources (manure, water, sediment) is small, apply at least �2 kg K
2O per ha for each ton of
grain harvested (e.g., 60 kg K2O for a yield of 5 t/ha) to
replenish K removed with grain and straw.
✍ In the short term, fertilizer K application would not theoretically be required if a yield response is not expected for the selected yield target (i.e., if yield target = yield in 0 K plot). This strategy results in mining of soil K reserves and may affect yields in the medium to long term, especially if other nutrient sources such as straw or manure are not applied.
✍ Small applications of potassium fertilizer can be made early before �4 DAT or 2� DAS. Larger applications (40–�20 kg K
2O per ha) should be made in two splits (50% at
early application and 50% at panicle initiation, PI). Large applications (>120 kg K
2O per ha) should be made in
three splits (1/3 early, 1/3 at PI, and 1/3 at heading to first flowering).
1.9Managingorganicmanures,straw,andgreenmanure
Wherever possible, nutrient sources such as farmyard manure, straw, and green manure should be used in combination with mineral fertilizers to provide part of the rice crop’s nutrient requirements and to sustain soil quality in the long run. Straw is the only major organic material available to most rice farmers. About 40% of the N, 30–35% of the P, 80–85% of the K, and 40–50% of the S taken up by rice remains in the straw and stubble at crop maturity. In many areas, however, organic manure is not available in sufficient quantity to balance nutrient removal, and organic manure use is more costly than the application of equivalent amounts of nutrients as mineral fertilizer.

3�
It is important to understand the fundamental differences in decomposition patterns of organic inputs and the role of organic matter (OM) in different rice-cropping systems:
4In rice-nonrice crop systems (e.g., rice-wheat rotations) or rainfed lowland or upland rice systems: longer aerobic periods cause a more rapid and complete turnover of organic matter. This may result in a decrease in soil OM content with negative effects on “physical” soil quality under upland conditions (e.g., reduced water-holding capacity, structure, water percolation, biological activity, and P availability).
4In intensive rice-rice(-rice) systems: residues decompose mainly under anaerobic flooded conditions, leading to more stable, well-conserved organic matter. Maintaining “physical” soil quality is less critical because the soil structure is destroyed deliberately by puddling at land preparation. The role of OM is reduced to its direct and indirect effects on nutrient supply. Occasionally, OM has negative effects on crop growth by promoting mineral deficiencies (e.g., Zn) or toxicities (e.g., Fe, sulfide) and poor root health.
Straw management and tillage
4Incorporation of stubble and straw into the soil returns most of the nutrients taken up by the crop (see Table �4) and helps to conserve soil nutrient reserves in the long term. Short-term effects on grain yield are often small (compared with straw removal or burning), but long-term benefits are significant. Where mineral fertilizers are used and straw is incorporated, reserves of soil N, P, K, and Si are maintained or even increased. Incorporation of straw and stubble when wet soil is plowed results in a temporary immobilization of N and transplanting should be carried out 2–3 wk after straw incorporation; alternatively, urea N should be applied along with straw.
40
4Burning results in the loss of almost all the N content, P losses of about 25%, indirect K losses of 20% because of leaching, and S losses of 5–60%. Where S-free mineral fertilizers are used, straw may be an important source of S and thus straw burning should not be practiced. In contrast, burning effectively transforms straw into a mineral K nutrient source and only a small amount of K is lost in the process. Spread the straw uniformly in the field to avoid creating “nutrient hot spots.”
4The effect of straw removal on long-term soil fertility is much greater for K than for P (Table �). Straw spreading and incorporation, however, are labor-intensive and farmers consider burning to be more expedient. Straw is also an important source of micronutrients (Zn) and the most important influence on the cumulative Si balance in rice (Section 2.6).
4Early, dry shallow tillage (5–�0 cm depth) to incorporate crop residues and enhance soil aeration during fallow periods increases N availability up to the vegetative growth phase of the succeeding rice crop. Shallow tillage of dry soil requires a 4-wheel tractor and should be carried out up to 2–3 wk after harvest in cropping systems where the dry-moist fallow period between two crops is at least 30 d. However, additional fuel and labor costs must be considered in an economic analysis.
4Increase the indigenous N-supplying power of permanently submerged soils by periodic drainage and drying. An example is midseason drainage of 5–7 d at the late tillering stage (about 35 d after planting).
Management of other organic materials4Organic manures differ widely in their composition and
effect on soil fertility and nutrient supply (Table �3). Where they are available, apply 2–�0 t/ha (or more) of farmyard manure (FYM) or other available organic materials (crop

4�
residues, compost) on soils containing a small amount of organic matter, particularly in rainfed lowland rice and intensive irrigated rice systems where rice is rotated with other upland crops such as wheat or maize. Avoid large organic matter inputs shortly before crop establishment.
4Many green manure legumes such as the fast-growing, short-duration, stem-nodulating sesbania (Sesbania rostrata) can accumulate N rapidly (80–100 kg N per ha in 45–60 d of growth). Most of the N (about 80%) is derived from biological N
2 fixation. Green manures decompose rapidly
when incorporated in the soil and may provide a substitute for fertilizer N applications, especially during vegetative growth. Use a leaf color chart to decide on the need to apply additional fertilizer N. Green manures may improve soil
Table �3. Typical nutrient contents of organic materials.
a kg nutrient per t fresh manure = % nutrient content × �0
Organic materialaWater C N P K Ca
(%) (% of fresh material)
Human feces �.0 0.2 0.3
Cattle feces 0.3 0.� 0.�
Pig feces 0.5 0.2 0.4
Fresh cattle manure
60 8–�0 0.4–0.6 0.�–0.2 0.4–0.6 0.2–0.4
Composted cattle manure
35 30–35 �.5 �.2 2.� 2.0
Pig manure 80 5–�0 0.7–�.0 0.2–0.3 0.5–0.7 �.2
Poultry manure 55 �5 �.4–�.6 0.5–0.8 0.7–0.8 2.3
Garbage compost 40 �6 0.6 0.2 0.3 �.�
Sewage sludge 50 �7 �.6 0.8 0.2 �.6
Sugarcane filter cake
75–80 8 0.3 0.2 0.� 0.5
Castor bean cake �0 45 4.5 0.7 �.� �.8

42
physical properties, but have little potential for increasing soil organic matter over time. Green manuring is effective in accelerating the reclamation of saline and sodic soils.
4Grow catch crops (legumes, other green manures, managed weeds) in fallow periods of rice-nonrice rotations to conserve N and produce additional organic matter and income (grain legumes) if soil moisture and farm economics allow.
1.10Evaluationofstrategiesforwider-scaledissemination
Evaluate each newly developed nutrient management strategy in plots of at least 500–�,000 m2 embedded in farmers’ fields.
4Consider two demonstration plots if more than one factor was changed to demonstrate the contribution of each factor to yield (e.g., demonstrate the effect of improved seed quality in one demonstration plot and improved seed quality plus improved nutrient management in a second plot).
4Measure grain yield and monitor fertilizer use.
4Refine the recommendations after on-farm participatory evaluation and gross margin analysis before dissemination at a larger scale. Identify non-nutrient-related constraints encountered during implementation.
4Develop extension material such as posters or a one-page handout for farmers and extension staff containing season-specific “golden rules” on nutrient and crop management (e.g., variety, seedling age, planting density, land leveling, fertilizer N, P, and K recommendations, use of LCC, etc.).
What if the yield target is not achieved?
4If the yield target is not achieved (actual yield <80% of yield target), try to eliminate other constraints. Site-specific

43
nutrient management has been proved to increase yields even on farms where nutrient-use efficiency was poor because of general crop management problems (water, weeds, etc.). Lowering the yield target and reducing inputs to increase nutrient efficiencies under such conditions may lead to a further reduction in actual yield and profit. To increase yield and profit, other constraints should be identified and eliminated first.
4Lowering the yield target (and reducing inputs) is recommended if the current high level of nutrient (mostly N) inputs is associated with a high risk of crop failure caused by increased pest pressure or lodging.
1.11UsefulnumbersUseful numbers for calculating the average nutrient removal with grain and straw are given in this section (Table �4). Conversion factors for nutrients are also included (Table �5).
Table �4. Average nutrient removal of modern irrigated rice varieties and mineral concentrations in grain and straw.
N P K nZ S iS
)dleiyniargt/gk(warts+niarghtiwlavomertneirtunlatoT
5.7� 0.3 0.7� 50.0 8.� 08
)dleiyniargt/niargnitneirtungk(niarghtiwlavomertneirtuN
5.0� 0.2 5.2 20.0 0.� 5�
)dleiyniargt/wartsnitneirtungk(wartshtiwlavomertneirtuN
0.7 0.� 5.4� 30.0 8.0 56
)%(niargnitnetnoclareniM
0�.� 02.0 �2.0 200.0 00�.0 0.2
)%(wartsnitnetnoclareniM
56.0 0�.0 04.� 300.0 570.0 5.5
gM aC eF nM uC B
)dleiyniargt/gk(warts+niarghtiwlavomertneirtunlatoT
5.3 0.4 05.0 05.0 2�0.0 5�0.0
)dleiyniargt/niargnitneirtungk(niarghtiwlavomertneirtuN
5.� 5.0 02.0 50.0 �00.0 500.0
)dleiyniargt/wartsnitneirtungk(wartshtiwlavomertneirtuN
0.2 5.3 03.0 54.0 300.0 0�0.0
)%(niargnitnetnoclareniM
5�.0 50.0 520.0 500.0 0�00.0 500.0
)%(wartsnitnetnoclareniM
02.0 03.0 530.0 540.0 3000.0 0�00.0

44
Table �4 (continued.)
N P K nZ S iS
)dleiyniargt/gk(warts+niarghtiwlavomertneirtunlatoT
5.7� 0.3 0.7� 50.0 8.� 08
)dleiyniargt/niargnitneirtungk(niarghtiwlavomertneirtuN
5.0� 0.2 5.2 20.0 0.� 5�
)dleiyniargt/wartsnitneirtungk(wartshtiwlavomertneirtuN
0.7 0.� 5.4� 30.0 8.0 56
)%(niargnitnetnoclareniM
0�.� 02.0 �2.0 200.0 00�.0 0.2
)%(wartsnitnetnoclareniM
56.0 0�.0 04.� 300.0 570.0 5.5
gM aC eF nM uC B
)dleiyniargt/gk(warts+niarghtiwlavomertneirtunlatoT
5.3 0.4 05.0 05.0 2�0.0 5�0.0
)dleiyniargt/niargnitneirtungk(niarghtiwlavomertneirtuN
5.� 5.0 02.0 50.0 �00.0 500.0
)dleiyniargt/wartsnitneirtungk(wartshtiwlavomertneirtuN
0.2 5.3 03.0 54.0 300.0 0�0.0
)%(niargnitnetnoclareniM
5�.0 50.0 520.0 500.0 0�00.0 500.0
)%(wartsnitnetnoclareniM
02.0 03.0 530.0 540.0 3000.0 0�00.0
Table �5. Conversion factors for nutrients.
From multiply by to get/ From multiply by to get
NO3
-0.226 N 4.426 NO
3
-
NH3
0.823 N �.2�6 NH3
NH4
+0.777 N �.288 NH
4
+
CO(NH2)
2 -urea 0.467 N 2.�43 CO(NH
2)
2 -urea
(NH4)
2SO
40.2�2 N 4.7�6 (NH
4)
2SO
4
NH4NO
30.350 N 2.857 NH
4NO
3
P2O
50.436 P 2.2�2 P
2O
5
Ca3(PO
4)
20.458 P
2O
52.�85 Ca
3(PO
4)
2
K2O 0.830 K �.205 K
2O
KCl 0.632 K2O �.583 KCl
KCl 0.524 K �.�07 KCl
ZnSO4 •
H
2O 0.364 Zn 2.745 ZnSO
4 •
H
2O
ZnSO4 •
7H
2O 0.227 Zn 4.3�8 ZnSO
4 •
7H
2O
SO2
0.500 S �.��8 SO2
SO4
2-0.334 S 2.��6 SO
4
2-

45
From multiply by to get/ From multiply by to get
MgSO4
0.266 S 3.754 MgSO4
MgSO4 •
H
2O 0.232 S 4.3�6 MgSO
4 •
H
2O
MgSO4 •
7H
2O 0.�30 S 7.688 MgSO
4 •
7H
2O
(NH4)
2SO
40.243 S 4.�2� (NH
4)
2SO
4
SiO2
0.468 Si 2.�3� SiO2
CaSiO3
0.242 Si 4.�35 CaSiO3
MgSiO3
0.280 Si 3.574 MgSiO3
MgO 0.603 Mg �.658 MgO
MgO 2.�87 MgSO4
0.355 MgO
MgO 3.434 MgSO4 •
H
2O 0.2�� MgO
MgO 6.��6 MgSO4 •
7H
2O 0.�64 MgO
MgO 2.0�2 MgCO3
0.478 MgO
CaO 0.7�5 Ca �.3�� CaO
CaCO3
0.560 CaO �.785 CaCO3
CaCl2
0.358 Ca 2.7�4 CaCl2
CaSO4
0.2�4 Ca 3.3�7 CaSO4
Ca3(PO
4)
20.388 Ca 2.580 Ca
3(PO
4)
2
FeSO4
0.368 Fe 2.720 FeSO4
MnSO4
0.364 Mn 2.748 MnSO4
MnCl2
0.437 Mn 2.0�0 MnCl2
MnCO3
0.478 Mn 2.0�2 MnCO3
MnO2
0.632 Mn �.582 MnO2
CuSO4 •
H
2O 0.358 Cu 2.7�5 CuSO
4 •
H
2O
CuSO4 •
5H
2O 0.255 Cu 3.�3� CuSO
4 •
5H
2O
Na2B
4O
7 •
5H
2O 0.�38 B 7.246 Na
2B
4O
7 •
5H
2O
Na2B
4O
7 •
7H
2O 0.�23 B 8.�30 Na
2B
4O
7 •
7H
2O
B 3.230 B2O
30.3�0 B
Table �5 (continued.)