1 news colmar brunton poll€¦ · mobile: random dialling of new zealand mobile telephones using...
TRANSCRIPT

1 NEWS Colmar Brunton Poll
19-23 May 2018
Attention: Television New Zealand
Contact: (04) 913-3000
Release date: 28 May 2018
Level One
46 Sale Street, Auckland CBD PO Box 33690 Takapuna
Auckland 0740 Ph: (09) 919-9200
Level 9, Legal House
101 Lambton Quay PO Box 3622, Wellington 6011
Ph: (04) 913-3000
www.colmarbrunton.co.nz

1 NEWS Colmar Brunton Poll - Page 1
‹#›
Contents
Contents .......................................................................................................................................................... 1
Methodology summary ................................................................................................................................... 2
Summary of results .......................................................................................................................................... 3
Key political events .......................................................................................................................................... 4
Question order and wording ............................................................................................................................ 5
Party vote ........................................................................................................................................................ 6
Preferred Prime Minister ................................................................................................................................. 8
Economic outlook .......................................................................................................................................... 10
Government’s management and delivery of the Budget ................................................................................ 12
Government’s management of the Mycoplasma bovis outbreak ................................................................... 13
Support for a national fuel tax to fund roads and public transport ................................................................ 14
Winston Peters as Acting Prime Minister ....................................................................................................... 15
Parliamentary seat entitlement ..................................................................................................................... 16
Method for calculating parliamentary seat entitlement ................................................................................ 16

1 NEWS Colmar Brunton Poll - Page 2
‹#›
Methodology summary
CLIENT: Television New Zealand.
RELEASED: Monday 28 May 2018.
POLL CONDUCTED: Interviewing took place from Saturday 19 – Wednesday 23 May 2018.
MEDIAN FIELDWORK DAY: Sunday (50% of sample size target was reached on this day).
TARGET POPULATION: Eligible New Zealand voters.
SAMPLE POPULATION: Eligible New Zealand voters who live in New Zealand households that have a landline
telephone or have access to a New Zealand mobile phone.
SAMPLE SELECTION: Landline: Nationwide random digit dialling of landline telephones using stratified
probability sampling to ensure the sample includes the correct proportion of people
in urban and rural areas. Interviewers ask to speak to the person in each household
aged 18 years or over with the next birthday. When required, multiple calls are
made to reach that person. Voting eligibility is determined at the first question.
Mobile: Random dialling of New Zealand mobile telephones using probability
sampling. Interviewers ask to speak to the main user of the phone who is aged 18
years or over. When required, multiple calls are made to reach that person. Voting
eligibility is determined at the first question.
SAMPLE SIZE: n = 1,007 eligible voters, including n=504 polled via landline phone and n=503 polled
via mobile phone.
SAMPLING ERROR: The maximum sampling error is approximately ±3.1%-points at the 95% confidence
level. This is the sampling error for a result around 50%. Results higher and lower
than 50% have a smaller sampling error. For example, results around 10% and 5%
have sampling errors of approximately ±1.9%-points and ±1.4%-points, respectively,
at the 95% confidence level.
These sampling errors assume a simple random sample of 1,000 eligible voters.
INTERVIEW METHOD: Conducted by CATI (Computer Assisted Telephone Interviewing).
WEIGHTING: The data have been weighted to align with Statistics New Zealand population counts
for age, gender, region, ethnic identification, and mobile or landline access.
REPORTED FIGURES: Reported bases are unweighted. For Party Support, percentages have been rounded
up or down to whole numbers, except those less than 5%, which are reported to 1
decimal place. For all other figures percentages have been rounded up or down to
whole numbers except those less than 1%, which are reported to 1 decimal place.
All sub-group differences listed for supplementary questions are statistically
significant at the 95% confidence level.
METHODOLOGY NOTES: The party vote question has been asked unprompted since February 1997.
Note: The data does not take into account the effects of non-voting and therefore cannot be used to predict the
outcome of an election. Undecided voters, non-voters and those who refused to answer are excluded from the
data on party support. The results are therefore only indicative of trends in party support, and it would be
misleading to report otherwise.
This poll was conducted in accordance with the New Zealand Political Polling Code. Publication or reproduction
of the results must be acknowledged as the “1 NEWS Colmar Brunton Poll”.
1 NEWS Colmar Brunton Poll - Page 3
‹#›
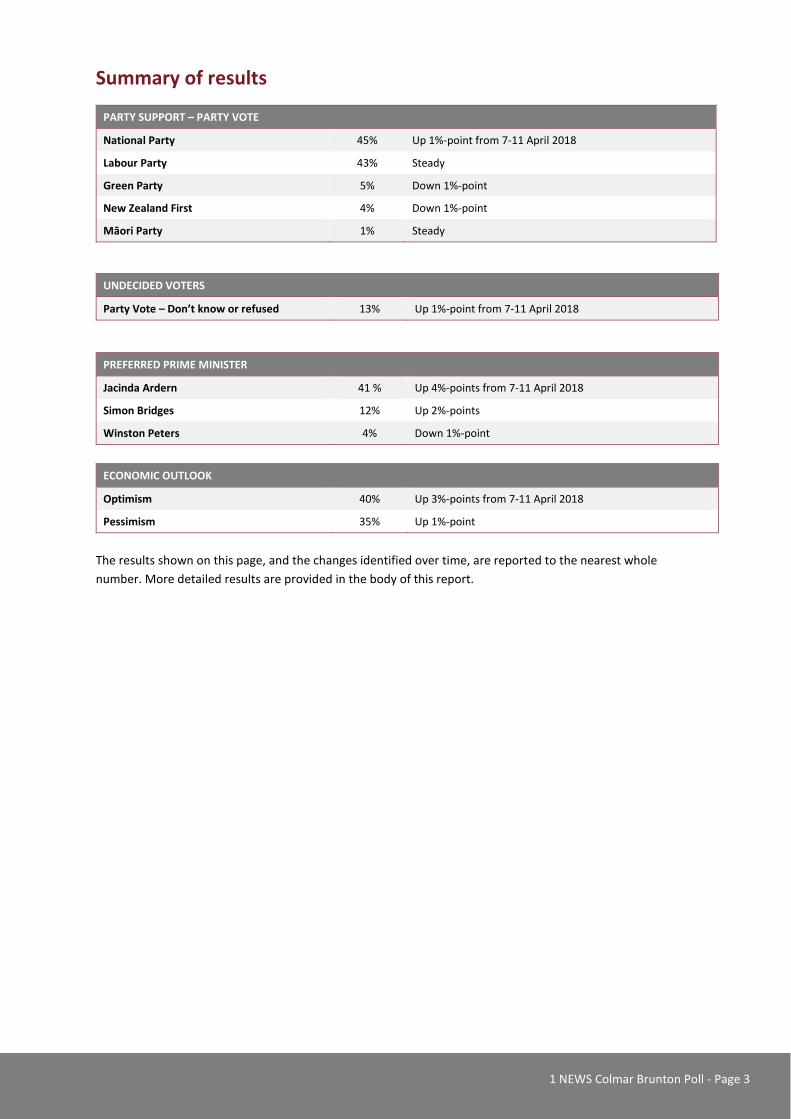
Summary of results
PARTY SUPPORT – PARTY VOTE
National Party 45% Up 1%-point from 7-11 April 2018
Labour Party 43% Steady
Green Party 5% Down 1%-point
New Zealand First 4% Down 1%-point
Māori Party 1% Steady
UNDECIDED VOTERS
Party Vote – Don’t know or refused 13% Up 1%-point from 7-11 April 2018
PREFERRED PRIME MINISTER
Jacinda Ardern 41 % Up 4%-points from 7-11 April 2018
Simon Bridges 12% Up 2%-points
Winston Peters 4% Down 1%-point
ECONOMIC OUTLOOK
Optimism 40% Up 3%-points from 7-11 April 2018
Pessimism 35% Up 1%-point
The results shown on this page, and the changes identified over time, are reported to the nearest whole
number. More detailed results are provided in the body of this report.

1 NEWS Colmar Brunton Poll - Page 4
‹#›
Key political events
9 – 23 May 2018
The Government released the 2018 Budget, which included $750m for urgent hospital building needs, $200m for pop-up prison cells, and $270m for Oranga Tamariki over the next four years.
Climate Change Minister and Green Party co-leader James Shaw touted the Budget as “the greenest Budget ever”, with over $600m being invested into environment-focused projects.
The Israeli Embassy said it was regrettable that the Government did not condemn Hamas, after 50 people were killed in Gaza following protesting the move of the US Embassy from Tel Aviv to Jerusalem.
Prime Minister Jacinda Ardern later announced that the costs of the Mycoplasma bovis (a disease affecting cattle) crisis are estimated to be more than the $85m allocated.
Finance Minister Grant Robertson said he was investigating the establishment of a new EQC-like fund for biosecurity, to which farmers could be asked to contribute.
The Government abandoned plans for a mega-prison near Te Awamutu. Corrections Minister Kelvin Davis said he would be working with Minister of Justice Andrew Little and Police Minister Stuart Nash to come up with an alternative solution to address low prison capacity.
Fuel prices rose to new highs, and the Government has said they do not plan to back down on the proposed fuel taxes, such as the 11.5c per litre Auckland tax, coming into effect from July 1.
Prime Minister Jacinda Ardern outlined Winston Peters’ duties as Acting Prime Minister ahead of her six weeks of maternity leave, stating that she will continue to receive Cabinet and Cabinet committee papers, but that he will oversee the day-to-day running of the government.

1 NEWS Colmar Brunton Poll - Page 5
‹#›
Question order and wording
Voting eligibility
“If a general election was held today, would you be eligible to vote?”
NOTE: Those not eligible to vote are excluded from the total sample size for this poll.
Likelihood to vote
“If a general election was held today, how likely would you be to vote?”
NOTE: Those claiming they would be ‘quite likely’ or ‘very likely’ to vote have been included in the party
support analysis.
Introduction
“Under MMP you get two votes.
One is for a political party and is called a party vote.
The other is for your local MP and is called an electorate vote.”
Party vote
“Firstly thinking about the Party Vote which is for a political party.
Which political party would you vote for?”
IF DON’T KNOW
“Which one would you be most likely to vote for?”
Preferred Prime Minister
“Thinking about all current MPs of any party, which one would you personally prefer to be Prime Minister?”
IF NO ONE
“Is there anyone who is not a current MP who you would prefer to be Prime Minister?”
Economic outlook
“And do you think during the next 12 months the economy will be in a better state than at present, or in a
worse state?”

1 NEWS Colmar Brunton Poll - Page 6
‹#›
Party vote
“Which political party would you vote for?”
IF DON’T KNOW
“Which one would you be most likely to vote for?”
9-13 Sep
2017 16-19 Sep
2017 29 Nov-5 Dec 2017
10-14 Feb 2018
7-11 Apr 2018
19-23 May 2018
Don’t know 10% 7% 6% 9% 8% 9%
Refused 5% 6% 4% 4% 4% 4%
TOTAL 14%* 13% 10% 13% 12% 13%
Base (n=) 1,006 1,006 1,007 1,007 1,007 1,007
Based on eligible New Zealand voters. *Percentages do not add to total due to rounding
9-13 Sep
2017 16-19 Sep
2017 29 Nov-5 Dec 2017
10-14 Feb 2018
7-11 Apr 2018
19-23 May 2018
National Party 40% 46% 46% 43% 44% 45%
Labour Party 44% 37% 39% 48% 43% 43%
Green Party 7% 8% 7% 5% 6% 5%
New Zealand First 6% 4.9% 5% 2.6% 5% 4.2%
Māori Party 0.9% 0.5% 0.9% 0.7% 1.2% 0.9%
ACT Party 0.6% 0.3% 0.1% 0.5% 0.3% 0.7%
The Opportunities Party
1.6% 2.3% 1.2% 0.6% 0.4% 0.5%
Other 0.6% 0.4% 0.3% 0.2% 0.8% 0.7%
TOTAL 100%* 100%* 100%* 100%* 100%* 100%
Base (n=) 840 838 874 822 861 839
Based on probed party supporters. *Percentages do not add to total due to rounding.

0%
10%
20%
30%
40%
50%
60%
2009 2010 2011 2012 2013 2014 2015 2016 2017 2018
National Labour NZ First Green
1 NEWS Colmar Brunton PollParty Vote
National
Labour
GreenNZ First
Note: Line markers indicate significant differences from the previous poll at the 95% confidence level, and error bars display the 95% confidence interval for each National, Labour, Green and NZ First Party result. Error bars and markers are not displayed for other parties because they would be indistinguishable on the chart. Significance testing carried out back to the 2011 general Election. Results up to the end of September 2017 were obtained via landline-only sampling.

1 NEWS Colmar Brunton Poll - Page 8
‹#›
Preferred Prime Minister
“Now thinking about all current MPs of any party, which one would you personally prefer to be Prime
Minister?” IF NO ONE: “Is there anyone who is not a current MP who you would prefer to be Prime Minister?”
9-13 Sep
2017 16-19 Sep
2017 30 Nov-5 Dec 2017
10-14 Feb 2018
7-11 Apr 2018
19-23 May 2018
Jacinda Ardern 34% 31% 37% 41% 37% 41%
Simon Bridges - <0.1% 0.3% 1% 10% 12%
Winston Peters 5% 6% 5% 4% 5% 4%
Judith Collins - - 0.7% 0.4% 2% 2%
Bill English 32% 37% 28% 20% 2% 0.9%
John Key 0.6% 0.7% 2% 1% 1% 0.9%
Amy Adams - - - 0.4% 0.8% 0.5%
Steven Joyce <0.1% 0.1% 0.3% 0.4% 0.5% 0.4%
Paula Bennett - 0.2% 0.4% 0.3% 0.2% 0.3%
David Parker - - - - - 0.2%
Mark Mitchell - - - - 0.2% 0.2%
Helen Clark 0.2% - 0.2% 0.1% 0.2% 0.2%
James Shaw 0.3% 0.3% 0.4% 0.4% - 0.2%
David Seymour - 0.1% - 0.1% 0.3% 0.1%
Grant Robertson 0.4% 0.1% - - - 0.1%
Andrew Little - - 0.1% <0.1% - 0.1%
Gerry Brownlee 0.2% - 0.1% - <0.1% 0.1%
Gareth Morgan 0.3% 0.2% 0.4% 0.2% - <0.1%
Marama Davidson - - - - 0.4% -
Shane Jones - - <0.1% 0.1% 0.2% -
Kelvin Davis 0.1% - 0.2% - 0.1% -
Phil Goff - - 0.2% - 0.1% -
Te Ururoa Flavell - <0.1% 0.2% - - -
Hone Harawira - 0.3% - - - -
Trevor Mallard - 0.1% - - - -
Metiria Turei 0.2% 0.1% - - - -
Other 1% 2% 2% 0.9% 2% 1%
Don’t know 22% 18% 19% 27% 32% 31%
None 1% 1% 2% 2% 3% 2%
Refused 3% 3% 2% 1% 1% 1%
TOTAL 100%* 100%* 100%* 100%* 100%* 100%*
Base (n=) 1,006 1,006 1,007 1,007 1,007 1,007
Based on eligible New Zealand voters. *Percentages do not add to total due to rounding.

1 NEWS Colmar Brunton PollPreferred Prime Minister
0%
10%
20%
30%
40%
50%
60%
2009 2010 2011 2012 2013 2014 2015 2016 2017 2018
Bill English Jacinda Ardern Winston Peters Andrew Little John Key
David Cunliffe David Shearer Phil Goff Simon Bridges

1 NEWS Colmar Brunton Poll - Page 10
‹#›
Economic outlook
“And do you think during the next 12 months the economy will be in a better state than at present, or in a
worse state?”
9-13 Sep
2017 16-19 Sep
2017 30 Nov-5 Dec
2017 10-14 Feb
2018 7-11 Apr
2018 19-23 May
2018
Better 53% 55% 36% 37% 37% 40%
Same 36% 35% 28% 30% 29% 25%
Worse 11% 10% 36% 33% 34% 35%
TOTAL 100% 100% 100% 100% 100% 100%
Base (n=) 1,006 1,006 1,007 1,007 1,007 1,007
Based on eligible New Zealand voters.

1 NEWS Colmar Brunton PollEconomic Outlook
0%
10%
20%
30%
40%
50%
60%
70%
80%
90%
100%
2009 2010 2011 2012 2013 2014 2015 2016 2017 2018
Better Worse

1 NEWS Colmar Brunton Poll - Page 12
‹#›
Government’s management and delivery of the Budget
“On Thursday, the Government released the Budget. How did the Government’s management and delivery of
the Budget compare to your expectations?”
Total Eligible New
Zealand Voters
Better than my expectations1 9%
About the same as my expectations 56%
Worse than my expectations 11%
Did not have any expectations 2%
Don’t know / Unaware of the Budget 21%
Total 100%*
Base (n=) 1,007
Based on eligible New Zealand voters. *Percentages do not add to total due to rounding
The majority of eligible New Zealand voters feel the Government’s management and delivery of the Budget
met their expectations (56%). The remainder are split; 11% feel the Government’s handling was worse than
they expected, whilst 9% of voters’ expectations were exceeded. A further 21% don’t know or are unaware of
the Budget announcement, and 2% did not have any expectations to begin with.
National party supporters (18%) are more likely than average (11%) to say the Government’s handling of the Budget was worse than they expected.
Labour party supporters (14%) are more likely than average (9%) to feel that their expectations were exceeded.
1 Half of respondents were read “Better” first, and half were read “Worse” first. “About the same” was always read second.

1 NEWS Colmar Brunton Poll - Page 13
‹#›
Government’s management of the Mycoplasma bovis outbreak
“How would you rate the Government’s management of the current outbreak of Mycoplasma bovis? This is a
disease which affects cattle. Would you describe the Government’s management as…?
Total Eligible New
Zealand Voters
Good2 14%
Okay 42%
Poor 24%
Don’t know 20%
Total 100%
Base (n=) 1,007
Based on eligible New Zealand voters.
On balance, eligible New Zealand voters think the Government’s management of the Mycoplasma bovis
outbreak has been satisfactory. They are most likely to rate the Government’s management as “okay” (42%),
and a further 14% rate it as “good”. A minority of voters (24%) are critical of the Government’s response,
leaving 20% who don’t know.
Labour party supporters (19%) are more likely than average (14%) to think the Government’s management of
the outbreak has been “good”.
Those groups of eligible New Zealand voters more likely than average (24%) to say the Government’s
management has been “poor” include:
National party supporters (37%)
Those aged 55 and over (30%).
2 Half of respondents were read “Good” first, and half were read “Poor” first. “Okay” was always read second.

1 NEWS Colmar Brunton Poll - Page 14
‹#›
Support for a national fuel tax to fund roads and public transport
“The Government is looking to introduce a national fuel tax of between 9 and 12 cents a litre to provide extra
funding for roads and public transport. Do you support or oppose3 this idea?”
Total Eligible New
Zealand Voters
Support 36%
Oppose 58%
Don’t know 6%
Total 100%
Base (n=) 1,007
Based on eligible New Zealand voters.
The majority of New Zealand voters oppose the introduction of a fuel tax to fund roads and public transport.
This compares to 36% who support it. The remaining 6% don’t know.
National party supporters (71%) are more likely than average (58%) to oppose the introduction of a national
fuel tax (71%).
Those groups of eligible New Zealand voters more likely than average (36%) to support a fuel tax include:
Green party supporters (61%)
Labour party supporters (46%)
Those living in households earning more than $100,000 annually (43%).
3 The question was rotated so 50% of respondents were read “oppose or support”.

1 NEWS Colmar Brunton Poll - Page 15
‹#›
Winston Peters as Acting Prime Minister
“Prime Minister Jacinda Ardern will take six weeks maternity leave, during which time Deputy Prime Minister
Winston Peters will become the Acting Prime Minister. Do you think Winston Peters will do…?”
Total Eligible New Zealand Voters
19-23 May
2018
Total Eligible New Zealand Voters
10-14 February 2018
A good job4 32% 34%
An okay job 53% 50%
A bad job 11% 11%
Don’t know 4% 5%
Total 100% 100%
Base (n=) 1,007 1,007
Based on eligible New Zealand voters.
New Zealand voters’ expectations about Winston Peters’ performance as Acting Prime Minister are unchanged
from earlier in the year. About half (53%) think he will do “an okay job”. The remainder are more likely to say
he will do “a good job” (32%) than “a bad job” (11%), leaving 4% who don’t know.
Those groups of eligible New Zealand voters more likely than average (32%) to believe he will do “a good job”
include:
Pacific peoples (51%)
Labour party supporters (49%)
Māori (45%).
National party supporters (23%) are more likely than average (11%) to believe he will do “a bad job”.
4 Half of respondents were read “good” first, and half were read “bad” first. “Okay” was always read second.

1 NEWS Colmar Brunton Poll - Page 16
‹#›
Parliamentary seat entitlement
The following table shows the parliamentary seat entitlement according to the results reported in this poll.
The table assumes ACT wins one electorate seat.
Number of seats
National Party
58
Labour Party
55
Green Party
6
ACT Party
1
TOTAL
120
Method for calculating parliamentary seat entitlement
The St Laguë method is used by the Chief Electoral Officer at election time to convert the number of votes for
each party into the number of seats they get in Parliament.
It is applied to all the parties which are eligible, either by exceeding the 5% threshold or by winning at least
one electorate seat. More information about the St Laguë method can be obtained directly from the Electoral
Commission.