1. new methodology to optimize sorting in wood drying.pdf
TRANSCRIPT

79
ISSN impresa 0717-3644ISSN online 0718-221X
maderas CIENCIA Y TECNOLOGIA, 12(2):79-91, 2010
♣ This paper was originally presented at the 11 Iufro Wood Drying Conference, Skelleftea-Sweden, January 2010, and has been updated.
1FPInnovations - Forintek, Research Scientist 2665 East Mall, Vancouver, British Columbia, V6T 1W5, Canada. e-mail: [email protected] - Forintek, Group Leader 2665 East Mall, Vancouver, British Columbia, V6T 1W5, Canada. e-mail: [email protected] of British Columbia, Department of Wood Science,2424 Main Mall, Vancouver, British Columbia, V6T 2G8. Canada. e-mail: [email protected] Author: [email protected]: 31.03.2010 Accepted: 03.06.2010.
New methodology to oPtImIze SortINg IN wood dryINg♣
D.M. Elustondo1, L. Oliveira2, S. Avramidis3
ABSTRACT
One important problem in lumber drying is to maintain the lumber moisture content distribution within certain minimum and maximum values. Over-drying and under-drying are common causes for lower grade recovery and dimensional stability problems. It is known that both over-drying and under-drying can be reduced by sorting green lumber into different moisture content groups and sorting also offers the opportunity to redesign drying schedules. In this study, a new methodology was designed and tested to optimize kiln drying of lumber by implementing green sorting coupled with modified drying schedules. The methodology was applied to optimize the drying of 114 by 114mm2 hem-fir lumber sorted with an NMI capacitance type meter at a local sawmill. It was found that in comparison to unsorted lumber, sorting into three groups can reduce the drying time by 7% approximately and recover around 3/4 of the under-dried lumber. The experimental data on lumber degrade and moisture gradients measured after drying were also reported in this paper.Keywords: Drying, Lumber, Sorting, Optimization
INTRODUCTION
Probably, one of the most important factors affecting lumber value is moisture content (MC) variability after drying. In theory, dimensionally stable lumber suitable for wood-frame construction should have a uniform MC that is in equilibrium with the environmental conditions. In industry however, lumber is dried in large batch kilns containing thousand of boards with different dry-ability characteristics. As a result, final MC of individual boards after drying usually ranges between 5% and 25% with an average of 15%.
This MC variability among boards has a huge impact on the monetary value of the dried lumber. Pieces with MC much lower than the average have a lower value because over-drying promotes shrinkage and distortion, and pieces with MC much higher than the average have a lower value because they are still wet for structural purposes. Therefore, trying to optimize value in lumber drying creates a dilemma for the kiln operator. As drying proceeds, the wets reduce and the over-dried pieces increase, consequently it is impossible in practice to reduce losses in the wet side of the MC distribution without increasing losses in the dry side. To illustrate how monetary losses are affected by the lumber average MC, Figure 1 shows the results of a drying study performed by the University of British Columbia (Elustondo et al. 2005).
A similar result was obtained by Milota and Wu (1997). In that study, it was found that the value of dried white fir reduced $3.23/Mfbm for each percent of MC decrease (Mfbm = 2.36 m3 is the standard unit of volume used for lumber in North America). Reducing final MC variability is therefore a priority in kiln drying, and it can be partially achieved in industry by implementing lumber sorting. Lumber sorting before drying is a very common practice in the lumber manufacturing industry, and it
DOI 10.4067/S0718-221X2010000200003

80
U n i v e r s i d a d d e l B í o - B í omaderas CIENCIA Y TECNOLOGIA, 12(2):79-91, 2010
creates groups of lumber with similar “dry-ability” characteristics. Other methods to reduce final MC variation that are not addressed in this study are re-drying of wets after drying (Berry 1969, Bassett 1973, Elustondo et al. 2005, Milota and Wu 1997), and adding equalization or conditioning at the end of the drying schedule. Equalization and conditioning are common in lumber drying and the fundamentals are explained in kiln manuals such as Simpson (1991).
Figure 1: Example of $ value loss as function of the lumber average MC (Mfbm = 2.36 m3)
Lumber sorting has been extensively studied at the laboratory level (Kozlik and Ward 1981, Holmes and Arganbright 1984, Kozlik 1987, Yichun et al. 1996, Wallace et al. 2003, Avramidis et al. 2004, Sugimori et al. 2006). At the theoretical level, stochastic models were developed to take into consideration the lumber natural MC variability (Cronin et al. 2002, Cronin et al. 2003; Kayihan 1984, Kayihan 1985, Elustondo et al. 2004, Elustondo et al. 2005, Elustondo and Avramidis 2003). In the study presented in this paper, lumber sorting was optimized by using experimental laboratory results combined with numerical regression and stochastic simulation. The methodology was applied to minimize drying time and MC variation in drying of 114 by 114 mm2 hem-fir (Pacific coast hemlock) lumber sorted with an in-line capacitance type MC-meter. The optimized sorting strategy was then implemented at a local sawmill to confirm the predicted benefits.
MATERIALS AND METHODS
Optimization of sorting parameters Timber sorting was performed at a local sawmill in British Columbia, Canada, with the help of an in-line NMI (Northern Milltech Inc., MC Pro 1500, DOS version) sorting equipment. Figure 2 shows a photograph of the used NMI. NMI is a commercial capacitance type MC meter designed to sort green lumber before drying. It uses 4 to 8 sets of two metallic plates placed above and below the wood to measure electric capacitance as the wood passes transversally at line speeds. Since electric capacity is affected by both MC and density, the NMI value is similar, but not necessarily equal to the lumber MC.
It is reported in literature that the electric capacitance of dried lumber increases exponentially with the MC and linearly with the basic density (William 1988). However, the actual algorithms implemented by NMI are not released to the public. The company only claims that the NMI reading is proportional to both MC and basic density, thus being representative of the vaguely defined “dry-ability” parameter. In the particular case of 4”x4” hemlock timber, the sawmill found that NMI>75% was associated to heavy wet-pockets that were not suitable for kiln drying.

81
New Methodology to optimize sorting...: Elustondo et al. maderas CIENCIA Y TECNOLOGIA,12(2):79-91, 2010
Figure 2: Capacitance sensors of an NMI, MC Pro 1500, DOS version
The sorting strategy consisted in rejecting all lumber with NMI>75%, and then dividing the rest of the lumber into three sorts referred as low (L), medium (M), and high (H). The NMI sorting points for creating the L, M and H sorts were minimum-NMI=0%, low-NMI=40%, high-NMI=53% and maximum-NMI=75%. Figure 3 shows the approximate NMI distribution measured at the mill. The figure also indicates that the L, M and H sorts contained respectively 40%, 40%, and 20% of the total dried lumber.
Another three sorts were created at FPInnovations-Forintek in Vancouver, BC, by combining different amounts of L, M and H lumber. These new sorts were referred as unsorted (L+M+H), wet-free (L+M) and dry-free (M+H). In total, six different lumber sorts were dried. The numbers of L, M and H pieces used for each sort were determined to maintain the proportion of L, M, H, L+M, M+H and L+M+H lumber that are shown in figure 3. Drying runs were carried out in a laboratory 0.7 m3 conventional kiln. Each kiln charge contained 42 pieces of 0.9 m long hem-fir lumber arranged in a single 6 layers by 7 pieces package. The sorting points and number of L, M, and H pieces used in each sort are reported in Table 1.
Figure 3: NMI distribution and percentage of total lumber contained in each NMI sort

82
U n i v e r s i d a d d e l B í o - B í o
Table 1: Pieces and sorting points used for the six lumber sorts dried in the laboratory kiln
To minimize random variability, the laboratory lumber sorts were prepared with matched specimens. Lumber sorted at the sawmill was 4 m long, thus it was possible to cut three matched 0.9 m pieces from each 4 m lumber piece. Additionally, four 25 mm wide samples were cut at the ends of each 0.9 m section for determination of initial MC. The procedure for obtaining three matched specimens from each 4 m lumber is shown in Figure 4. Immediately after cutting, each 0.9 m piece was weighed with an electronic balance, labeled, end-sealed with glue, and put into plastic bags to prevent MC losses before drying.
Figure 4: Procedure for obtaining three matched specimens from each 4 m timber
The unsorted lumber (L+M+H) was dried with a time-basis schedule consisting of an initial 6 h warm-up ramp, 7 successive steps in which dry-bulb and wet-bulb gradually increased every 24 h, and a final step at constant 78°C dry-bulb and 65°C wet-bulb temperatures that ended when the average lumber MC was approximately 15%. The other five sorts were dried with a MC-basis schedule valid for both sorted and unsorted lumber. This MC-basis schedule was created by normalizing the average MC measured for unsorted lumber at the end of each time-based step. In this context, normalized MC was defined as 1 when the lumber sort was still green and 0 when the lumber sort has reached the fiber saturation point. The experimental drying curves measured for the six laboratory sorts are shown in Figure 5, where the black lines are the experimental MC curves and the grey lines connect the experimental time and MC at the end of each temperature step.
maderas CIENCIA Y TECNOLOGIA, 12(2):79-91, 2010

83
Figure 5: Drying curves for the six lumber sorts showing the duration of each MC-basis step
The sorting parameters were analyzed mathematically by using three regression equations that were specifically developed for this study. In these equations, X represents the fraction of pieces that are contained in each sort, and A, B, C and N are constant parameters that are adjusted to fit the experimental drying time and standard deviation by the method of least square error. For simplicity, both drying time and standard deviation are represented by the same letter R (standing for result), but they are treated as two different sets of experimental results. After adjusting the parameters, the regression equations are used to predict R for other hypothetic sorting strategies where low-NMI and high-NMI are the arbitrary sorting points. The three regressions equations are described below:
Estimation of drying degrade Regardless of the wood product, numerous studies have shown that an important fraction of wood value is lost after drying due to shrinkage and distortion. This form of drying degrade is exacerbated by over-drying, thus finding the conditions that minimize value losses requires a good understanding of how shrinkage and distortion develops during drying. The method proposed in this study consist in measuring moisture content, shrinkage, and distortion for a relatively small sample of dried wood, and then using stochastic simulation to estimate the overall drying degrade for other drying conditions. The relationship between drying degrade and value losses are then calculated for each particular drying operation on the basis of the revenue $ difference between the high and the standard/low grades.
maderas CIENCIA Y TECNOLOGIA, 12(2):79-91, 2010New Methodology to optimize sorting...: Elustondo et al.

84
U n i v e r s i d a d d e l B í o - B í o
The theoretical foundation for stochastic simulation has been already explained in Elustondo and Avramidis (2005). In this study, stochastic simulation of drying degrade consisted in determining an empirical relationship between lumber MC and drying degrade, and then generating a theoretical degrade distribution by combining the empirical relationship with the lumber final MC distribution. In 114 by 114 mm2 hem-fir lumber distortion is a combination of curvature (bow) and rotation (twist) along the length, and effective shrinkage is a combination of the fiber shrinkage and the distortion in the cross sectional area (diamonding).
The shrinkage and distortion measurements were performed in a previous study at the University of British Columbia (Hao and Avramidis, 2004). In that study, 4 runs of 2.44 m by 114 mm by 114 mm hem-fir lumber were dried in a 2.44 m wide conventional kiln using the same temperature time-basis schedule that was used in this study. Each run comprised of 160 pieces, and the experimental measurements included green MC, basic density, thickness and width at mid-length, bow, twist and diamonding. Bow, twist and diamonding were measured in a flat L shaped aluminum table with special digital dial gauges. Twist and bow were measured in reference to the flat surface of the table, and diamonding was measured with a gauge attached to a steel 90 degree reference frame. Figure 6 shows a photograph of the gauge used to measure bow and twist.
The effect of MC in the development of shrinkage and distortion was determined empirically from the experimental data. It was found that the average shrinkage and distortion increased proportionally to the reduction of MC below 45%, and both shrinkage and distortion showed a wide range of dispersion around the average value. It was found that when the natural logarithm was applied, the dispersion of both shrinkage and distortion around the average became approximately normal, and the standard deviations (SD) of the log-normal distributions were approximately constant throughout the analyzed MC range. This empirical relationship was implemented in the stochastic model, and a simple calibration algorithm was added to calculate the log-normal average and SD from the shrinkage and distortion data measured experimentally.
Figure 6: Example of bow measurement in comparison with flat L shape aluminum table
Industrial validation To prove if the sorting parameters estimated theoretically would produce the predicted benefit in an industrial operation, FPInnovations engaged in a sawmill test to measure the lumber value increase and drying time reduction that could be achieved by sorting 114 by 114 mm2 hem-fir lumber. The tests were performed in the same sawmill that provided the sorted lumber for the laboratory tests. Since the mill was already sorting the lumber to produce an H sort, the industrial trial only required one drying run to test the L sort, one drying run to test the M sort, and one drying run to test mixed L+M lumber as reference. The three drying runs were performed simultaneously in three different kilns to guarantee a consistent fiber supply.
maderas CIENCIA Y TECNOLOGIA, 12(2):79-91, 2010

85
RESULTS AND DISCUSSION
Optimization of sorting parameters The experimental drying time, final MC and final SD measured for the 6 laboratory drying runs are reported in Table 2.
Table 2: Experimental drying time, and final MC and SD measured for the six lumber sorts
Average shrinkage was between 2.5% and 2.8% depending on the experiments, and the results indicated that shrinkage was not considerably affected by the sort initial MC. Experimental shell and core MC after drying are shown in Figure 7. The figure also includes two discontinuous lines indicating that the core MC is lower than the theoretical fiber saturation point (FSP=30%) when the average MC is lower than approximately 20%. Therefore, MC 20% was used as the wet-limit for which it can be assumed that the lumber core is not wet after drying.
For the purpose of this study, only the total drying time and the final SD were analyzed to optimize the sorting strategy. Regression parameters for total drying time and final SD are reported in Table 3. By using these regression parameters, the optimum Low-NMI and High-NMI sorting point were calculated by minimizing the overall drying time and SD calculated with the three regression equations described in Materials and Methods.
Figure 7: Experimental shell and core MC for all pieces dried at FPInnovations’ laboratory
New Methodology to optimize sorting...: Elustondo et al. maderas CIENCIA Y TECNOLOGIA, 12(2):79-91, 2010

86
U n i v e r s i d a d d e l B í o - B í o
Table 3: Coefficients for the regression equations applied to drying time and final SD
As an example, Figure 8 shows the results of the optimization for overall drying time which is a function of the Low-NMI sorting point for 4 arbitrary High-NMI sorting points. Since the sawmill only dries lumber with NMI<75%, then the grey curve represents the case of two sorts with a sorting point indicated by the low-NMI. The other three curves represent sorting strategies using three sorts with sorting points indicated by the low-NMI and high-NMI values.
The numeric results for overall drying time and MC standard deviation of unsorted and optimized sorted lumber are reported in table 4. Since the minimum revenue $ losses after drying depends on the economics of the industrial process, the example in table 4 includes two arbitrary optimization criteria, namely minimum overall drying time (sorted 1) and minimum overall SD (sorted 2). The results indicated that by using a low-NMI between 41 and 45% and a high-NMI between 51 and 54%, the overall SD can be potentially reduced from 5.7% to between 2.2 and 3%, and the overall drying time can be potentially reduced from 13.6 to between 12.4 and 12.6 days with respect to unsorted lumber.
Figure 8: Overall drying time as function of the low-NMI and high-NMI sorting points
Table 4: Overall drying time and SD for unsorted lumber and two optimized sorting strategies
maderas CIENCIA Y TECNOLOGIA, 12(2):79-91, 2010
87
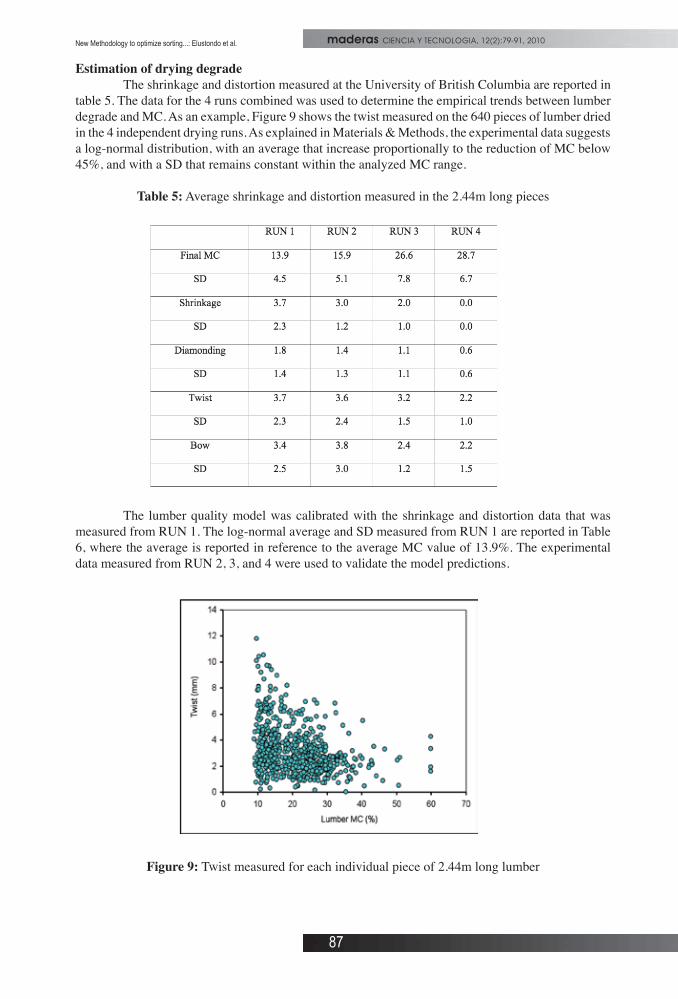
Estimation of drying degrade The shrinkage and distortion measured at the University of British Columbia are reported in table 5. The data for the 4 runs combined was used to determine the empirical trends between lumber degrade and MC. As an example, Figure 9 shows the twist measured on the 640 pieces of lumber dried in the 4 independent drying runs. As explained in Materials & Methods, the experimental data suggests a log-normal distribution, with an average that increase proportionally to the reduction of MC below 45%, and with a SD that remains constant within the analyzed MC range.
Table 5: Average shrinkage and distortion measured in the 2.44m long pieces
The lumber quality model was calibrated with the shrinkage and distortion data that was measured from RUN 1. The log-normal average and SD measured from RUN 1 are reported in Table 6, where the average is reported in reference to the average MC value of 13.9%. The experimental data measured from RUN 2, 3, and 4 were used to validate the model predictions.
Figure 9: Twist measured for each individual piece of 2.44m long lumber
New Methodology to optimize sorting...: Elustondo et al. maderas CIENCIA Y TECNOLOGIA, 12(2):79-91, 2010

88
U n i v e r s i d a d d e l B í o - B í o
Table 6: Parameters for the lumber quality model measured from RUN 1 at an average MC 13.9%
As an example, Figure 10 shows a comparison between the experimental and the simulated twist distribution for RUN 2.
After calibration, the quality model was applied to calculate the final size and distortion distribution that would have been obtained if the 2.44 m lumber had been dried to a final MC 15% and the SDs reported in Table 4. To calculate the final size, the stochastic model was used to combine the simulated shrinkage distribution and the actual green size distribution (that was average 115.5 mm and SD 1.2 mm). Then, drying degrade was calculated as the percentage of pieces that shrank below the minimum final size or distorted above the maximum allowed bow and twist.
Figure 10: Comparison between experimental and simulated twist distribution for RUN 2
For the purposes of this study, the minimum final size was assumed 106 mm and the maximum bow and twist was assumed 6 mm. As an example, Figure 11 shows the simulated final lumber size before and after implementing one of the optimized sorting strategies. The figure includes a discontinuous line showing the pieces at the left of the line that should be downgraded due to planer skips.
The percentage of lumber with excessive shrinkage or distortion simulated with the quality model is reported in table 7. These results indicate that by implementing one of the optimized sorting strategies, the percentage of pieces with excessive shrinkage, twist and bow can be respectively reduced in the order of 3%, 1% and 0.5%. Considering that shrinkage and distortion may combine in some of the pieces, this approximately means that sorting 114 by 114 mm2 hem-fir lumber in three optimized groups can potentially reduce drying degrade in the order of 4%.
maderas CIENCIA Y TECNOLOGIA, 12(2):79-91, 2010

89
Figure 11: Simulated final lumber size before and after implementing one of the optimized sorting strategies
Table 7: Percentage of lumber with excessive shrinkage or distortion
For translating the simulated drying degrade into lumber value $ losses it is assumed that excessive shrinkage and distortion downgrade high quality lumber into another grade with lower commercial value. In the particular case of this study, it is assumed that high quality lumber with a commercial value of $900/Mfbm is downgraded into other grades with an average commercial value of approximately $450/Mfbm. From the industrial data, the percentage of lumber with high quality grade can be assumed in the order of 40%, thus meaning that a 4% increase in this grade should increase the revenues of the process in approximately $8 per Mfbm of total dried lumber.
Industrial validation In general terms, the results of the industrial validation confirmed the results estimated with the theoretical models. After drying the two sorted groups of lumber, the report provided by the sawmill indicated that value uplift associated with moisture sorting was approximately $8/Mfbm, and the overall drying time can be potentially reduced by 1 day approximately in comparison with the unsorted group. This uplift was realized without affecting the percentage of wets. Extrapolating these results to a sawmill producing 30,000 Mfbm/year of dried 114 by 114mm2 hem-fir lumber shows a possible increase in revenue of roughly $800,000/year, provided the spare drying capacity, created by the drying time reduction, could be utilized.
New Methodology to optimize sorting...: Elustondo et al. maderas CIENCIA Y TECNOLOGIA, 12(2):79-91, 2010

90
U n i v e r s i d a d d e l B í o - B í o
CONCLUSIONS
In this study a method to optimize lumber sorting was developed and tested for drying of 114 by 114mm2 hem-fir lumber. The method included an experimental procedure to optimize the sorting parameters, and a stochastic model to estimate drying degrade. The former consisted in sorting the entire lumber population into three sorts and then combining the sorted lumber into six subgroups that show the effect of the sorting parameters on the drying results. The latter consists in determining an empirical relationship between lumber MC and drying degrade, and then using stochastic simulation to estimate the theoretical percentage of pieces with excessive degrade as function of the final MC distribution.
For both the laboratory tests and the industrial validation, the 114 by 114 mm2 hem-fir lumber was sorted at a local sawmill in British Columbia using the NMI capacitance type technology. It was found that in comparison with unsorted lumber, sorting into three lumber groups can potentially reduce drying time by 1 day approximately and increase lumber value in approximately $8/Mfbm. As a rough estimation, these results would increase a potential annual sales in the order of one million dollars depending on the kiln capacity and market conditions.
REFERENCES
Avramidis, S.; Aune, J.; Oliveira, L. 2004. Exploring pre-sorting and re-drying strategies for Pacific Coast Hemlock square timbers. Journal of the Institute of Wood Science 16(4): 189-198.
Avramidis, S.; Shida, S.; Kounoutsakos, A; Kobayashi, D. 2005. Stability study of square timbers in simulated house frame service in Japan. Forest Products Journal 55(10):84-91.
Bassett, K.H. 1973. A look at redry. Western Dry Kiln Clubs, 24th Annual Meeting. Oregon State University, Corvallis, USA. pp:31-39.
Berry, W.S. 1969. An example of operations research in the dry kilns. Western Dry Kiln Clubs, 20th Annual Meeting. Oregon State Univ., Corvallis, USA. pp:18-21.
Cronin, K.P.; Abodayeh, K.; Caro-Corrales, J. 2002. Probabilistic analysis and design of the industrial timber drying process. Drying Technology 20(2):307–324.
Cronin, K.P.; Baucour, P.; Abodayeh, K.; Barbot Da Silva, A. 2003. Probabilistic analysis of timber drying schedules. Drying Technology 21(8):1435–1458.
Elustondo, D.M.; Avramidis, S., Oliveira, L. 2004. Estimation of green moisture content distribution in hemfir timber by stochastic modeling. Holzforschung 58:413–417.
Elustondo, D.M.; Avramidis, S.; Zwick, R. 2005. The Demonstration of increased fiber utilization using optimized lumber sorting and radio frequency vacuum drying. Forest Products Journal 55(1):76-83.
Elustondo, D.M.; Avramidis, S. 2003. Simulated comparative analysis of sorting strategies for RFV drying. Wood and Fiber Science 35(1):49-55.
Elustondo, D.M.; Avramidis, S. 2005. Comparative analysis of three methods for stochastic lumber drying simulation. Drying Technology 23:131–142.
Hao, B.; Avramidis, S. 2004. Annual ring orientation effect and slope of grain in hemlock timber drying. Forest Product Journal 54(11):41-49.
maderas CIENCIA Y TECNOLOGIA, 12(2):79-91, 2010

91
Holmes, S.; Arganbright, D.G. 1984. Green sorting incense-cedar for increased air-drying yard throughput. Forest Products Journal 34(3):57-63.
Kayihan, F. 1984. The process dynamics and the stochastic behavior of batch kilns. AIChE Symposium Series 246(81):104–116.
Kayihan, F. 1985. Stochastic modeling of lumber drying in batch kilns. In proceedings of Drying ‘85. Washington, DC.
Kozlik, C.J. 1987. Kiln-drying incense-cedar squares for pencil stock. Forest Products Journal 37(5):21-25.
Kozlik, C.J.; Ward, J.C. 1981. Properties and Kiln-Drying Characteristics of Young-Growth Western hemlock Dimension Lumber. Forest Products Journal 31(6):45-53.
Milota, M.; Wu, Q. 1997. Postsorting of hem-fir: A mill Study. Forest Products Journal 47(2):49-56.
Simpson, W.T. 1991. Dry kiln operator’s manual. Agriculture handbook no. 188. Forest Products Laboratory, Madison, USA.
Sugimori, M.; Hayashi, K.; Takechi, M. 2006. Sorting sugi lumber by criteria determined with cluster analysis to improve drying. Forest Products Journal 56(2):25-29.
Yichun, Z.; Oliveira, L.; Avramidis, S. 1996. Drying characteristics of hem-fir squares as affected by species and basic density presorting. Forest Products Journal 46(2):44-50.
Wallace, J.W.; Hartley, I.D.; Avramidis, S.; Oliveira, L.C. 2003. Conventional kiln drying and equalization of Western hemlock (Tsuga heterophylla (Raf.)[Sarg]) to Japanese equilibrium moisture content. Holz als Roh - und Werkstoff 61(4):257-263.
William, J.L. 1988. Electric moisture meters for wood. Gen. Tech. Rep. FPL-GTR-6. Forest Products Laboratory, Madison, USA.
New Methodology to optimize sorting...: Elustondo et al. maderas CIENCIA Y TECNOLOGIA, 12(2):79-91, 2010

92
U n i v e r s i d a d d e l B í o - B í omaderas CIENCIA Y TECNOLOGIA, 12(2):92, 2010