1 methodologies of carbon estimation by zahabu, e & malimbwi, r.e department of forest...
TRANSCRIPT

11
Methodologies of Carbon Methodologies of Carbon EstimationEstimation
ByBy
Zahabu, E & Malimbwi, R.EZahabu, E & Malimbwi, R.EDepartment of Forest Mensuration and Department of Forest Mensuration and
ManagementManagement
(SUA)(SUA)

2
IntroductionIntroduction
Carbon trade involves the sale of carbon credits. Carbon trade involves the sale of carbon credits.
There are two main types of Carbon Trading There are two main types of Carbon Trading Schemes that are operating globally to-date: Schemes that are operating globally to-date:
Voluntary Carbon Trading (VCT), and Voluntary Carbon Trading (VCT), and
The official Kyoto Protocol Carbon Trading Mechanisms. The official Kyoto Protocol Carbon Trading Mechanisms.
Carbon benefit of any forest carbon project = Carbon benefit of any forest carbon project = carbon changes to known levels of precision.carbon changes to known levels of precision.
Determination of carbon changes requires Determination of carbon changes requires baselines baselines

3
BaselinesBaselines Baseline: historical trends against which Baseline: historical trends against which
additional carbon benefits as a result of additional carbon benefits as a result of carbon project can be determined. carbon project can be determined.
Baseline and monitoring schemesBaseline and monitoring schemes individual project,individual project, regional e.g Eastern Arc, and regional e.g Eastern Arc, and national levelsnational levels
Requires reliable data on Requires reliable data on forest extentforest extent and and stockingstocking. .

4
What Should be Measured?What Should be Measured? Forest Extent Forest Extent Forest Stocks in Five IPCC pools: Forest Stocks in Five IPCC pools:
aboveground, aboveground, belowground, belowground, litter, litter, dead wood and dead wood and soil organic carbon soil organic carbon
Widely accepted forest inventory procedures Widely accepted forest inventory procedures recommended by IPCC Good Practice Guide recommended by IPCC Good Practice Guide (IPCC, 2003)(IPCC, 2003)
CDM Approved LULUCF methodologies.CDM Approved LULUCF methodologies.

5
Measurable Carbon changesMeasurable Carbon changes
Sequestration/EnhancementSequestration/Enhancement increases of forest biomass within areas of existing forestincreases of forest biomass within areas of existing forest
Conservation Conservation maintenance of a steady level of forest area and biomass density, maintenance of a steady level of forest area and biomass density, relate to forests that are already properly managed, e.g relate to forests that are already properly managed, e.g
protective forest reserves and protective forest reserves and national parks national parks could be rewarded through a special “conservation” under REDD. could be rewarded through a special “conservation” under REDD.
Reduction in emissions from deforestationReduction in emissions from deforestation i.e. based on comparisons of rates of change of forest area over i.e. based on comparisons of rates of change of forest area over
time, time,
Reductions in emissions from degradationReductions in emissions from degradation reductions in biomass/carbon stock in the forest without loss of reductions in biomass/carbon stock in the forest without loss of
forest area, forest area,
6
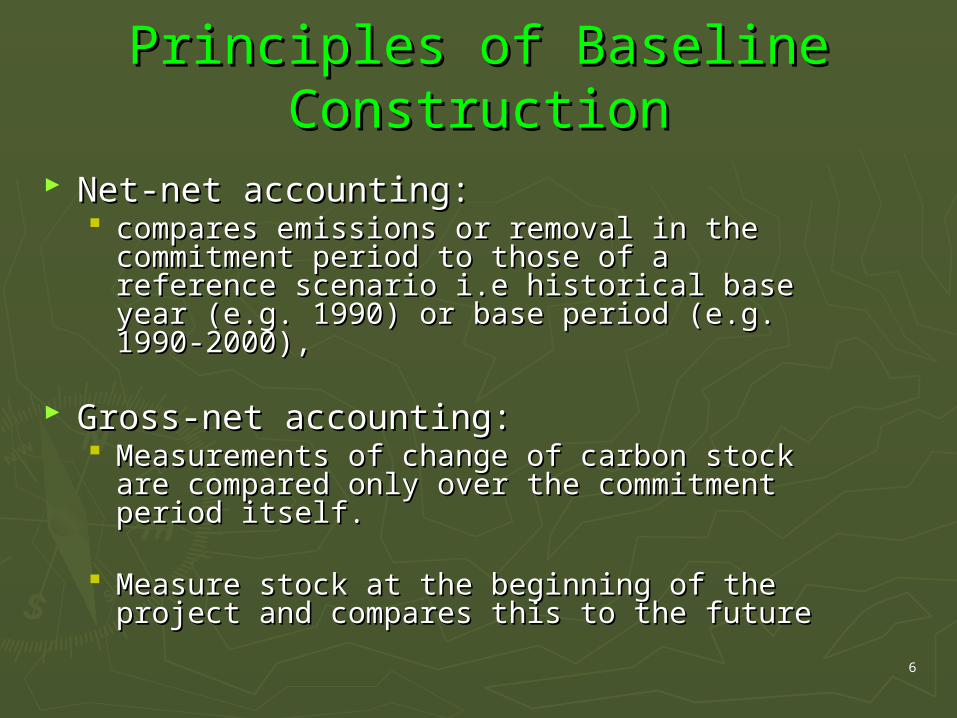
Principles of Baseline ConstructionPrinciples of Baseline Construction
Net-net accounting:Net-net accounting: compares emissions or removal in the commitment compares emissions or removal in the commitment
period to those of a reference scenario i.e historical period to those of a reference scenario i.e historical base year (e.g. 1990) or base period (e.g. 1990-base year (e.g. 1990) or base period (e.g. 1990-2000), 2000),
Gross-net accounting:Gross-net accounting: Measurements of change of carbon stock are Measurements of change of carbon stock are
compared only over the commitment period itself. compared only over the commitment period itself.
Measure stock at the beginning of the project and Measure stock at the beginning of the project and compares this to the futurecompares this to the future

7
Baseline for DeforestationBaseline for Deforestation Principle: Principle:
a reference scenario from a historical period and net-net accounting.a reference scenario from a historical period and net-net accounting. Based on remotely sensed data over a historical period which Based on remotely sensed data over a historical period which
shows change in area covered by forest.shows change in area covered by forest.
Then data on carbon stock in different types of forest are used to Then data on carbon stock in different types of forest are used to calculate the change in terms of tons of carbon. calculate the change in terms of tons of carbon.
May be projected into the future and used to credit the additional May be projected into the future and used to credit the additional mitigation benefit of the project mitigation benefit of the project
Challenges:Challenges: Setting reference base yearSetting reference base year Carbon stock data highly variable: national forest inventory not undertakenCarbon stock data highly variable: national forest inventory not undertaken Assumes carbon stock per unit area is constantAssumes carbon stock per unit area is constant

8
FAO: FRA 2005FAO: FRA 2005 Tanzania used satellite imagery interpreted data of:Tanzania used satellite imagery interpreted data of:
1984 (Millington and Towsend, 1989) and compared these with 1984 (Millington and Towsend, 1989) and compared these with 1995 Hunting Technical Services (1997) for the determination of land cover 1995 Hunting Technical Services (1997) for the determination of land cover
changes in the country.changes in the country.
Annual deforestation = 412,000 ha Annual deforestation = 412,000 ha
Average stocking 36 m3/ha from CEEST, (1999) Average stocking 36 m3/ha from CEEST, (1999)
Carbon data are reported with their statistical confidence intervals Carbon data are reported with their statistical confidence intervals (expressed as (expressed as values) at known precision level. values) at known precision level.
Most previous studies had low precision levels due to low sampling Most previous studies had low precision levels due to low sampling intensity adopted. intensity adopted.
Moreover, they cover only a few forests.Moreover, they cover only a few forests.

9
Baseline for DegradationBaseline for Degradation Look at rates of biomass loss within the forestLook at rates of biomass loss within the forest
This is not visible in remote sensingThis is not visible in remote sensing
Need ground measurements: No previous quality dataNeed ground measurements: No previous quality data
Possible to use one of the following techniques:Possible to use one of the following techniques: advanced remote sensing techniques (LiDAR), advanced remote sensing techniques (LiDAR), harvesting estimates from the local people, harvesting estimates from the local people, harvesting estimates from stumps counts, harvesting estimates from stumps counts, default values (rule of thumb)/modelling, or default values (rule of thumb)/modelling, or harvesting estimates from control sites. harvesting estimates from control sites.
Will be captured together with enhancement under gross-net Will be captured together with enhancement under gross-net accountingaccounting

10
Degradation
Recover toward the threshold
Normal growth pattern
Time (years)
Gro
wth
Start of mgt
Forest Degradation & Enhancement BaselinesForest Degradation & Enhancement Baselines
Baseline Degrd.
Present stock Productive For
Present stock Protective for.
Start Measurements
No previous data on forest degradation & enhancementNo previous data on forest degradation & enhancement
Protective forest: to determine the rate of recovery Protective forest: to determine the rate of recovery
Productive forests: to determine the rate of degradationProductive forests: to determine the rate of degradation

11
Establishment of Baseline at Establishment of Baseline at National LevelNational Level
Carryout national forest inventory to establish deforestation rates Carryout national forest inventory to establish deforestation rates and stocking levelsand stocking levels Determine land use cover changes for the period of 1975 to 1990 to 2000 to Determine land use cover changes for the period of 1975 to 1990 to 2000 to
2007 using Landsat TM (FAO, 2007)2007 using Landsat TM (FAO, 2007) Conduct case studies to quantify emission factors for different forest typesConduct case studies to quantify emission factors for different forest types
Identify drivers of deforestation Identify drivers of deforestation
Training on national forest inventories and remote sensing Training on national forest inventories and remote sensing
Development of tools for assessment and monitoring of Development of tools for assessment and monitoring of deforestationdeforestation
Monitoring in PSP/LiDAR technology to capture forest Monitoring in PSP/LiDAR technology to capture forest enhancement and/or degradation levels. enhancement and/or degradation levels.

12
Establishment of Baselines at Establishment of Baselines at Projects LevelProjects Level
Review and synthesize existing studies on degradation/ Review and synthesize existing studies on degradation/ growth rates growth rates
Development and testing of methodologies to measure and Development and testing of methodologies to measure and monitor enhancement and/or forest degradation monitor enhancement and/or forest degradation
Development of tools, guidelines and manual for Development of tools, guidelines and manual for degradation assessment and monitoring degradation assessment and monitoring
Carryout assessment and monitoring of forest degradation Carryout assessment and monitoring of forest degradation in demonstration projects for establishing historic in demonstration projects for establishing historic degradation emission factors including cost implications, degradation emission factors including cost implications, and accuracy leveland accuracy level

13
Carbon Assessment & Monitoring by Carbon Assessment & Monitoring by Local CommunitiesLocal Communities
This is a strategy to involve local This is a strategy to involve local communities in order tcommunities in order to reduce the o reduce the transaction costs of measuring carbontransaction costs of measuring carbon
Local communities were trained and Local communities were trained and
tasked to conduct the measurementstasked to conduct the measurements
Techniques were developed to measure Techniques were developed to measure and monitor carbon stock.and monitor carbon stock.
They are:They are:• User friendly to the users - i.e.to the User friendly to the users - i.e.to the
communitiescommunities• reliable and reliable and • presented in a format acceptable to presented in a format acceptable to
the scientific communitythe scientific community

14
The equipmentThe equipment
Consists of:Consists of: A handheld computer with ArcPadA handheld computer with ArcPadTMTM 6.0 software and 6.0 software and
connected to GPS connected to GPS It is easy to useIt is easy to use Is used to locate: Is used to locate:
forestry boundaries forestry boundaries sample plots and sample plots and
recording measurement datarecording measurement data WithWith a step-by-step guide to the procedures, a step-by-step guide to the procedures, local local
communities were trained in a short time and were able to communities were trained in a short time and were able to use the system effectivelyuse the system effectively

15
Steps in Carbon AssessmentSteps in Carbon Assessment
i.i. Forest mapping/stratificationForest mapping/stratification
ii.ii. Pilot survey to estimate variance and number of Pilot survey to estimate variance and number of sample plotssample plots
iii.iii.Locate the sample plots on the ground Locate the sample plots on the ground
iv.iv.Measure the dbh of all trees Measure the dbh of all trees
v.v.Set out the sub-plots for the grasses, herb and Set out the sub-plots for the grasses, herb and litter datalitter data
vi.vi.Take soil samples randomly within the plotTake soil samples randomly within the plot

16

17

18
Locating sample plots on groundLocating sample plots on ground

19
Measurements taken from the plotMeasurements taken from the plot

20
Other forest typesOther forest types

21

22
Data analysisData analysis The following trees stand parameters were computed:
• Density i.e. the number of stems per ha (N)• Basal area per hectare (Dominance)(G) • Volume per ha (V) and• Dry biomass / carbon (tones per ha)
Trees volume and biomass were computed using tested local existing allometric functions for the areas.
Computation were fitted on Ms Access database

23
ResultsResultsWith Project CaseWith Project Case
Vegetation Vegetation typetype
LocationLocation Average Average annual annual increment increment (t/ha/yr) (t/ha/yr)
CO2 CO2 sequestration sequestration (tCO(tCO22/ha/yr)/ha/yr)
Forest Area (ha)Forest Area (ha) Total Total sequestration sequestration (tCO(tCO22/ha/yr)/ha/yr)
WoodlandsWoodlands KitulangaloKitulangalo 2.82.8 5.35.3 600600 3,1803,180
AyasandaAyasanda 1.71.7 3.23.2 550550 1,7601,760
LowlandLowland LudewaLudewa 4.44.4 8.38.3 28.528.5 237237
MontaneMontane MgamboMgambo 5.25.2 9.89.8 156156 1,7601,760
Without Project caseWithout Project case
Vegetation Vegetation typetype
LocationLocation Average Average biomass loss biomass loss
(t/ha/yr) (t/ha/yr)
Average COAverage CO22
Emissions Emissions (t/ha/yr) (t/ha/yr)
Forest Area (ha)Forest Area (ha) Total COTotal CO22
Emissions Emissions (tCO2/ha/yr)(tCO2/ha/yr)
WoodlandWoodland KitulangaloKitulangalo 11 1.81.8 600600 10141014
MontaneMontane MgamboMgambo 3.53.5 6.56.5 156156 10801080

24
Conclusions & RecommendationsConclusions & Recommendations
Methods exists to assess and measure Methods exists to assess and measure forest carbon, however these are forest carbon, however these are complex to the userscomplex to the users
More studies are required for the More studies are required for the Development of user friendly tools for the Development of user friendly tools for the assessment and monitoring forest carbonassessment and monitoring forest carbon
2525
The End!The End!
Thank You!!!Thank You!!!
Ahsanteni Sana!!!Ahsanteni Sana!!!