1 metabolomics a promising ‘omics science by susan simmons university of north carolina wilmington
TRANSCRIPT

1
Metabolomics a Promising ‘omics Science
By Susan Simmons
University of North Carolina Wilmington
2
Collaborators
Dr. David Banks, Duke Dr. Chris Beecher, University of Michigan Dr. Xiaodong Lin, University of Cincinnati Dr. Young Truong, UNC Dr. Jackie Hughes-Oliver, NC State Dr. Stanley Young, NISS Dr. Ann Stapleton, UNCW Biology Dr. Robert Simmons, MD
3
What is Metabolomics?
The word metabolome was first used less than a decade ago (1998) and referred to all low molecular mass compounds synthesized and modified by a living cell or organism (Villas-Boas, 2007)
The complete human metabolome consists of endogenous (~1800) and exogenous metabolites (MANY!!)
Human Metabolome Project
4
5
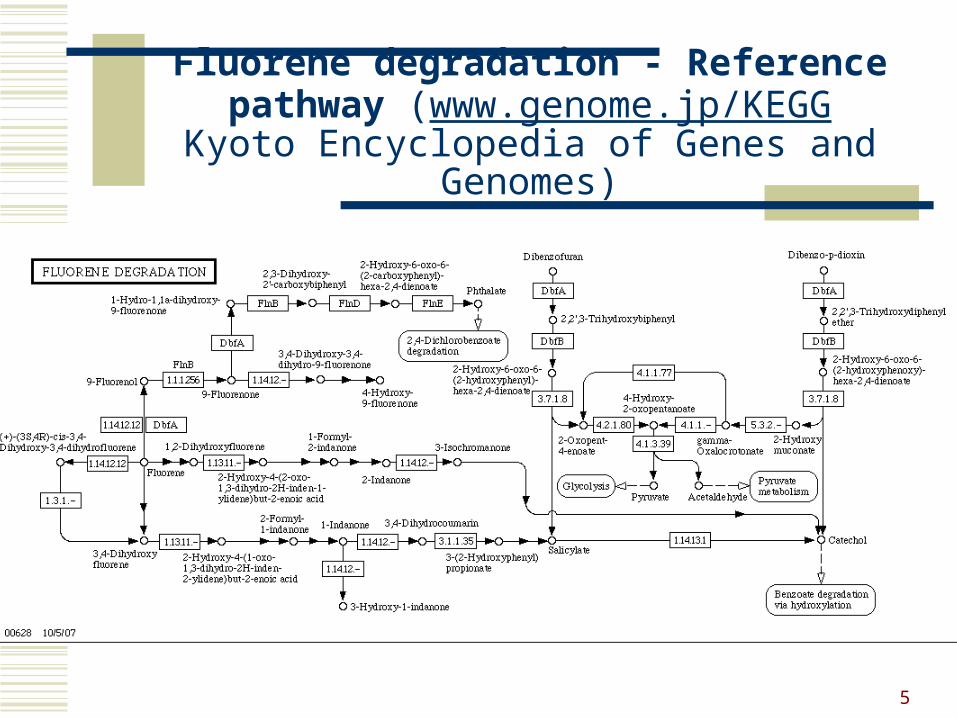
Fluorene degradation - Reference pathway (www.genome.jp/KEGG
Kyoto Encyclopedia of Genes and Genomes)
6
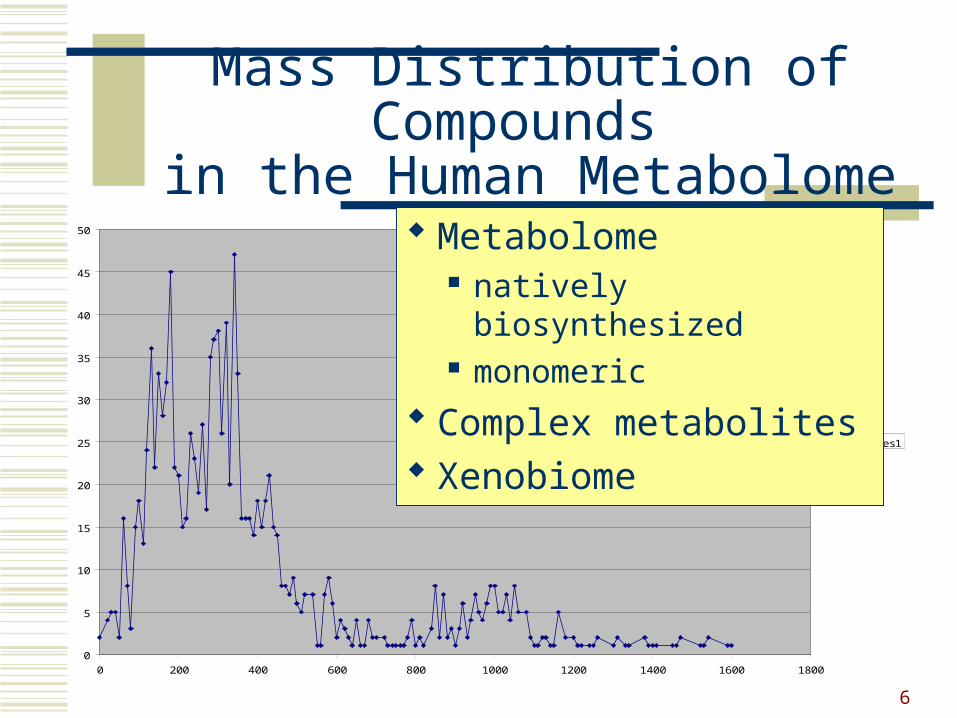
Mass Distribution of Compounds in the Human Metabolome
0
5
10
15
20
25
30
35
40
45
50
0 200 400 600 800 1000 1200 1400 1600 1800
Series1
Metabolome natively biosynthesized monomeric
Complex metabolites Xenobiome

7
History of Metabolomics
Machinery to detect metabolites have existed since the late 1960’s
First paper appeared in 1971 (Robinson and Pauling)
First paper involving “metabolomics” came about in the late 1990’s
8
Why Metabolomics can be promising
Easy to use screening for disease Assist in identifying gene function Drug discovery Assessment of toxicity (especially liver
toxicity) in new drugs. Nutrigenomics and diet strategies
9
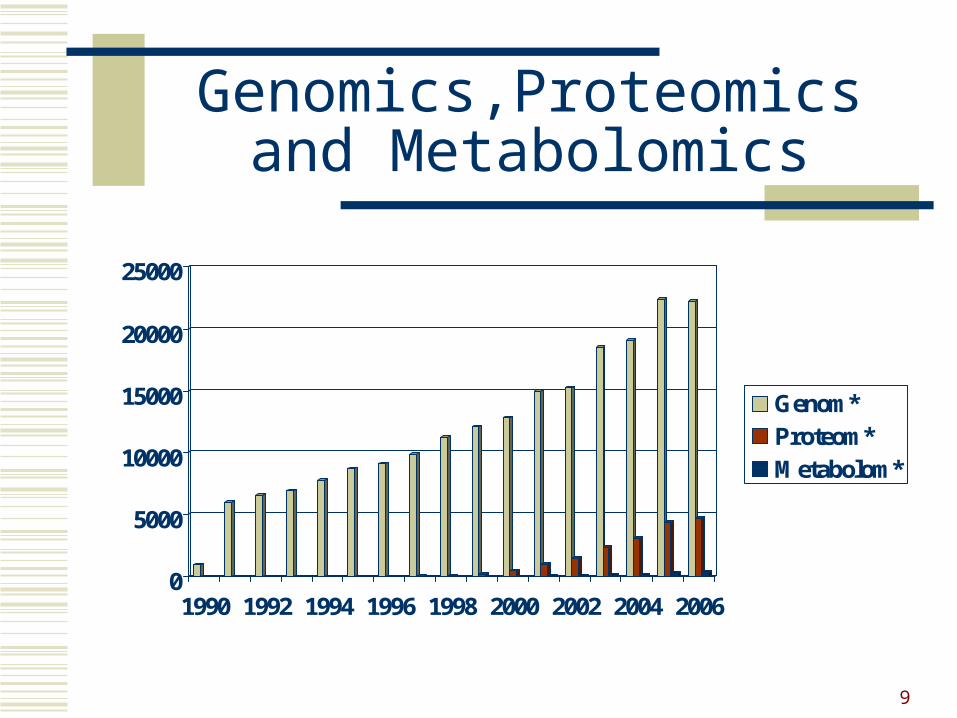
Genomics,Proteomics and Metabolomics
0
5000
10000
15000
20000
25000
1990 1992 1994 1996 1998 2000 2002 2004 2006
Genom*Proteom*Metabolom*

10
The emerging science of Metabolomics
0
50
100
150
200
250
300
1998 1999 2000 2001 2002 2003 2004 2005 2006
Year
Nu
mb
er p
ub
lica
tio
ns
2 2 7 15
132
88
52
269
228
0
50
100
150
200
250
300
1998 1999 2000 2001 2002 2003 2004 2005 2006
Year
Nu
mb
er p
ub
lica
tio
ns
2 2 7 15
132
88
52
269
228
11
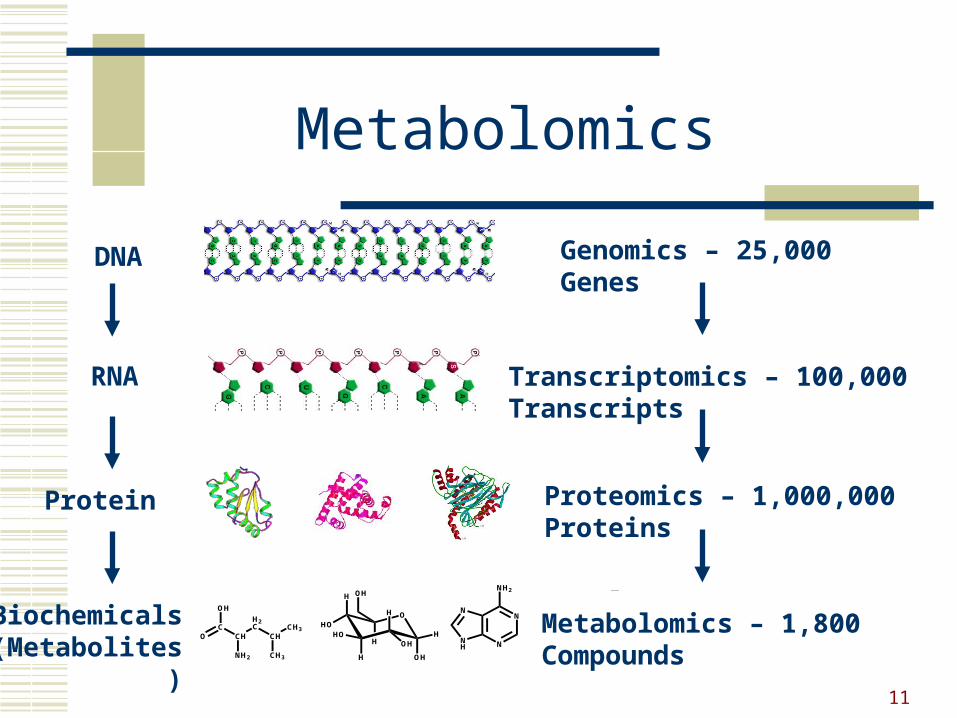
Metabolomics
DNA
RNA
Protein
Biochemicals (Metabolites)
Genomics – 25,000 Genes
Transcriptomics – 100,000 Transcripts
Metabolomics – 1,800 Compounds
Proteomics – 1,000,000
Proteins
N
NNH
N
NH2
NH2
CHC
H2C
OH
O CHCH3
CH3
O
H
HO
H
HO
H
OH
OHHH
OH
12
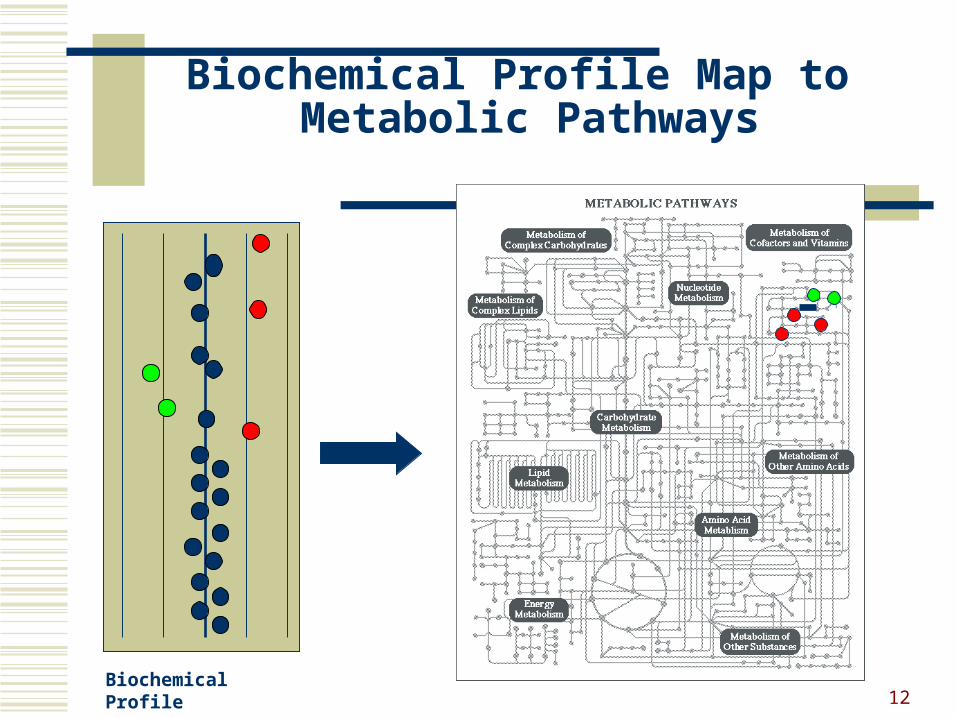
Biochemical Profile Map to Metabolic Pathways
Biochemical Profile
13
Data Collection and Measurement Issues
To obtain data, a tissue sample is taken from a patient. Then:
The sample is prepped and put onto wells on a silicon plate.
Each well’s aliquot is subjected to gas and/or liquid chromatography.
After separation, the sample goes to a mass spectrometer.
14
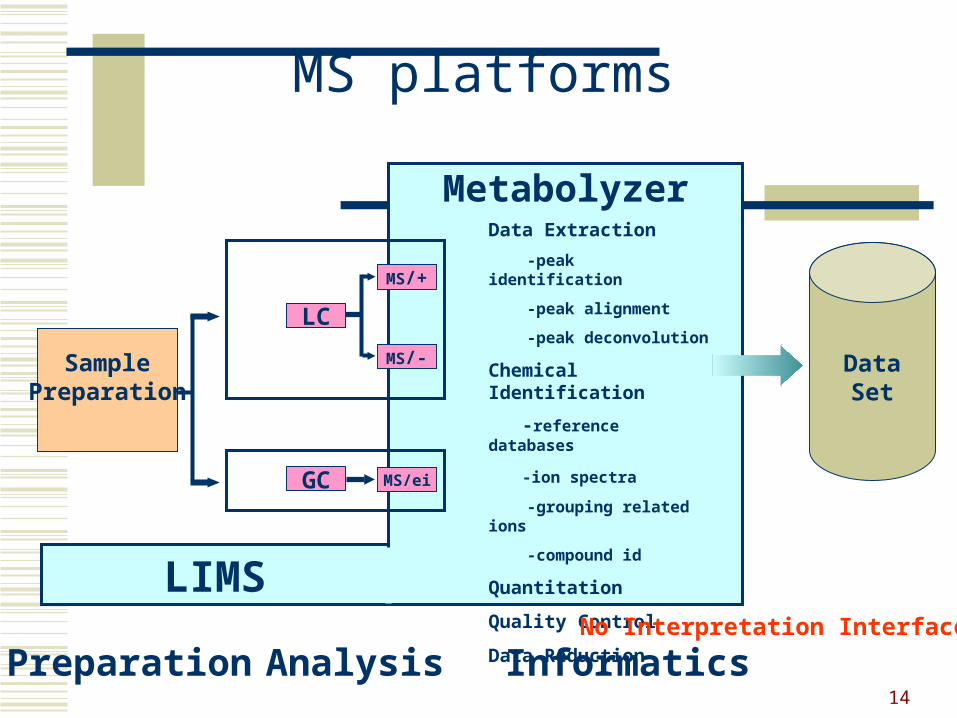
MS platforms
SamplePreparation
GC MS/ei
DataSet
Metabolyzer
LC
MS/+
MS/-
Data Extraction
-peak identification
-peak alignment
-peak deconvolution
Chemical Identification
-reference databases
-ion spectra
-grouping related ions
-compound id
Quantitation
Quality Control
Data Reduction
Preparation Analysis Informatics
LIMSNo Interpretation Interface

15
Data Collection and Measurement Issues
The sample prep involves stabilizing the sample, adding spiked-in calibrants, and creating multiple aliquots (some are frozen) for QC purposes. This is roboticized.
Sources of error in this step include: within-subject variation within-tissue variation contamination by cleaning solvents calibrant uncertainty evaporation of volatiles.

16
Data Collection and Measurement Issues
The result of this is a set of m/z ratios and timestamps for each ion, which can be viewed as a 2-D histogram in the m/z x time plane.
One now estimates the amount of each metabolite. This entails normalization, which also introduces error.
The caveats pointed out in Baggerley et al. (Proteomics, 2003) apply.
17
Data Collection and Measurement Issues
Baseline correction Alignment Estimating quantity of specific metabolites.
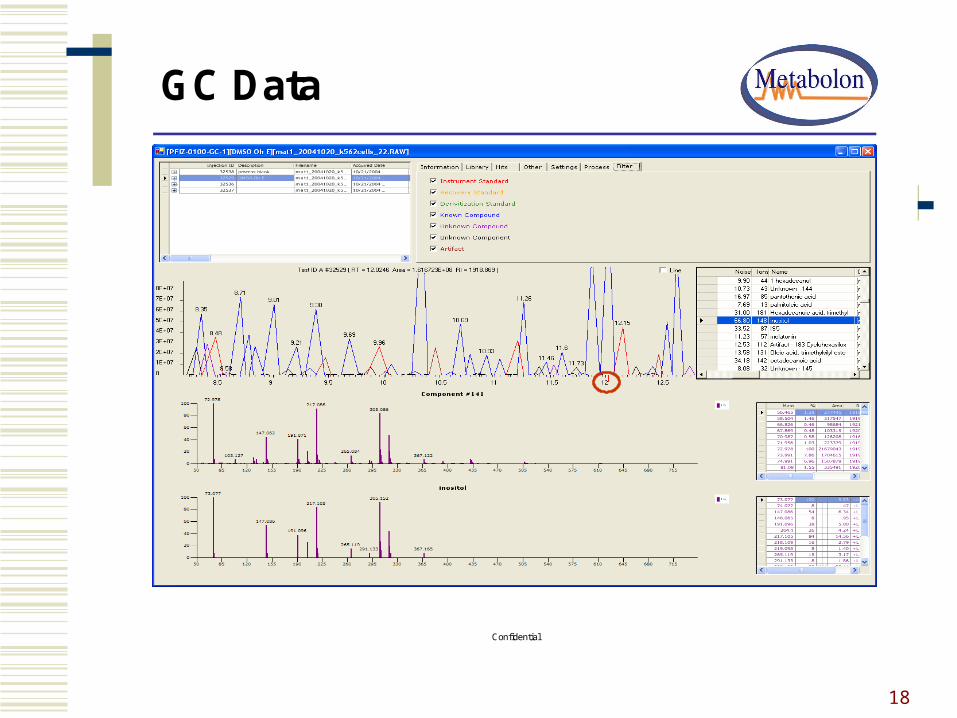
18
Confidential
GC Data
19
Data Collection and Measurement Issues
Let z be the vector of raw data, and let x be the estimates. Then the measurement equation is:
G(z) = x = µ + ε where µ is the vector of unknown true values and ε
is decomposable into separate components.
For metabolite i, the estimate Xi is:
gi(z) = lnΣ wij ∫∫sm(z) – c(m,t)dm dt.
20
Data Collection and Measurement Issues
The law of propagation of error (this is essentially the delta method) says that the variance in X is about
Σni=1 (∂g /∂ zi)2 Var[zi] +
Σi≠k 2 (∂g/∂zi)(∂g/∂zk) Cov[zi, zk]
The weights depend upon the values of the spiked in calibrants, so this gets complicated.

21
Data Collection and Measurement Issues
Cross-platform experiments are also crucial for medical use. This leads to key comparison designs. Here the same sample (or aliquots of a standard solution or sample) are sent to multiple labs. Each lab produces its spectrogram.
It is impossible to decide which lab is best, but one can estimate how to adjust for interlab differences.
22
Data Collection and Measurement Issues
The Mandel bundle-of-lines model is what we suggest for interlaboratory comparisons. This assumes:
Xik = αi + βi θk + εik
where Xik is the estimate at lab i for metabolite k, θk is the unknown true quantity of metabolite k, and
εik ~ N(0,σik2).
23
Data Collection and Measurement Issues
To solve the equations given values from the labs, one must impose constraints. A Bayesian can put priors on the laboratory coefficients and the error variance.
Metabolomics needs a multivariate version, with models for the rates at which compounds volatilize.
24
Confidential
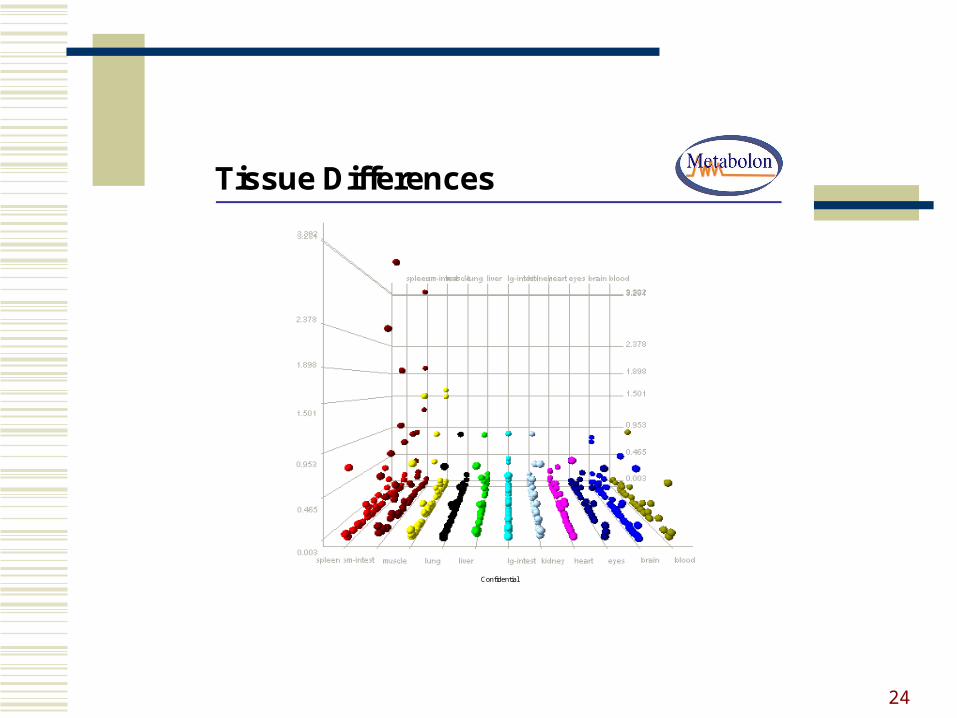
Tissue Differences

25
Cancer Type - CNS cancer
Cancer Type - leukemia
Cancer Type - ovarian cancer
Cancer Type - breast cancer
Cancer Type - melanoma
Cancer Type - prostate cancer
Cancer Type - colon cancer
Cancer Type - non small cell lung cancer
Cancer Type - renal cancer
26
Statistical issues
Many missing values!!! Outliers Distribution of metabolites are not normally
distributed n<p Correlated metabolites
27
Statistical Issues
PCA or ICA Partial Least Squares Clustering Random Forest, SVM rSVD

28
Statistical issues
Dealing with missing values Replacing missing values by 0’s is not
necessarily a good idea. Not truly 0. Minimum, half-min, uniform(0, minimum) Random forest imputation Observing conditional distribution (Dr.
Young Truong at UNC)
29
Statistical Issues
Prediction and Classification Partial least squares Random Forest SVM Neural networks
30
Statistical Issues
Identifying relationships MDS Clustering rSVD (PowerMV from NISS)
31
ALS metabolomic data set
We had abundance data on 317 metabolites from 63 subjects. Of these, 32 were healthy, 22 had ALS but were not on medication, and 9 had ALS and were taking medication.
The goal was to classify the two ALS groups and the healthy group.
Here p>n. Also, some abundances were below detectability.
32
ALS metabolomic data set
Using the Breiman-Cutler code for Random Forests, the out-of-bag error rate was 7.94%; 29 of the ALS patients and 29 of the healthy patients were correctly classified.
20 of the 317 metabolites were important in the classification, and three were dominant.
RF can detect outliers via proximity scores. There were four such.
33
ALS Metabolomic data set
Several support vector machine approaches were tried on this data:
Linear SVM Polynomial SVM Gaussian SVM L1 SVM (Bradley and Mangasarian, 1998) SCAD SVM (Fan and Li, 2000)
The SCAD SVM had the best loo error rate, 14.3%.

34
ALS Metabolomic data set
Robust SVD (Liu et al., 2003) is used to simultaneously cluster patients (rows) and metabolites (columns). Given the patient by metabolite matrix X, one writes
Xik = ri ck + εik
where ri and ck are row and column effects. Then one can sort the array by the effect magnitudes.
35
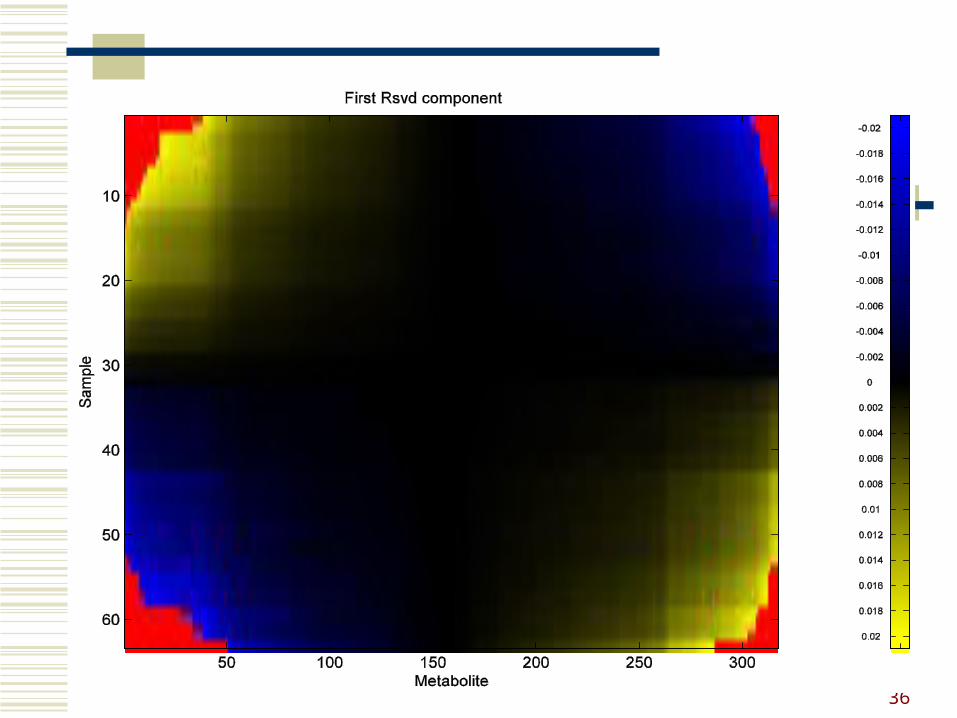
ALS metabolomic data set
To do a rSVD use alternating L1 regression, without an intercept, to estimate the row and column effects. First fit the row effect as a function of the column effect, and then reverse. Robustness stems from not using OLS.
Doing similar work on the residuals gives the second singular value solution.
36
37
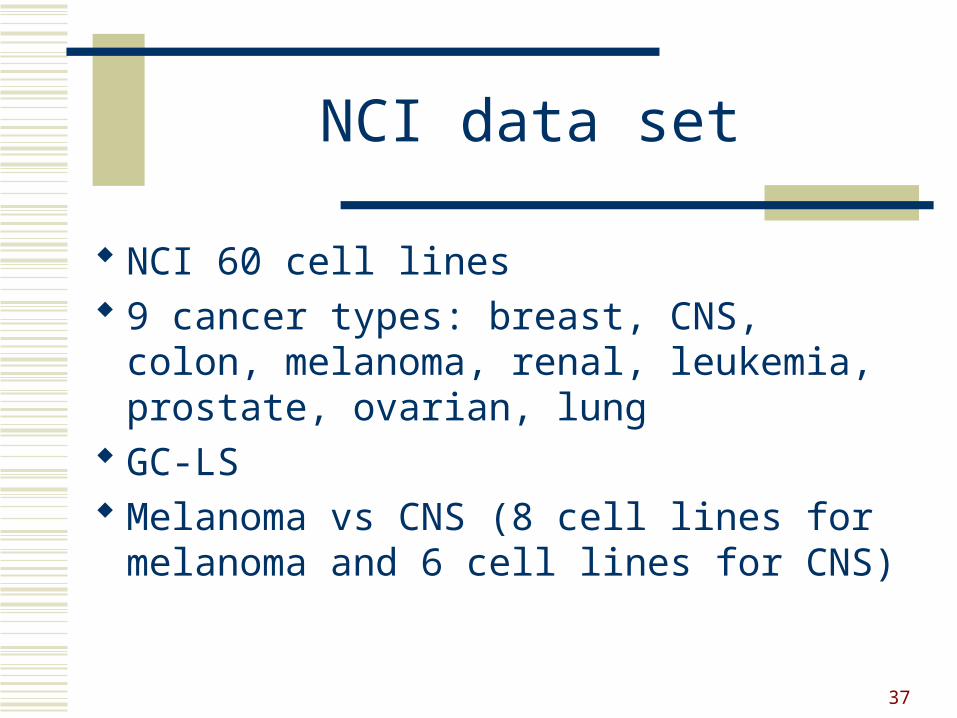
NCI data set
NCI 60 cell lines 9 cancer types: breast, CNS, colon,
melanoma, renal, leukemia, prostate, ovarian, lung
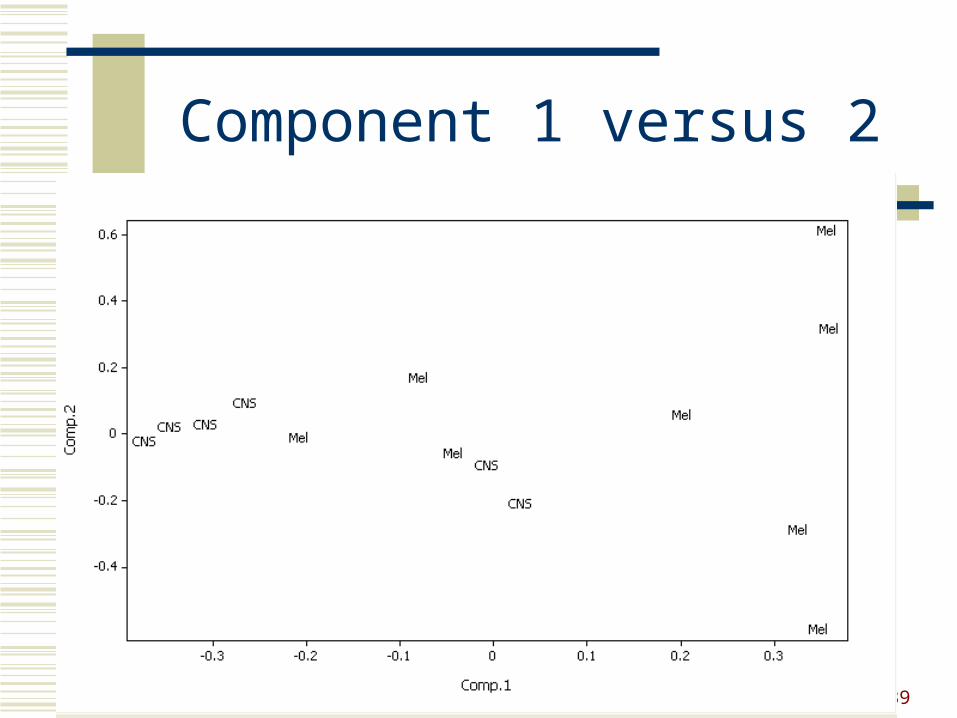
GC-LS Melanoma vs CNS (8 cell lines for
melanoma and 6 cell lines for CNS)
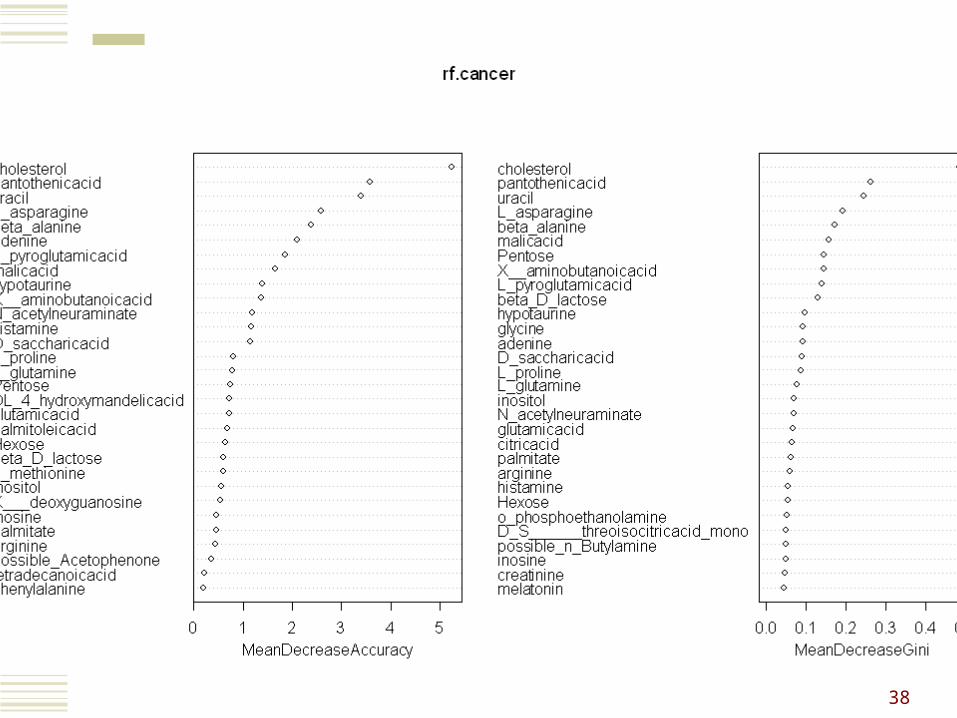
38
Variable Importance using RF
39
Component 1 versus 2
40
Useful websites
Deconvolution of peaks, software AMDIS (http://chemdata.nist.gov/massspc/amdis; NIST, Gaithersburg, USA)
Human Metabolome database (www.hmdb.ca) KEGG (www.genome.jp/kegg) http://www.niss.org/PowerMV/ Many, many others
41
Concluding Remarks
Many interesting statistical issues still need to be addressed. Measurement issues and interlaboratory
differences need to be properly addressed. Statistical issues in analyzing metabolomic data
still remain an interesting challenge. Metabolomics is an important part in
understanding systems biology.