1 measuring the resource intensity of production and ... · pdf file1 measuring the resource...
TRANSCRIPT

1
Measuring the resource intensity of production and consumption
Edgar G. Hertwich
Edgar,hertwich@ntnu,no, www,ntnu,no/indecol
Edgar G. Hertwich
Industrial Ecology ProgrammeNorwegian University of Science and Technology
OECD/UNEP conference on resource efficiencyParis 23-25 April 2008

2
Outline
• Tools for resource efficiency• The value chain• Resource use and value added• E2 vector – resource efficiency graphs
Edgar,hertwich@ntnu,no, www,ntnu,no/indecol
• E2 vector – resource efficiency graphs• Relating production and consumption• The impacts of consumption• Conclusions
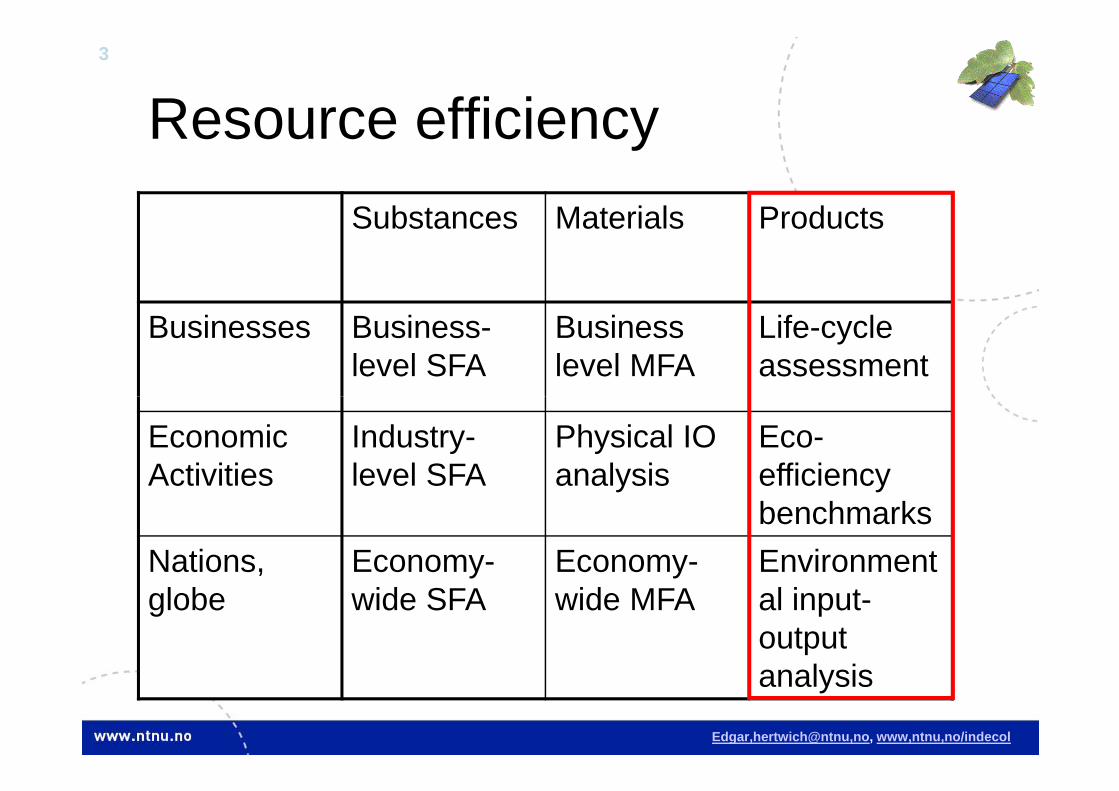
3
Resource efficiency
Substances Materials Products
Businesses Business-level SFA
Business level MFA
Life-cycle assessment
Edgar,hertwich@ntnu,no, www,ntnu,no/indecol
Economic Activities
Industry-level SFA
Physical IO analysis
Eco-efficiency benchmarks
Nations, globe
Economy-wide SFA
Economy-wide MFA
Environmental input-output analysis

4
Resources
• Biotic resources• Fossil resources• Mineral resources• Land
Edgar,hertwich@ntnu,no, www,ntnu,no/indecol
• Land• Water• Air• Health, functioning ecosystems, genetic
diversity, life-support systems

5
Production & Consumption
Resources
TransportConsumption
add
ed
Waste treatment
Edgar,hertwich@ntnu,no, www,ntnu,no/indecol
HealthProduction
Val
ue a
Value chain
Waste treatment

6
Resource intensity definedur
ce u
se
This definition is standard for energy intensity and has become well established as emissions intensity.
Edgar,hertwich@ntnu,no, www,ntnu,no/indecol
Res
ourc
Value added
intensity Resourceadded Value
use Resource ≡
efficiency Resourceuse Resource
added Value ≡

7
The Eco-Efficiency Vector Chemical
base products
Agri-culture
Electricity
Transport and storage
E2 vector for the Netherlands
Direct environmental impacts divided byvalue added per industrysector
ce u
se
Edgar,hertwich@ntnu,no, www,ntnu,no/indecol
53 other sectors, invisible
and storage
Oil and gas extraction
Business services
Trade
Value creation
Mark Goedkoop, PRe
Res
ourc
e

8
The Importance of Industriesso
urce
use
Business services
Oil & Gas
Transport
Electricity
Trade
Edgar,hertwich@ntnu,no, www,ntnu,no/indecol
Res
o
E2 vector for the Netherlands
Mark Goedkoop, PReChemicals
Agriculture
Value added
The Netherlands

9
The Importance of Goodsso
urce
use
Buildings&furniture
Oil & Gas
Transport
Food
Trade and services
Edgar,hertwich@ntnu,no, www,ntnu,no/indecol
Res
o
Hypothetical E2 vectorsfor all goods consumedin the Netherlands
Chemicals
Electricity
Consumption Expenditure
The Netherlands

10
Resource intensity of a productrc
eus
e
Car life cycle
RecyclingInsurance & fees
Driving
Edgar,hertwich@ntnu,no, www,ntnu,no/indecol
Value added
Res
ourc Car life cycle
Gasoline
Car manufacturing

11
Why is this relevant?
• Resource/pollution intensity can be consistently defined across various scales.– For a company, it is resource use per value added
of the company.– For a product, it is life-cycle resource use per unit
Edgar,hertwich@ntnu,no, www,ntnu,no/indecol
– For a product, it is life-cycle resource use per unit cost of the product
– For an industry, it is total resource use divided by total value added in the industry
– For a nation, it is total resource use divided by GDP.

12
Vector addition
• The total resource use of a country can be defined as the sum of individual resource use
VA(B)VA(A)
RU(B)RU(A))(
++=+ BARI
Edgar,hertwich@ntnu,no, www,ntnu,no/indecol
the sum of individual resource use• The total value added of a country can be defined as
the sum of value added in all economic activity going on in a country
• It is meaningful to compare the RI of a product or company to the RI of products, companies, industries, and countries.

13
Input-output analysis
… allows us to convert the resource intensity of industries in an economy to the resource intensity of goods produced by the economy.
Life cycle assessment… allows us to convert the resource intensity of
Edgar,hertwich@ntnu,no, www,ntnu,no/indecol
… allows us to convert the resource intensity of processes to the resource intensity of product systems.
Hybrid IO-LCA… can bridge any scale in between and consistently
analyse activities across scales.

14
Production & Consumption
The resources used in the production of goods=
The resource footprint caused by the consumption of the goods
Edgar,hertwich@ntnu,no, www,ntnu,no/indecol
The value added in the production of goods=
The price of the goods to the consumer

15
Prioritization
Scientific prioritization of products and resources from an environmental sustainability point of view
Edgar,hertwich@ntnu,no, www,ntnu,no/indecol
• Input-output based studies have been used to identify the product and final demand categories that cause the largest impacts.
• EIPRO study

16
Emissions from Norwegian household consumption
60 %
80 %
100 %
Other
Recreation
Other mobility
5.2 t/p 14 kg/p 23 kg/p
Edgar,hertwich@ntnu,no, www,ntnu,no/indecol
0 %
20 %
40 %
60 %
CO2 SO2 Nox
Other mobility
Vehicle fuel
Care
Clothing
Food
Other shelter
Household energy

17
40 %
60 %
80 %
100 %
O2
Em
issi
on
s (t
/cap
ita-
y) Other
Recreation
Other mobility
Vehicle fuel
Care
Clothing
Food
Other shelter
7.1 21 8.5 8.0 5.2 5.4 4.8 3.9 7.8 5.6 24
Edgar,hertwich@ntnu,no, www,ntnu,no/indecol
CO2 emissions in tons per capita and year
0 %
20 %
A 2
000
AU
S 9
3/94
D 1
990
DK
199
2
F 1
990
JP 1
995
T
JP 1
995
N
N 2
000
NL
1990
SK
200
0
US
A 1
997
CO Other shelter
Household energy
1
Hertwich (2005) Environmental Science & Technology

18
Prioritization – what do we know?
• Limited number of environmental pressures is considered
• Studies consistently find that the most important areas are– Buildings, including energy use in buildings, constr– Food
Edgar,hertwich@ntnu,no, www,ntnu,no/indecol
– Food– Transportation
• Poor countries: food is important• Rich countries: transportation important• Geographical factors, like density and climate,
influence results.

19
Conclusions
• Input output analysis and hybrid analysis let us consistently define resource intensity.
• Resource intensity can be calculated for, and compared among, individual processes, facilities, consumption activities, households,
Edgar,hertwich@ntnu,no, www,ntnu,no/indecol
facilities, consumption activities, households, regions, industry sectors, and nations.
• Useful information also for local decision makers, e.g. in municipalities or corporate purchasing departments

20
Edgar,hertwich@ntnu,no, www,ntnu,no/indecol

21
The Norwegian Economy
10
12
14
16
ion
s [M
t]
Oil&gas
Water transport
Edgar,hertwich@ntnu,no, www,ntnu,no/indecol
0
2
4
6
8
0 50 100 150 200 250 300 350
Value added [billion Kr]
CO
2 em
issi
o
ConstructionTrade
Land transportChemicals
Real estate and services

22
Economic activity caused by consumption
( )-1
x = Ax + y
x = I - A yx … Economic output of each industry sectory … Final consumption of each sectors outputA … Coefficient matrix, indicating the inputs
required to produce one unit of outputin each industry sector.
Edgar,hertwich@ntnu,no, www,ntnu,no/indecol
Input-output economics and life-cycle assessment have a similar mathematical structure. We assume a linear relationship of the flows among different nodes in a
production network.
in each industry sector.

23
Value added
• We can do the same for value added (e.g. labour)
ii
vF
x=
Edgar,hertwich@ntnu,no, www,ntnu,no/indecol
ix
• Notice we normalize with respect to output (x) and not demand (y), so…
( ) 1v Fx F I A y
−= = −

24
Life cycle assessment of consumption
1
Edgar,hertwich@ntnu,no, www,ntnu,no/indecol
( ) 1
LCI y−= CS I - A

25
Modelling the entire life-cycle
Contrary to IO analysis, the A matrix also includes processes in households, such as the heating of a frozen
... Pizza
Electrici
ty
Waste
mgm
t
...
Dinner
...Pizza apdA A
Edgar,hertwich@ntnu,no, www,ntnu,no/indecol
the heating of a frozen pizza or the combustion of fuel in a moped.
Pizza apd
Electricity
aed
Waste mgmt
...Dinner adw
Aii Aih
AhhAhi

26
Technology
1 2 FD Output
1 0.15 0.625 175 500
2 0.08 0.05 340 400
Edgar,hertwich@ntnu,no, www,ntnu,no/indecol
VA 0.13 0.35 0 205
CO2 1.0 0.1 10
Manufacturing uses electricity intensively
Electricity is CO2intensive

27
Driving Car manu Petrol Final demand
Driving 0 1
Car manu 1
Edgar,hertwich@ntnu,no, www,ntnu,no/indecol
Petrol 10
VA 0
RU 10