1 leed vs. energy star: a cost/benefit analysis of
TRANSCRIPT

1
LEED VS. ENERGY STAR: A COST/BENEFIT ANALYSIS OF SUSTAINABILITY LABELS FOR COMMERCIAL BUILDINGS
By
Stephen R. Hiser
Dr. Paul A. Baker, Advisor May 2011
This Masters Project is being submitted in partial fulfillment of requirements for Duke University’s concurrent Master of Environmental Management and Master of Business
Administration degree program.
The Nicholas School of the Environment The Fuqua School of Business
Duke University 2011
___________________________________________________________ Dr. Paul A. Baker

2
ABSTRACT Existing commercial buildings are at the forefront of efforts to address climate change through the implementation of energy efficiency upgrades and other sustainability measures. These efforts have been supported by both public and private organizations, and appear to be gaining momentum as the United States continues to search for ways to make its existing and future infrastructure more sustainable. As a result of the push for more green buildings, many real estate investors have elected to pursue sustainability labels for their existing building portfolios, including the ENERGY STAR rating and Leadership in Energy and Environmental Design - Existing Buildings: Operations & Maintenance (LEED-EBOM) certification. These labels are designed to certify and verify a commercial building’s operating efficiency with respect to sustainability and environmental impact. There is much industry speculation over whether these labels contribute to overall building value for the investor, and if other intangible benefits exist for owners/operators and/or building occupants. This project attempts to provide institutional real estate investors, such as real estate investment trusts (REITs), with general guidelines for selecting one of the aforementioned sustainability labels based on its potential contribution to building value and possible reductions in carbon dioxide emissions attributable to building operations. Analyses were conducted using fundamental real estate valuation models and industry data to evaluate financial and environmental costs and benefits associated with the ENERGY STAR and LEED-EBOM building labels. Financial costs and benefits were analyzed using the direct capitalization valuation model, as well as simple and discounted payback models. Other materials and resources associated with the ENERGY STAR and/or LEED-EBOM labels contributing to other possible benefits were analyzed qualitatively. The results of these analyses indicate that both the ENERGY STAR and LEED-EBOM labels may increase overall building value, while reducing operations-based carbon dioxide emissions. In addition, the results reveal that one label cannot be deemed absolutely superior to the other, and that selection depends upon other factors specific to the investor and/or building project. Based on these findings, a set of general guidelines has been provided to assist real estate investors evaluate the merits and drawbacks associated with the ENERGY STAR and LEED-EBOM sustainability labels for existing commercial buildings. It is my hope that these guidelines will enable real estate investors to make sound financial and environmental decisions when implementing strategies to make existing commercial building operations more sustainable.
3
ACKNOWLEDGEMENTS I would like to thank all of those who assisted me in the process of completing my Master’s Project – family, friends, and colleagues alike. I would like to offer special recognition to the following individuals for their support, contributions, and guidance. Dr. Paul A. Baker, Professor of Earth and Ocean Sciences, Duke University Brad A. Molotsky, Executive Vice President and General Counsel, Brandywine Realty Trust Suzanne Stumpf, Vice President – Asset Management, Brandywine Realty Trust Chantel Hull, Assistant Property Manager, Brandywine Realty Trust Daniel Kolomeets-Darovsky, Principal and Director of Research and Consulting, Selestos Group, Inc. Please note that organizations mentioned in the body of this report do not necessarily endorse the results, recommendations, and conclusions of this research. No sensitive or proprietary information has been included in the analyses that follow to protect the business interests of these organizations.

4
TABLE OF CONTENTS PURPOSE & SCOPE 5 INTRODUCTION & OBJECTIVES 5 BACKGROUND – ENERGY STAR 8 The History of ENERGY STAR 8 ENERGY STAR Ratings for Commercial Buildings 9 Qualifying for ENERGY STAR Eligibility 11 Attaining an ENERGY STAR Rating for Commercial Buildings 11 BACKGROUND – LEED 12 The History of LEED 12 The LEED Rating System 13 Qualifying for LEED-EBOM Eligibility 14 Attaining LEED-EBOM Certification for Commercial Buildings 15 HYPOTHESIS 16 MATERIALS & METHODS 16 Energy Consumption 17 Other Building Materials & Resources 19 ENERGY CONSUMPTION ANALYSIS 19 Introduction 19 Carbon Dioxide Emissions Abatement 20 Financial Analyses – Introduction 23 Direct Capitalization Valuation Analysis 23 Simple & Discounted Payback Analyses 27 Other Energy Efficiency Financial Considerations 29 OTHER MATERIALS & RESOURCES ANALYSIS 30 Introduction 30 Carbon Dioxide Emissions Abatement 31 Other Factors to Consider 34 Water Efficiency & Waste Reduction 35 Indoor Environmental Quality 37 Documentation Requirements & Human Resources 40 LIMITATIONS 41 DISCUSSION & RECOMMENDATIONS 43 CONCLUSION 45 EXHIBITS & APPENDICES 47 Annual Water Consumption Calculations 47 Energy Consumption: Direct Capitalization Model (Baseline) 48 Energy Consumption: Direct Capitalization Model (Energy Efficient) 49 Energy Consumption: Simple & Discounted Payback Analyses 50
Other Materials & Resources: Direct Capitalization Model (Baseline) 51 Other Materials & Resources: Direct Capitalization Model (Water/Energy Eff.) 52
REFERENCES 53

5
PURPOSE & SCOPE
The purpose of this research was to analyze the costs and benefits associated with
the Leadership in Energy and Environmental Design (LEED) and ENERGY STAR1
sustainability certifications for existing commercial buildings, and to directly compare the
results. Using these results, owners/operators of commercial real estate buildings were
provided with reliable recommendations as to which of these two sustainability
certifications provides the most effective combination of carbon dioxide equivalent
emissions abatement and cost savings (or cost added) to the firm and/or investor. In
addition, part of the project assessed other select extended or intangible environmental
and financial costs and/or benefits associated with the ENERGY STAR and LEED
certifications for commercial buildings. It should be noted that a limited portion of the
LEED-EBOM project scope was considered, as the primary focus of this research was to
assess financial synergies achieved as a result of carbon dioxide emissions abatement
attributable to sustainable commercial building operations. No proprietary or sensitive
data was used to conduct the analyses that follow, as this is forbidden according to the
Masters Project guidelines set forth by The Nicholas School of the Environment at Duke
University.
INTRODUCTION & OBJECTIVES
Prior to enrolling at Duke University’s Fuqua School of Business and Nicholas School
of the Environment, I worked for approximately six years in the real estate brokerage and
real estate finance industries, first as a Real Estate Site Analyst Intern locating prospective
locations for retail tenants, and secondly as a Real Estate Analyst, underwriting
1ENERGY STAR is a registered trademark of the United States Environmental Protection Agency.

6
Commercial Mortgage-Backed Securities (CMBS) loans. Though I enjoyed my career in
these industries, my interest in sustainability led me to enroll at Duke University with the
intention of acquiring a skill set that would enable me to better understand sustainability
as it relates to real estate investment and operations.
During the summer of 2010, I had the opportunity to serve as Brandywine Realty
Trust’s Sustainability Intern. Brandywine is a large publicly traded real estate investment
trust (REIT) headquartered in Radnor, PA. Brandywine owns, develops, and manages Class
A suburban and urban office buildings, and boasts a portfolio which includes more than
340 properties (35 million square feet) in select markets across the United States.2 My
primary responsibilities with Brandywine were:
1. Help develop and support Brandywine’s corporate sustainability initiative and related strategies.
2. Conduct research to quantify potential cost savings synergies, property value benefits,
and environmental impacts associated with green building practices.
3. Manage the composition and distribution of company-wide communications regarding sustainability initiatives.
While working for Brandywine, I learned about the specific steps the firm and its
competitors were taking to work toward a more sustainable and environmentally friendly
business plan for real estate operations. Through my work experience with Brandywine, it
became evident that large real estate firms owning and operating properties (mainly
REITs) were utilizing sustainability certifications for buildings as a primary way to “green”
their businesses. Based on further analysis of Brandywine and its competitors, it appears
the two most common sustainability labels being sought are the LEED certification
provided by the U.S. Green Building Council (USGBC), and the ENERGY STAR rating
2 Brandywine Realty Trust, 2010
7
provided by the U.S. Environmental Protection Agency (EPA) and U.S. Department of
Energy (DOE). Examples of large real estate firms, many of which compete directly with
Brandywine Realty Trust, that have invested in one or both the LEED and/or ENERGY STAR
label include Mack-Cali Realty Corporation,3 Liberty Property Trust,4 Highwoods
Properties,5 Macerich,6 Boston Properties,7 Pennsylvania Real Estate Investment Trust
(PREIT),8 Vornado Realty Trust,9 Hines Real Estate Investment Trust,10 and Wells Real
Estate Investment Trust.11 Industry investment in LEED and ENERGY STAR labels has been
so substantial that the National Association of Real Estate Investment Trusts (NAREIT) has
sponsored an annual competition among member organizations designed to recognize
those firms which demonstrate “superior and sustained energy use practices”.12 The
competition, named the Leader in the Light Awards, is held and judged in cooperation with
the EPA’s ENERGY STAR program.13
While both the LEED and ENERY STAR certifications are known and respected as
true sustainability labels for commercial buildings, they are fundamentally different in
terms of scope of work and requirements, capital investment, time and human resources,
and operational efficiency. With LEED and ENERGY STAR seemingly leading the way in
terms of sustainability certification programs for commercial buildings, these differences
between the two labels raise several questions:
3 Mack-Cali Realty Corporation, 2010
4 Liberty Property Trust, 2011
5 Highwoods Properties, 2011
6 Macerich, 2011
7 Boston Properties, 2011
8 “PREIT’s 801 Market Street Building Earns LEED Gold”, 2010
9 Vornado Realty Trust, 2011
10NAREIT, 2010
11NAREIT, 2010
12NAREIT, 2010
13NAREIT, 2010

8
1. Why should a real estate owner/operator invest in a sustainability label for an existing commercial building?
2. What are the processes for obtaining a LEED and/or ENERGY STAR label for an existing
commercial building? How do these processes differ?
3. What are the costs and benefits associated with the LEED and ENERY STAR labels? How do these factors impact real estate owners/operators?
4. Can cost savings synergies be achieved with LEED and/or ENERGY STAR labels for
existing commercial buildings? If so, is building value improved?
5. Of the two labels, which is the better overall investment for a real estate owner/operator? What other factors must be considered before making an investment in a LEED or ENERGY STAR label? Are there scenarios in which one label is more competitive over the other?
The following analyses will yield answers to as many of these questions as possible,
and in the process, provide owners and/or operators of commercial buildings with general
guidelines for investing in one of the two aforementioned sustainability labels.
BACKGROUND – ENERGY STAR The History of ENERGY STAR The ENERGY STAR program was jointly founded in 1992 by the EPA as a voluntary
labeling initiative designed to way to promote energy efficiency in a variety of products,
and reduce greenhouse gas (GHG) emissions attributable to the operation of these
products.14 The first products to be targeted by the ENERGY STAR program were
computers and computer monitors, but the label has since been expanded to include a
variety of appliances, office equipment, lighting equipment, heating and cooling equipment,
electronics, and residential and commercial buildings.15 Much of this expansion occurred
14
U.S. EPA and U.S. DOE, 2011 15
U.S. EPA and U.S. DOE, 2011

9
after DOE formally joined the ENERGY STAR program as a partner organization in 1996.16
ENERGY STAR for buildings was first introduced in March 1995,17 and merged with the
EPA’s Green Lights program to encourage the installation of energy efficient lighting
technologies at the facilities of U.S. corporations.18 Through the late 1990s, the ENERGY
STAR for buildings program was expanded to include certifications for manufactured
homes, office buildings schools, grocery stores, hospitals, and hotels that perform in the top
25% of the market (with respect to energy efficiency), and home builders.19 In 1999, the
first commercial building was awarded ENERGY STAR certification.20 As of year-end 2009,
approximately 9,000 commercial buildings representing 1.6 billion square feet of space
achieved ENERGY STAR certifications in the United States.21
ENERGY STAR Ratings for Commercial Buildings
The EPA rates the performance of commercial buildings with respect to energy
efficiency on a scale of 1 to 100, with 1 being the lowest possible score, and 100 being the
highest possible score.22 These ratings essentially correspond to the relative operating
efficiency of the facility with respect to energy as compared to other similar buildings. For
example, a rating of 65 means that a particular building performs more efficiently than
65% of similar buildings in the United States.23 A rating of 45 means that a particular
building performs more efficiently than 45% of similar buildings. Hence, a rating of 50
16
U.S. EPA and U.S. DOE, 2011 17
U.S. EPA and U.S. DOE, 2011 18
Dazor, 2011 19
U.S. EPA and U.S. DOE, 2011 20
ENERGY STAR 2009 Annual Report, 2010 21
ENERGY STAR 2009 Annual Report, 2010 22
U.S. EPA and U.S. DOE, 2011 23
U.S. EPA and U.S. DOE, 2011

10
denotes “average energy performance”.24 It is this rating system which is used to
determine which buildings qualify for ENERGY STAR certifications. To achieve an ENERGY
STAR label, a building must achieve a score of 75, thus meaning that its performance is in
the top 25% of similar buildings.25
To determine these ratings, the EPA uses a tool called Portfolio Manager. Portfolio
Manager is a system that is designed to help the EPA, as well as building owners/operators,
track and analyze energy and water consumption, related costs, and resulting GHG
emissions in one or more buildings owned by a particular entity (i.e. a REIT).26 The process
of collecting this data using Portfolio Manager is called “benchmarking”.27 Once the
benchmarking process has been completed, the EPA uses the Portfolio Manager outputs in
conjunction with DOE’s Commercial Building Energy Consumption Survey (CBECS) to place
a building (or buildings) in a peer group.28 The CBECS is a national survey conducted every
four years by the Energy Information Administration (EIA) to gather data on building
locations, energy consumption, and other operational characteristics from commercial
buildings across the United States.29 Individual buildings are placed into peer groups using
the CBECS to identify other buildings that exhibit similar energy consumption and/or
operating characteristics. A building’s operating data, stored in Portfolio Manager, is then
used to assess its performance relative to its peer group, and a final rating is provided.
24
U.S. EPA and U.S. DOE, 2011 25
U.S. EPA and U.S. DOE, 2011 26
U.S. EPA and U.S. DOE, 2011 27
U.S. EPA and U.S. DOE, 2011 28
U.S. EPA and U.S. DOE, 2011 29
U.S. EPA and U.S. DOE, 2011

11
Qualifying for ENERGY STAR Eligibility
In order for a commercial building to qualify for ENERGY STAR eligibility, it must
meet the following general criteria:
1. The building must be in use as a bank/financial institution, courthouse, data center, hospital, hotel, place of worship, school (K-12), medical office, wastewater treatment facility, office, dormitory/residence hall, retail store, supermarket, or warehouse.30
2. The building must meet the EPA’s minimum operating characteristics according to its
given definition in item 1 above.31
3. The building must be benchmarked with Portfolio Manager. At least 11 consecutive months of energy operating data need to be collected for all active meters on the property.32
Each of these criteria allow for certain exceptions in special cases. However, these
exceptions are beyond the scope of this report, and are not crucial to the research
conducted here.
Attaining an ENERGY STAR Rating for Commercial Buildings Applying for and obtaining an ENERGY STAR rating for a commercial building is a
six step process that involves the following actions:33
1. An applicant must determine if the prospective building(s) meet the eligibility requirements listed in the previous subsection of this report.
2. The prospective building(s) must be benchmarked using Portfolio Manager.
3. A baseline rating for the building(s) must be obtained based on the completed
benchmarking data obtained in step 2. The rating must be at least 75 for the prospective building(s) to be considered for an ENERGY STAR rating.
4. A licensed engineer or architect must validate that all energy and operating data, as
well as basic building characteristics, have been collected properly in step 3. The
30
U.S. EPA and U.S. DOE, 2011 31
U.S. EPA and U.S. DOE, 2011 32
U.S. EPA and U.S. DOE, 2011 33
U.S. EPA and U.S. DOE, 2011
12
licensed professional must certify two EPA forms called the Statement of Energy Performance (SEP) and the Data Checklist to confirm that all collected data is accurate.
5. The applicant must certify to having read and understood all ENERGY STAR identity
guidelines.
6. The applicant must send a signed Letter of Agreement (obtained from Portfolio Manager), and certified SEP and Data Checklist to the EPA within 120 days of completion for final processing, review, and approval.
If all requirements are met, the EPA can then elect to award an ENERGY STAR rating to the
building(s) in question. It should be noted, however, that this certification is valid for one
year, and that applicants must re-apply on an annual basis to maintain an ENERGY STAR
label. The EPA continuously conducts audits on buildings which have earned ENERGY
STAR status to ensure that standards are not compromised.
BACKGROUND – LEED
The History of LEED
Development of the LEED sustainability label for buildings began based on the
research of Robert K. Watson, a senior scientist at the Natural Resources Defense Council
(NRDC).34 Upon the founding of the USGBC in 1993, the LEED initiative was formalized as
an effort to establish uniform and measurable standards for recognizing environmentally
friendly buildings.35 Over the course of its 18 year existence, the USGBC has developed
three main versions of LEED, with the most recent of these being released on April 27,
2009.36 The development of these successive versions of the LEED certification has
enabled the USGBC to implement the latest in best practices and technologies for green
34
“LEED History”, 2009 35
Kay, 2008 36
“LEED Version 3”, 2009

13
building.37 According to the USGBC’s reporting figures, there are currently 6,920 projects
in the United States which have received some level of LEED certification.38
The LEED Rating System The LEED rating system encompasses eight categories, which include the following
project types: LEED for New Construction, LEED for Existing Buildings: Operations &
Maintenance, LEED for Commercial Interiors, LEED for Core & Shell, LEED for Schools,
LEED for Retail, LEED for Healthcare, LEED for Homes, and LEED for Neighborhood
Development. For the purpose of this research, I have elected to focus on the LEED for
Existing Buildings: Operations & Maintenance (LEED-EBOM) category, as the majority of
large real estate owners/operators, such as REITs, already hold and operate large
portfolios of existing commercial buildings with the potential for renovation to meet LEED-
EBOM standards. It also appears that, for the sake of this report, LEED-EBOM will allow for
the best direct comparison to ENERGY STAR standards.
LEED-EBOM is designed to help building owners/operators manage operations,
maintenance, and other improvements in a way that maximizes operational efficiency and
minimizes adverse environmental impacts.39 Examples of issues addressed by LEED-EBOM
include waste management, chemical use, occupant comfort, and building systems
(electronic and mechanical).40 LEED-EBOM certification is based on a checklist of items in
seven distinct categories. These categories include: Sustainable Sites, Water Efficiency,
Energy and Atmosphere, Materials and Resources, Indoor Environmental Quality,
37
“LEED Version 3”, 2009 38
USGBC, 2011 39
USGBC, 2011 40
USGBC, 2011

14
Innovation in Operations, and Regional Priority Credits.41 Each of these categories contains
specific line items that are called “credits”. There are a total of 110 credits across all seven
categories of the checklist.42 LEED-EBOM certifications are awarded to building
owners/operators based on their ability to earn credits. As more credits are obtained, the
building’s certification level rises. There are four certification levels. These include LEED-
EBOM Certified, LEED-EBOM Silver, LEED-EBOM Gold, and LEED-EBOM Platinum.43 The
minimum requirements for the various levels of LEED-EBOM certification are as follows:44
LEED-EBOM Certified 40 to 49 credits LEED-EBOM Silver 50 to 59 credits LEED-EBOM Gold 60 to 79 credits LEED-EBOM Platinum 80 to 110 credits Qualifying for LEED-EBOM Eligibility LEED-EBOM is a certification program targeted at commercial buildings with one or
more tenants. To qualify for LEED-EBOM eligibility, a prospective building must meet the
following criteria:45
1. The prospective building must maintain an average occupancy rate of at least 75% (based on square footage) over a period of 12 consecutive months prior to the submission of the certification application. Space that is leased, but not occupied by a tenant, is not included in the occupancy calculations. It should be noted that the original 75% minimum occupancy standard was reduced to 50% as of September 2009 according to the approval of the LEED Steering Committee.46
2. The project scope must include 100% of the total floor area in the building, including
common areas and vacant space. A 10% exemption may be granted for buildings that are partially managed by outside parties or multi-tenant properties. No other exemptions are permitted.
41
USGBC, 2009 42
USGBC, 2009 43
USGBC, 2009 44
USGBC, 2009 45
USGBC, 2009 46
Fuertes, 2009

15
3. The prospective building must be in compliance with all federal, state, and local ordinances pertaining to building codes and environmental regulations.
For the purpose of this report, it is assumed that all LEED-EBOM projects include 100% of
the floor space in the scope of the work. Further, it is assumed that all projects involve
multi-tenant buildings, as this property type is typical of the portfolios of most major REITs
and property management organizations.
Attaining LEED-EBOM Certification for Commercial Buildings
Applying for and obtaining a LEED-EBOM certification for a commercial building
involves the following actions:47
1. An applicant must determine if the prospective building(s) meet the eligibility requirements listed in the previous section of this report.
2. Operations data must be supplied over the pre-determined “performance period” set
forth by the USGBC. Required performance periods vary by credit category and type, and last from three to 24 months in duration. In general, it is suggested that LEED-EBOM certification applicants extend performance periods as long as possible, as this should yield more convincing and valuable operations data for the prospective building.
3. All required USGBC submittal templates must be completed, certified by the applicant,
and submitted for final review and approval. These materials include items such as a project narrative detailing the history, description, and scope of the project, and completed LEED-EBOM credit checklist.
Once these general requirements are met, the USGBC may elect to award a LEED-EBOM
certification to the building in question. It should be noted, however, that this certification
is valid for up to five years, and that applicants must re-apply at least once over this time
period to maintain a LEED-EBOM label.48
47
USGBC, 2009 48
USGBC, 2009

16
HYPOTHESIS
Based on my understanding of both conventional and green real estate operations
and finance, I hypothesize that the ENERGY STAR rating will be determined as the better
overall investment for real estate owners/operators, as compared to the LEED-EBOM
certification for the following reasons:
1. ENERGY STAR deals primarily with energy efficiency while the scope of LEED-EBOM extends to site selection, development/retrofitting processes, building management, and materials. According to the EPA, energy use in commercial buildings accounts for nearly half of all energy consumption in the United States.49 Based on this fact, it seems that increasing energy efficiency alone could result in the greatest financial and environmental benefit to building owners/operators. In other words, the incremental environmental benefits achieved by pursuing LEED-EBOM credits in areas other than energy efficiency may not make sense financially despite helping to make building operations more efficient overall.
2. According to the DOE, the primary source of more than half the electricity generation in
the United States is coal.50 The EIA also possesses data showing that coal has the highest carbon dioxide emissions factor among fuels used to generate electricity.51 Combine these facts with EIA data showing that electricity accounts for up to 66% of energy use in commercial buildings,52 and it is relatively easy to see that investing in energy efficiency upgrades could yield the most significant level of emissions abatement for building owners/operators.
3. REITs and other real estate organizations must work to remain profitable and satisfy
investor returns. Therefore it is important to balance the environmental benefits associated with capital investment decisions with investors’ expectations for financial returns. Based on the two points listed above, it seems that addressing the largest single contributor to a particular commercial building’s carbon footprint (energy consumption) will be most cost efficient for owners/operators.
MATERIALS & METHODS
To accomplish my research goals, I have made use of a variety of data resources
provided by accredited real estate industry sources, USGBC, EPA, and Brandywine Realty
49
U.S. EPA and U.S. DOE, 2011 50
U.S. DOE, 2011 51
U.S.EIA, 2011 52
U.S. EIA, 2000

17
Trust. These materials were used to compare and analyze the ENERGY STAR and LEED-
EBOM certifications across three criteria:
1. Energy consumption (carbon emissions abatement) 2. Energy consumption (operation costs and potential value generation) 3. Other building materials and resources These three criteria have been evaluated and compared using a variety of quantitative and
qualitative methods. These methods are described in the subsections that follow. No
proprietary or sensitive data has been included in the analyses that follow in order to
protect the interests of private parties mentioned within the body of this report.
Energy Consumption
Energy consumption in ENERGY STAR and LEED-EBOM buildings was analyzed
from two perspectives – carbon emissions abatement and financial performance. The first
step in this process was to compile regional data quantifying the carbon emissions
abatement associated with ENERGY STAR and LEED-EBOM building certifications.
Regional data was required, as the fuel mix used to produce energy at the source differs
across the United States. Carbon dioxide emissions resulting from energy consumption
vary greatly depending upon the inputs used to generate the energy consumed, and power
plants across the United States utilize a variety of different fuels. Therefore, identical
buildings in different regions of the country may have very different carbon footprints. The
table below shows carbon dioxide emission factors for some of the combustion fuels
typically used to generate electricity and other forms of energy in the United States.53 All
units are shown in pounds of carbon dioxide per million Btu of fuel.
53
U.S. EIA, 2011

18
Fuel Type CO2 Emissions
Factor
Coal 205 - 229
Natural Gas 117 - 119
Petroleum 131 - 173
Municipal Waste 42
Other sources of energy production such as hydropower, nuclear processes, and
renewables (i.e. wind and solar) have lower carbon dioxide emissions factors, and are also
used widely across the United States.54 Using these emissions factors and regional data
quantifying the carbon dioxide emissions attributable to commercial buildings, analyses
could then be conducted to make recommendations regarding investment in ENERGY STAR
and LEED-EBOM certified buildings from the perspective of carbon dioxide emissions
abatement.
The second step in assessing energy consumption in ENERGY STAR and LEED-
EBOM buildings was to conduct analyses to judge the financial costs and benefits
associated with investing in one of these sustainability labels. This process was slightly
more complicated than analyzing the labels from a carbon emissions abatement
perspective because financial operating data for specific properties is proprietary
information, and kept confidential by owners/operators. Thus, hard operating data for
ENERGY STAR and LEED-EBOM certified properties was difficult to obtain. Due to the
inaccessibility of this operating data, a hypothetical financial assessment based upon the
carbon dioxide emissions abatement analysis, and my previous experience in the real
estate finance industry, was employed to judge the effects of ENERGY STAR and LEED-
EBOM energy efficiency upgrades on net operating income (NOI) and overall building
value. Several financial tools, including the direct capitalization model, simple payback
54
U.S. EPA, 2007

19
model, and discounted payback model, were used to conduct these analyses, and ultimately
make recommendations on the financial aspects of investing in an ENERGY STAR or LEED-
EBOM certification for commercial buildings.
Other Building Materials & Resources
Select other building materials and resources relevant to the extended scope
associated with the LEED-EBOM certification were also analyzed as part of this report.
These materials and resources included water use, waste removal, indoor environmental
quality, and documentation requirements. The financial impacts, namely building value, of
increased water use and waste removal efficiencies were evaluated using an extension of
the direct capitalization model created in the Energy Consumption Analysis portion of this
report. All baseline assumptions for the updated direct capitalization model remained
constant, allowing for a direct comparison to the model utilized in the following Energy
Consumption Analysis.
Indoor environmental quality and documentation requirements associated with
LEED-EBOM certification were evaluated on a qualitative basis to assess some of the
potential “intangible” financial and environmental benefits (such as occupant health)
achieved as a result of pursuing related credits listed on the LEED-EBOM checklist. Data
collected from related studies, surveys, and periodicals was utilized to complete the
analyses, and offer final recommendations.
ENERGY CONSUMPTION ANALYSIS
Introduction
According to USGBC energy statistics, buildings are responsible for approximately
70% of all electricity consumed and roughly 39% of carbon dioxide emissions in the United

20
States.55 In terms of total energy use, commercial buildings alone accounted for 20% of
total energy consumption in the United States in 2009.56 As mentioned above, LEED and
ENERGY STAR certified buildings are designed with the intent to reduce energy
consumption, and improve overall energy efficiency in buildings. If these certifications are
achieved, the resulting increase in energy efficiency can have a positive effect on building
operations. The potential exists for reduced utility expenses, and fewer carbon dioxide
emissions resulting from energy consumption.
The good news about comparing the costs and benefits associated with energy
efficiency as it pertains to the ENERGY STAR and LEED-EBOM certifications is that both
labels must satisfy the same criteria.57 In other words, the same energy efficiency
performance metrics that satisfy ENERGY STAR requirements also satisfy LEED-EBOM
requirements. This essentially shifts the focus of a building owner/operator from asking
“should I invest in ENERGY STAR or LEED-EBOM” to “should I invest in an energy efficiency
upgrade for my existing building”?
Carbon Dioxide Emissions Abatement
Increasing energy efficiency in existing buildings under the requirements for the
ENERGY STAR or LEED-EBOM certifications has a dramatic impact on a building’s carbon
footprint. Below is a table obtained from the EPA showing a regional comparison in carbon
dioxide emissions attributable to energy consumption in conventional office buildings
55
USGBC, 2005 56
The White House, 2011 57
U.S. EPA, 2011

21
versus carbon dioxide emissions attributable to energy consumption in rated ENERGY
STAR and/or LEED-EBOM certified buildings.58
Typical Office Building
ENERGY STAR Office Building
CO2 Emissions Abatement
eGRID Sub-region lbs CO2/SF lbs CO2/SF Reduction % RFCE (Mid-Atlantic) 24 17 29.2% SPSO (TX Panhandle-OK) 36 26 27.8% SPNO (KS-Western MO) 40 29 27.5% MROW (Upper Midwest) 37 27 27.0% RMPA (CO-Eastern WY) 41 30 26.8% ERCT (Most of TX) 30 22 26.7% HIMS (HI excluding Oahu) 30 22 26.7% RFCM (Most of MI) 34 25 26.5% MROE (Eastern WI) 38 28 26.3% NYUP (Upstate NY) 19 14 26.3% AKGD (South/Central Alaska) 27 20 25.9% SRSO (Southeast US/Gulf Coast) 31 23 25.8% SRTV (TN Valley) 31 23 25.8% HIOA (Oahu Island) 35 26 25.7% AKMS (Most of Alaska) 12 9 25.0% CAMX (Southwest Coast) 20 15 25.0% FRCC (Most of FL) 28 21 25.0% NEWE (New England) 20 15 25.0% NWPP (Northwest US) 20 15 25.0% NYCW (NYC) 20 15 25.0% RFCW (Ohio Valley) 32 24 25.0% SRMV (Lower Mississippi) 24 18 25.0% SRVC (Southeast Seaboard) 24 18 25.0%
SRMW (Middle Mississippi) 37 28 24.3% NYLI (Long Island, NY) 29 22 24.1% AZNM (Southwest US) 26 20 23.1% MEAN 28.7 21.2 25.8% MEDIAN 29.5 22.0 25.8%
This data clearly shows the benefits associated with obtaining an ENERGY STAR or LEED-
EBOM certification with respect to carbon dioxide emissions abatement. Though the data
58
U.S. EPA and U.S. DOE, 2003

22
vary according to region (most likely due to the fuel mix used at the energy production
source), a building owner/operator can expect to realize an average annual carbon dioxide
emissions abatement of 25.8% by achieving an ENERGY STAR or LEED-EBOM certification.
This has several important implications for building owners/operators, including:
1. This energy savings and carbon dioxide emissions abatement provides a real solution for owners/operators that are concerned with addressing the moral issues surrounding climate change. If a building owner/operator is purely interested in reducing its adverse environmental impact attributable to building operations, this data helps to support a case for investing in energy efficiency upgrades.
2. In his State of the Union address on January 25, 2011, President Barack Obama
described several aspects of his Better Buildings Initiative in detail. A key element of this plan is targeted at improving energy efficiency in commercial buildings. Specifically, President Obama hopes the Better Building Initiative will lead to improvements that increase energy efficiency in commercial buildings by 20% over the next decade, and reduce total business-related energy expenditures by roughly $40 billion.59 The data above clearly shows that obtaining an ENERGY STAR or LEED-EBOM certification should reduce energy consumption to a point that achieves a minimum carbon dioxide emissions abatement of 23.1% from today’s baseline operations. With President Obama’s administration clearly in favor of incentivizing energy efficiency upgrades in buildings, this should lead commercial building owners/operators to strongly consider both the ENERGY STAR or LEED-EBOM sustainability labels as potential ways to support and comply with President Obama’s Better Building Initiative goals.
3. Though no legislation regulating carbon dioxide emissions has been passed in the
United States to this point in time, climate change is the subject of many government debates. As a result, it is possible that future bills could propose such regulations – most notably a carbon tax or carbon permit trading system. In the event carbon dioxide emissions are regulated by the United States government in the future, investing in an ENERGY STAR or LEED-EBOM label could help an owner/operator avoid potentially significant costs associated with carbon dioxide emissions attributable to building operations. In the event a carbon permit trading scheme is adopted, the abatement achieved as a result of operating as an ENERGY STAR or LEED-EBOM facility could result in new revenue streams for owners/operators, as carbon permits should be saleable and/or tradable.
59
The White House, 2011
23
Financial Analyses - Introduction
Though carbon dioxide emissions abatement is a key benefit of investing in an
ENERGY STAR or LEED-EBOM certification, the investment should also be justified
financially. REITs and other real estate organizations must provide investors with financial
returns. This means that building owners/operators must operate profitably to justify an
investment in a sustainability label for a commercial building. As mentioned in the
Materials & Methods section of this report, hard operating data for existing properties is
proprietary information, and difficult to access. As a result, three financial tools were
utilized to assess the financial aspects of operations associated with the ENERGY STAR and
LEED-EBOM certifications. These tools include the direct capitalization valuation model,
simple payback model, and discounted payback model.
Direct Capitalization Valuation Analysis
The direct capitalization valuation model is a widely used tool to assess the value of
an income-producing property’s business operations. The model examines a building’s
stabilized operations by underwriting income and expenses, calculating NOI, and then
applying the resulting NOI to a market-driven capitalization rate to derive a final value for
the building.
Many industry experts question whether investments in energy efficiency upgrades
truly contribute to overall value generation in buildings. This is because most tenant leases
in office, industrial, and retail income producing properties are structured in a way that
reimburses the landlord (owner/operator) for their share of operating expenses. This
structure is known as a “triple net” (NNN) lease. For example, suppose a tenant occupies
10% of the rentable area (GLA) of a building and pays $20.00 per square foot (SF) in annual

24
base rent. Further suppose annual operating expenses such as real estate taxes, insurance,
maintenance, and utilities total $5.00 per SF. The tenant would then be responsible for
paying $20.00 per SF in base rent plus its pro-rata share ($5.00 per SF operating expense *
10% = $0.50 per SF) of operating expense reimbursement to the landlord on an annual
basis. This is significant with respect to energy efficiency upgrades because the tenants are
expected to reimburse the landlord for energy-related operated expenses (i.e. utilities).
Therefore, it seems an owner/operator should not be concerned with energy efficiency
upgrades from a financial perspective.
To see if energy efficiency upgrades could result in increased NOI from building
operations, and consequently enhanced building value, two direct capitalization models
were used to assess a hypothetical building operations scenario. The first model was
designed to value a conventional commercial building with no energy efficiency upgrades.
The second model was designed to value a building with an energy efficiency upgrade
consistent with the figures shown for ENERGY STAR and LEED-EBOM certified commercial
buildings in the previous Carbon Dioxide Emissions Abatement subsection of this report.
Model inputs were based on a standard commercial building with the following operating
and market characteristics:
Parameter Input Value
GLA (SF) 100,000
Occupancy Rate 80%
Vacancy Rate 20%
Base Rent (SF) $20.00
Management Fee 4%
Capitalization Rate 10%
Lease Structure NNN
25
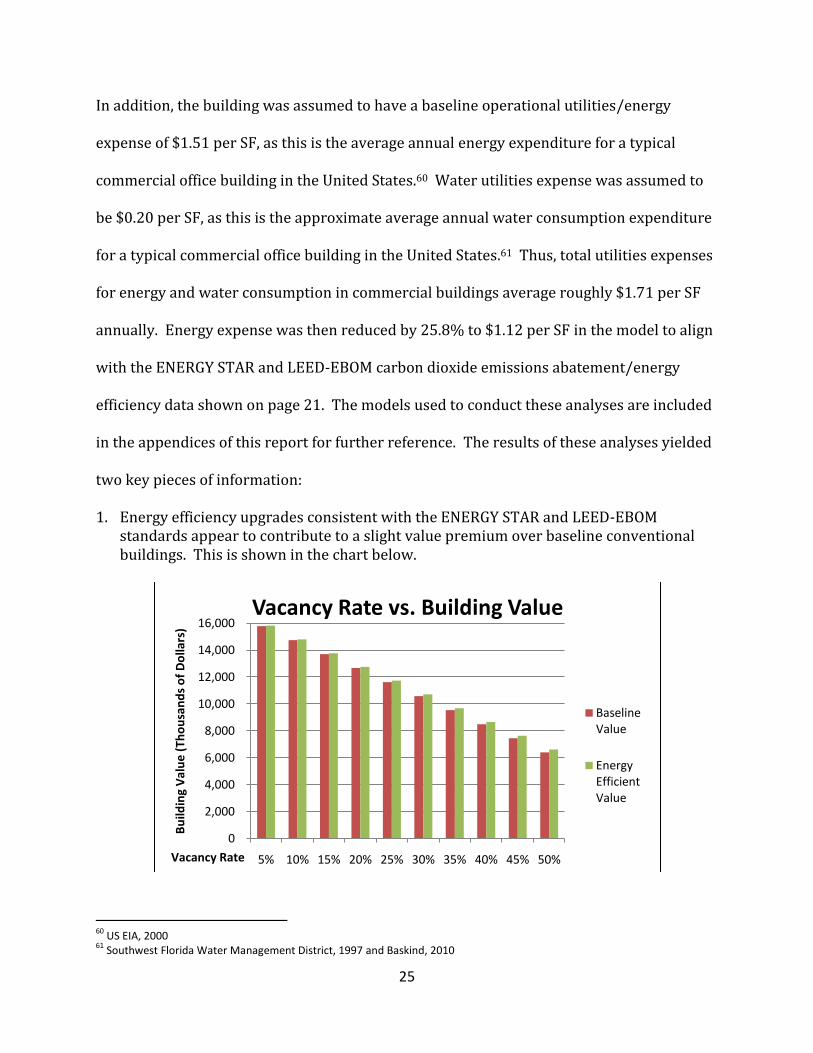
In addition, the building was assumed to have a baseline operational utilities/energy
expense of $1.51 per SF, as this is the average annual energy expenditure for a typical
commercial office building in the United States.60 Water utilities expense was assumed to
be $0.20 per SF, as this is the approximate average annual water consumption expenditure
for a typical commercial office building in the United States.61 Thus, total utilities expenses
for energy and water consumption in commercial buildings average roughly $1.71 per SF
annually. Energy expense was then reduced by 25.8% to $1.12 per SF in the model to align
with the ENERGY STAR and LEED-EBOM carbon dioxide emissions abatement/energy
efficiency data shown on page 21. The models used to conduct these analyses are included
in the appendices of this report for further reference. The results of these analyses yielded
two key pieces of information:
1. Energy efficiency upgrades consistent with the ENERGY STAR and LEED-EBOM standards appear to contribute to a slight value premium over baseline conventional buildings. This is shown in the chart below.
60
US EIA, 2000 61
Southwest Florida Water Management District, 1997 and Baskind, 2010
0
2,000
4,000
6,000
8,000
10,000
12,000
14,000
16,000
5% 10% 15% 20% 25% 30% 35% 40% 45% 50%
Bu
ildin
g V
alu
e (
Tho
usa
nd
s o
f D
olla
rs)
Vacancy Rate
Vacancy Rate vs. Building Value
Baseline Value
Energy Efficient Value

26
2. The size of the value premium generated as a result of ENERGY STAR and LEED-EBOM energy efficiency upgrades appears to be directly related to increases in the vacancy rate of the building. This is shown in the chart below.
Further analysis of these models reveals the reasons behind these results. A value
premium based on energy efficiency upgrades for ENERGY STAR or LEED-EBOM is
generated as a result of operating expense reductions attributable to the vacant space in
the building. Energy expenses related to vacant space must be absorbed in full by the
owner/operator of the building, as there is no tenant to reimburse these costs under the
terms of a NNN lease. As a consequence, a decrease in operating expenses attributable to
vacant space in the building results in a corresponding increase in NOI, and overall building
value.
As the vacancy rate is increased, the value premium generated as a result of any
energy efficiency upgrades also increases. Overall building value decreases as vacancy rate
increases, but it appears ENERGY STAR and LEED-EBOM certified buildings hold slightly
more value in this case over conventional buildings. This is because a rise in vacancy rate
will result in the owner/operator being responsible for a larger proportion of energy-
0.00%
0.50%
1.00%
1.50%
2.00%
2.50%
3.00%
3.50%
4.00%
5% 10% 15% 20% 25% 30% 35% 40% 45% 50%
EE B
uild
ing
Val
ue
Pre
miu
m
Vacancy Rate
Vacancy Rate vs. EE Value Premium

27
related operating expenses in the building. By reducing the energy-related expenses that
must be absorbed by the owner/operator due to increasing vacancy trends, ENERGY STAR
and LEED-EBOM energy efficiency upgrades can help owners/operators retain more value
in their buildings.
Simple & Discounted Payback Analyses The direct capitalization valuation analysis in the previous subsection of this report
reveals that there is potential value enhancement generated by ENERGY STAR and LEED-
EBOM energy efficiency upgrades. However, the direct capitalization method only analyzes
a property on a stabilized basis. To achieve a better understanding of the ability of
owners/operators to recoup their initial investment in the equipment required to achieve
energy efficiency levels consistent with ENERGY STAR and LEED-EBOM requirements, two
additional models were used – the simple payback model and the discounted payback
model. For the sake of making a direct comparison, the same input parameters used for the
direct capitalization analysis were also used for the simple and discounted payback models.
The simple payback model calculates the time required for owners/operators to
break even based upon their initial investment and the nominal annual savings achieved as
a result of the investment. The direct capitalization analysis discussed in the previous
subsection of this report resulted in an annual NOI increase of $9,108 ($0.09 per SF). Using
this figure, a simple payback period was calculated for varying levels of initial investment
required to meet ENERGY STAR and LEED-EBOM energy efficiency standards. The results
of this analysis are shown in the chart below.

28
The analysis shows that initial investments of $91,000 ($0.91 per SF) or less in total yield a
simple payback period of less than 10 years based on the model parameter inputs
discussed above.
The simple payback period method is a reliable and straightforward approach to
calculating a breakeven point for investments, but it does not take into account the time
value of money. The discounted payback period approach uses the same basic
methodology as the simple payback period approach, but also includes a discount rate to
account for the time value of money. Once again, using an annual NOI increase of $9,108 as
taken from the direct capitalization model discussed previously, a discounted payback
period was calculated for varying levels of initial investment required to meet ENERGY
STAR and LEED-EBOM energy efficiency standards. A discount rate of 10% was assumed,
though it should be noted that discount rates typically vary by project and/or investor. The
results of this analysis are shown in the chart below.
0
5
10
15
20
25Si
mp
le P
ayb
ack
Pe
rio
d (
Ye
ars)
Investment Level ($)
Investment Level and Resulting Simple Payback Period

29
As shown, including a discount rate alters payback periods significantly as compared to
those exhibited by the simple payback method for the same level of initial capital
investment required to meet ENERGY STAR and LEED-EBOM energy efficiency standards.
While initial investments of $20,000 ($0.20 per SF) to $50,000 ($0.50 per SF) yield
relatively similar payback periods using both payback methodologies, investments greater
than $65,000 ($0.65 per SF) have significantly different results. This appears to arise
because discounting future cash flows to present values results in an exponential increase
in payback period. As capital requirements to meet ENERGY STAR and LEED-EBOM
standards increase, so too does the discounted payback period on an exponential level.
Other Energy Efficiency Financial Considerations
As a way to encourage investment in energy efficiency upgrades for residential and
commercial buildings, the United States federal government, select state and local
governments, and many other public organizations have elected to offer tax credits on
0
5
10
15
20
25
20,000 35,000 50,000 65,000 80,000
Dis
cou
nte
d P
ayb
ack
Pe
rio
d (
Ye
ars)
Investment Level ($)
Investment Level and Resulting Discounted Payback Period

30
purchases of qualified energy efficient products. These materials primarily include those
related to heating, cooling, water heating, and lighting in commercial buildings.62 After-tax
cash flows are not considered in the real estate valuation process because federal, state,
and local income taxes are not operating items.63 In other words, federal, state, and locally
assessed income taxes are not directly attributable to property-specific operations. This
means that tax credits other than those related to real estate taxes will not contribute to
overall building value. However, any income tax credits received as a result of energy
efficient equipment installation tax rebates should help real estate owners/operators
improve their overall profitability and payback period figures, and should be taken into
account when owners/operators are considering upgrading existing facilities to
incorporate energy efficient equipment. Given that these tax credits can be regional, and
even local, in nature, it is strongly advised that real estate owners/operators investigate
energy efficiency income tax credit opportunities on a case by case basis depending upon
the location(s) of facilities targeted for energy efficiency upgrades.
OTHER MATERIALS & RESOURCES ANALYSIS
Introduction As seen in the Energy Consumption Analysis section of this report, both the ENERGY
STAR and LEED-EBOM green building labels have requirements with respect to energy
efficiency and performance. Though these two labels subscribe to the same criteria for
energy efficiency standards, they differ greatly in scope pertaining to other materials and
resources. While ENERGY STAR certifies a certain level of energy efficiency, and deals only
62
U.S. EPA and U.S. DOE, 2005 63
After-tax cash flows are net cash flows which reflect expenses attributable to federal, state, and local taxes. Operating cash flows (NOI) do, however, include real estate taxes.

31
with materials pertaining to energy performance and consumption, the scope of LEED-
EBOM extends to other aspects of green building, such as water use efficiency, indoor
environmental quality, innovation in process management, product purchasing and
sourcing, and waste management.64 This extended scope also implies that real estate
organizations may be required to invest more time, capital, and human resources relative
to ENERGY STAR in order to achieve LEED-EBOM certification. The following quantitative
and qualitative analyses were designed to investigate whether select items of the extended
scope of the LEED-EBOM label offer commercial building owners/operators financial and
environmental advantages over ENERGY STAR rated and/or conventionally constructed
facilities.
Carbon Dioxide Emissions Abatement
As shown in the Carbon Dioxide Emissions Abatement subsection of the Energy
Consumption Analysis, ENERGY STAR and LEED-EBOM certified commercial buildings
discharge 25.8% less carbon dioxide emissions than conventional commercial buildings on
average. However, the use of certain materials and implementation of operational
processes specific to LEED-EBOM can result in a LEED certified commercial building
achieving carbon dioxide emissions abatement of 33% to 39% as compared to
conventional commercial buildings.65
Given that LEED-EBOM subscribes to the same energy efficiency standards and
requirements as ENERGY STAR, it is therefore logical to assume that additional carbon
dioxide emissions abatement over the 25.8% level attributable to energy efficiency
upgrades is attributable to items addressed in the extended scope of the LEED-EBOM
64
USGBC, 2009 65
Sustainable Building Services, LLC, 2010

32
certification. In other words, materials and/or operational processes acceptable for LEED-
EBOM certification have the potential to contribute to between 7.2% and 13.2% additional
carbon dioxide emissions abatement on average. Using the table showing energy efficiency
upgrade-related carbon dioxide emissions abatement expectations from the Carbon
Dioxide Emissions Abatement subsection of the Energy Consumption Analysis portion of
this report, and the expected carbon dioxide emissions abatement figures for LEED-EBOM
materials and processes above as a baseline, the mean and median carbon dioxide
emissions factors for commercial LEED-EBOM certified buildings can be calculated. The
results of these calculations are shown in the table below.66
Building Certification Type
Total CO2 Abatement Level (%)
Mean Abatement from Baseline (lbs CO2/SF)
Median Abatement from Baseline (lbs CO2/SF)
ENERGY STAR 25.8% 7.4 7.5
LEED-EBOM (Low) 33.0% 9.5 8.9
LEED-EBOM (high) 39.0% 11.2 11.5 As expected, the extended scope of the LEED-EBOM certification provides for larger mean
and median carbon dioxide emissions abatement figures. This raises the question “what
should a real estate owner/operator be willing to pay for this additional carbon dioxide
emissions abatement?”
As seen in the case of energy efficiency upgrades, the level of carbon dioxide
emissions abatement achieved in commercial buildings may be largely driven by an
owner’s/operator’s commitment to capital investment in building facilities and processes.
The same may likely be true with respect to materials. However, the question arises
“should an owner/operator invest more capital in energy efficiency upgrades or materials
and processes in the scope of the requirements to attain LEED-EBOM certification?” To
66
U.S. EPA and U.S. DOE, 2003
33
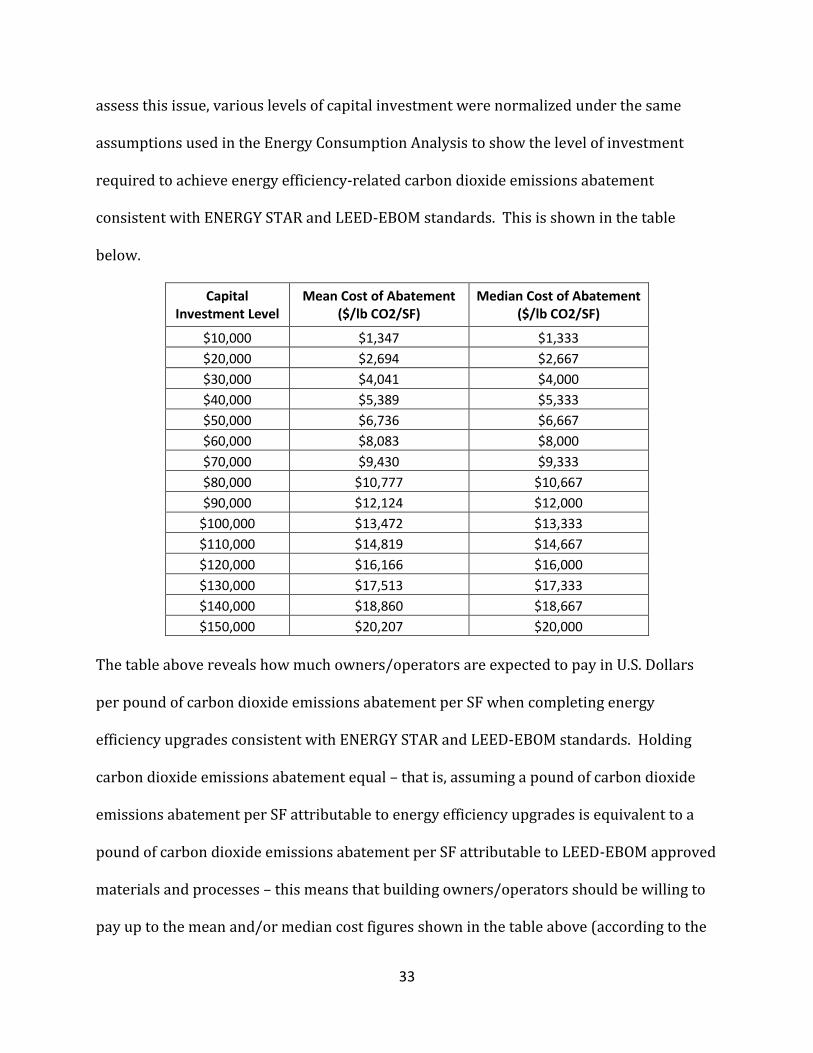
assess this issue, various levels of capital investment were normalized under the same
assumptions used in the Energy Consumption Analysis to show the level of investment
required to achieve energy efficiency-related carbon dioxide emissions abatement
consistent with ENERGY STAR and LEED-EBOM standards. This is shown in the table
below.
Capital Investment Level
Mean Cost of Abatement ($/lb CO2/SF)
Median Cost of Abatement ($/lb CO2/SF)
$10,000 $1,347 $1,333
$20,000 $2,694 $2,667
$30,000 $4,041 $4,000
$40,000 $5,389 $5,333
$50,000 $6,736 $6,667
$60,000 $8,083 $8,000
$70,000 $9,430 $9,333
$80,000 $10,777 $10,667
$90,000 $12,124 $12,000
$100,000 $13,472 $13,333
$110,000 $14,819 $14,667
$120,000 $16,166 $16,000
$130,000 $17,513 $17,333
$140,000 $18,860 $18,667
$150,000 $20,207 $20,000 The table above reveals how much owners/operators are expected to pay in U.S. Dollars
per pound of carbon dioxide emissions abatement per SF when completing energy
efficiency upgrades consistent with ENERGY STAR and LEED-EBOM standards. Holding
carbon dioxide emissions abatement equal – that is, assuming a pound of carbon dioxide
emissions abatement per SF attributable to energy efficiency upgrades is equivalent to a
pound of carbon dioxide emissions abatement per SF attributable to LEED-EBOM approved
materials and processes – this means that building owners/operators should be willing to
pay up to the mean and/or median cost figures shown in the table above (according to the

34
corresponding level of capital investment) for the additional 7.2% to 13.2% carbon dioxide
emissions abatement achieved by incorporating LEED-EBOM approved materials and
processes into the scope of the project. For example, assume a $100,000 initial capital
investment results in reaching ENERGY STAR and LEED-EBOM energy efficiency standards,
and a consequential carbon dioxide emissions abatement of 25.8% (7.4 to 7.5 pounds of
carbon dioxide emissions abatement per SF) from baseline figures. The owner/operator
will have assumed a cost of between $13,333 and $13,472 ($0.13 per SF) per pound of
carbon dioxide emissions abatement per SF. Based on these figures, the owner/operator
should then be willing to pay between $18,666 ($0.19 per SF) and $53,332 ($0.53 per SF)
to achieve additional LEED-EBOM based carbon dioxide emissions abatement consistent
with median cost/benefit figures, or between $28,291 ($0.28 per SF) and $51,194 ($0.51
per SF) to achieve additional the abatement with mean cost/benefit figures. This example
would result in the owner/operator investing a total of between $118,666 ($1.19 per SF)
for a 33% abatement level, and $153,332 ($1.53 per SF) for a 39% abatement level to
achieve LEED-EBOM certification while holding the value of carbon dioxide emissions
abatement constant.
Other Factors to Consider
In addition to carbon dioxide emissions abatement, there are several other factors
that owners/operators must consider when evaluating the extended scope of the LEED-
EBOM certification. These additional factors, including water use efficiency, waste
reduction, indoor atmosphere, documentation requirements, and human resources can
also have substantial financial and/or environmental costs and benefits. Some of these
effects can be quantified, but others are intangible, and are highly dependent on
35
organizational and tenant values. The following subsections attempt to provide additional
guidance for commercial building owners/operators for these factors.
Water Efficiency & Waste Reduction
LEED certified commercial buildings, including LEED-EBOM certified buildings, can
improve water use and efficiency by up to 40%, and reduce solid waste disposal by up to
70%, as compared to conventionally constructed and operated commercial buildings.67
Water utility metering costs, as well as recycling and garbage disposal costs, vary across
local and regional utility and waste management companies. Thus, cost savings achieved
as a result of water efficiency upgrades and waste reduction processes consistent with
LEED-EBOM standards will vary by project. In addition, overall cost savings achieved and
the resulting payback period to the owner/operator resulting from these upgrades and/or
processes will depend upon an owner’s/operator’s initial capital investment and discount
rate.
Using the same assumptions and input parameters as those included in the Direct
Capitalization Valuation Analysis subsection of the Energy Consumption Analysis section of
this report, a separate direct capitalization model valuation analysis was conducted to
assess the potential additional building value generated as a result of pursuing water
efficiency upgrades consistent with LEED-EBOM standards. This model also took into
account energy efficiency upgrades consistent with ENERGY STAR and LEED-EBOM
standards, as these energy efficiency measures would also be required to achieve a LEED-
EBOM building certification. For simplicity, an overall water use efficiency improvement of
40% was assumed. The results of this direct capitalization analysis revealed the following:
67
Sustainable Building Services, LLC, 2010

36
1. Water efficiency upgrades consistent with LEED-EBOM standards coupled with energy efficiency upgrades consistent with the ENERGY STAR and LEED-EBOM standards appear to contribute to a small, but marginal additional value premium over energy efficient buildings with energy efficient operations consistent with ENERGY STAR buildings. This is shown in the chart below.
2. The size of the value premium generated as a result of combining LEED-EBOM water
use efficiency upgrades with ENERGY STAR and LEED-EBOM energy efficiency upgrades appears to be directly related to increases in the vacancy rate of the building, just as in the direct capitalization analysis utilized in the Energy Consumption Analysis. In addition, value premiums for buildings with both water use and energy efficiency upgrades consistent with LEED-EBOM standards tend to be slightly higher than those achieved employing energy efficiency upgrades consistent with ENERGY STAR and LEED-EBOM standards alone. This is shown in the chart below.
0
2,000
4,000
6,000
8,000
10,000
12,000
14,000
16,000
5% 10% 15% 20% 25% 30% 35% 40% 45% 50%
Bu
ildin
g V
alu
e (
Tho
usa
nd
s o
f D
olla
rs)
Vacancy Rate
Vacancy Rate vs. Building Value
Baseline Value
Water/Energy Efficient Value
Energy Efficient Value
0.00%
1.00%
2.00%
3.00%
4.00%
5% 10% 15% 20% 25% 30% 35% 40% 45% 50%
Bu
ildin
g V
alu
e P
rem
ium
Vacancy Rate
Vacancy Rate vs. Value Premium
EE Value Premium (%) W/EE Value Premium (%)

37
Further analysis of these models reveals that these results occur for the same reasons as in
the Energy Consumption Analysis direct capitalization model. A value premium based on
both water use efficiency upgrades for LEED-EBOM and energy efficiency upgrades for
ENERGY STAR or LEED-EBOM is generated as a result of operating expense reductions
attributable to the vacant space in the building. In addition, overall building value
decreases as vacancy rate increases, but it appears LEED-EBOM certified buildings hold
slightly more value in this case over both conventional buildings and ENERGY STAR rated
buildings. This is because a rise in vacancy rate will result in the owner/operator being
responsible for a larger proportion of water-related and energy-related operating expenses
in the building. By reducing the applicable utility expenses that must be absorbed by the
owner/operator due to increasing vacancy trends, LEED-EBOM water use and energy
efficiency upgrades can help owners/operators retain more incremental value in their
buildings. It should be noted that waste removal was not considered in this analysis, as this
expense tends to be a flat rate fee (either per month or per pick up) charged by
trash/recycling collection companies. These charges and/or the number of trash
collections completed annually were assumed to remain constant. As a result, the
incremental benefits associated with waste reduction should be more qualitatively related
to the positive environmental impacts achieved by diverting waste from landfills, rather
than quantitatively related to cost savings.
Indoor Environmental Quality
Building efficiency is not the only item addressed by the LEED-EBOM checklist.
Many environmental aspects associated with the interior atmosphere of the building are
also taken into consideration in order to provide workers and/or tenants with a pleasant
38
and healthy indoor environment. LEED-EBOM credits awarded for indoor environmental
quality include those related to green cleaning products, indoor air quality, use of natural
light, occupant comfort, and tobacco smoke control.68 The reasoning behind incorporating
these elements as part of the LEED-EBOM certification is to enhance the aesthetic quality of
the interior of the building, and ultimately, occupant health. These upgrades can result in
both measureable and intangible benefits for commercial building owners/operators.
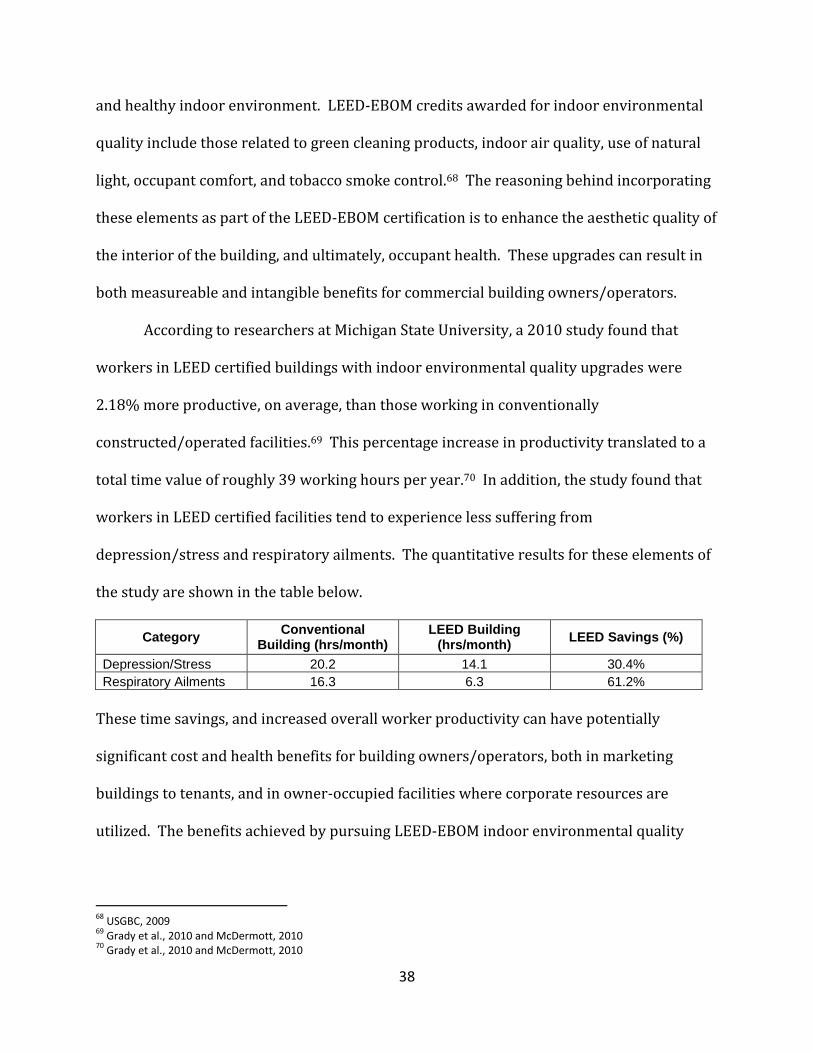
According to researchers at Michigan State University, a 2010 study found that
workers in LEED certified buildings with indoor environmental quality upgrades were
2.18% more productive, on average, than those working in conventionally
constructed/operated facilities.69 This percentage increase in productivity translated to a
total time value of roughly 39 working hours per year.70 In addition, the study found that
workers in LEED certified facilities tend to experience less suffering from
depression/stress and respiratory ailments. The quantitative results for these elements of
the study are shown in the table below.
Category Conventional
Building (hrs/month) LEED Building
(hrs/month) LEED Savings (%)
Depression/Stress 20.2 14.1 30.4%
Respiratory Ailments 16.3 6.3 61.2%
These time savings, and increased overall worker productivity can have potentially
significant cost and health benefits for building owners/operators, both in marketing
buildings to tenants, and in owner-occupied facilities where corporate resources are
utilized. The benefits achieved by pursuing LEED-EBOM indoor environmental quality
68
USGBC, 2009 69
Grady et al., 2010 and McDermott, 2010 70
Grady et al., 2010 and McDermott, 2010

39
credits should vary by facility and organization, as each owner’s/operator’s and/or tenant’s
overhead costs differ depending upon industry, firm size, and annual working hours.
Is should be noted that a competing study completed jointly by the University of San
Diego and C.B. Richard Ellis also found that green buildings tend to yield occupant
productivity and health benefits.71 The survey collected more than 500 tenant responses
from over 150 buildings with either a LEED-EBOM or ENERGY STAR label. Over 50% of the
tenant respondents reported an improvement in employee productivity, and 45% reported
a decrease in the number of employee sick days taken annually.72 However, another 10%
of tenant respondents reported an increase in the number of employee sick days.73 In an
interesting twist, this 10% of tenants all happened to be located in ENERGY STAR rated
buildings, not LEED certified facilities.74 The study did not comment further on the
possible link between the increase in worker sick days and the buildings’ ENERGY STAR
rating, and noted that further research is necessary to determine the exact cause of this
reported increase in employee illness. Still, this study raises a fascinating point, and the
results suggest that commercial building owners/operators should consider these findings
when evaluating LEED-EBOM and ENERGY STAR sustainability labels for buildings in their
portfolio.
Finally, a periodical released from Yale University suggests that LEED certified
facilities do not contribute to increased overall occupant productivity and health.75
However, this periodical did not utilize human subjects to reach its conclusions, and does
not provide quantitative data disproving the conclusions made in the aforementioned 71
Miller and Pogue et al., 2009 and Hincha-Ownby, 2009 72
Miller and Pogue et al., 2009 and Hincha-Ownby, 2009 73
Miller and Pogue et al., 2009 and Hincha-Ownby, 2009 74
Miller and Pogue et al., 2009 and Hincha-Ownby, 2009 75
Wargo, 2010

40
Michigan State University and University of San Diego/C.B. Richard Ellis studies. Still, the
points presented by the author of the Yale University periodical should be evaluated by
building owners/operators when assessing the costs and benefits of LEED-EBOM indoor
environmental quality standards.
In completing my research on the topic of indoor environmental quality, the
majority of data seem to suggest that green buildings, specifically those with LEED
certification, offer some level of occupant health and productivity benefits. The Michigan
State University and San Diego/C.B. Richard Ellis studies appear to be among the most clear
in supporting this claim, but it is important for commercial building owners/operators to
consider all viewpoints on this topic before investing in a LEED-EBOM or ENERGY STAR
sustainability label.
Documentation Requirements & Human Resources
The LEED-EBOM certification process is a very time consuming, heavily documented
course of action that requires a great deal of owner/operator involvement.76 This implies
that building owners/operators will need to devote a significant amount of internal capital
to meeting the documentation requirements associated with the LEED-EBOM certification.
The financial and opportunity costs associated with this process include, but are not
limited to, employee working capital, office materials, time, and other resources. The
amount and extent of the resources required to complete the LEED-EBOM documentation
process depends upon the level of LEED-EBOM certification being pursued. For example,
documentation requirements, and the resulting use of owner/operator resources, should
increase as an owner/operator elects to pursue more credits from the LEED-EBOM
76
Lorenz, 2011
41
checklist. Thus, the total amount of resources utilized should be substantially higher for a
LEED-EBOM Platinum project scope (80+ credits) than for a LEED-EBOM Certified project
scope (40 to 49 credits). Specific data showing the human resource and time commitments
required to attain a LEED-EBOM certification is not widely available, as these figures tend
to vary significantly by project, and are also part of an owner’s/operator’s proprietary
operating information. However, given the fact that the LEED-EBOM scope extends to
seven checklist categories beyond energy efficiency, and considerably beyond the scope of
ENERGY STAR requirements, it seems logical to deduce that LEED-EBOM documentation
requirements should add to an owner’s/operator’s overall capital and time investment in a
project. Of course, the costs associated with internal owner/operator resources and the
documentation process should vary by project and owner/operator, as each has unique
operating characteristics. As a result, it is critical for commercial building
owners/operators to assess the level of required investment attributable to the LEED-
EBOM certification process prior to engaging in a LEED-EBOM project. If these costs and
resource commitments are miscalculated, the resulting cost overruns could detract from
any building operations and/or value synergies achieved by pursuing other items, such as
energy and/or water use efficiency upgrades.
LIMITATIONS
While the analyses conducted suggest that there are substantial financial,
environmental, health, and other benefits associated with ENERGY STAR and LEED-EBOM
certifications for commercial buildings, this study is limited by several factors. These
include:
1. Actual operating histories for commercial buildings with either ENERGY STAR or LEED-EBOM certifications were difficult to obtain, as this information is usually held privately

42
by building owners/operators. Without this data, it is possible that building value premiums achieved due to sustainability measures are either understated or overstated in the context of the analyses presented in this report. In addition, this operating data is considered an owner’s/operator’s proprietary information, and beyond the scope of the analyses contained in this report.
2. The analyses contained in this report do not take into account the entire scope of the
LEED-EBOM certification process. The primary focus of this report was to provide commercial building owners/operators with general guidance regarding carbon dioxide emissions abatement and possible cost reduction synergies achieved as a result of pursuing ENERGY STAR and/or LEED-EBOM sustainability certifications for existing facilities. While certain elements of the extended LEED-EBOM scope were analyzed in the context of carbon dioxide emissions abatement, value generation, and select other potential benefits, it is recommended that the entire LEED-EBOM scope be analyzed in more detail to offer a complete value-added analysis of this certification.
3. Most buildings are unique in terms of their operating characteristics and efficiencies,
location, design, and tenancy. As a result, it is somewhat challenging to offer accurate valuation projections representative of all commercial buildings pursuing or already holding ENERGY STAR or LEED-EBOM certifications. This means that financial analyses and applicable environmental impact assessments should ideally be completed at a building-specific level in order to produce the most accurate information possible.
4. ENERGY STAR and LEED-EBOM certification requirements continuously evolve to
include updated technologies and practices. The programs for both sustainability labels have been updated in the past,77 and could potentially be further revised in the future.78 It is extremely difficult to assess the potential financial and environmental impacts of future revisions to the ENERGY STAR and LEED-EBOM certification requirements, as this information is published only by the EPA and USGBC, and is not made available to the public in its entirety until revisions are finalized.
5. While there is currently no active federal legislation in place to regulate the emission of
carbon dioxide and other greenhouse gases (GHGs), it is possible that this could occur in the future. Given the fact that building operations contribute to nearly 40% of worldwide carbon dioxide emissions, it seems likely that any federally mandated legislation regulating GHG emissions would include measures related to building operations efficiency and performance. This has been shown with the Obama Administration’s support of the Better Buildings Initiative. With this scenario being possible, but not certain, it is hard to anticipate what potential impacts political action may have on the ENERGY STAR and LEED-EBOM certifications, despite the fact that the effects of such regulation may be considerable.
77
Proefrock, 2008; U.S. EPA and U.S. DOE, 2011 78
Hsu, 2010

43
It is recommended that further research be conducted on this topic in the future to address
the limitations noted above as more information becomes available for analysis.
DISCUSSION & RECOMMENDATIONS The analyses conducted clearly illustrate that owners/operators stand to profit
from potentially significant financial, environmental, and intangible benefits associated
with pursuing either an ENERGY STAR or LEED-EBOM certification for an existing
commercial building. However, the results also reveal that it is difficult to deem one of
these certifications superior to the other. ENERGY STAR rated buildings appear to offer a
substantial amount of carbon dioxide emissions abatement and cost savings due to energy
efficiency, but do not appear to offer the same intangible occupant benefits of LEED-EBOM
certified buildings. LEED-EBOM certified buildings appear to offer slightly more carbon
dioxide emissions abatement potential, water use efficiencies, and occupant
health/comfort benefits, but at a higher overall level of capital investment for
owners/operators. This means that the process of selecting to pursue either an ENERGY
STAR or LEED-EBOM certification for a commercial building should conducted by
owners/operators with thought and care, and only used in appropriate cases. A list of
general recommendations regarding which scenarios present the best opportunities for
owners/operators to pursue an ENERGY STAR or LEED-EBOM certification, based on the
results from the analyses conducted in the previous sections of this report, is listed below.
Building owners/operators should consider adding either an ENERGY STAR or LEED-EBOM certification to one or more commercial buildings in cases where the owner/operator:
1. Is motivated by the prospect of reducing carbon dioxide emissions attributable to building operations.

44
2. Is interested in generating long term value for a building and/or building portfolio.
3. Has developed, or plans to implement a corporate sustainability operations
strategy.
4. Wishes to remain competitive with rival building owners/operators with respect to sustainability.
5. Is committed to providing tenants with appealing, healthy, and comfortable
environments.
6. Learns that government legislation mandating sustainability measures for buildings is likely to occur.
7. Is interested in conserving natural resources, and minimizing other adverse
environmental impacts associated with building operations.
8. Is concerned with the moral challenges associated with climate change. Assuming that the items listed above hold true, the ENERGY STAR label should be
considered over the LEED-EBOM certification in the following cases where commercial building owners/operators:
1. Are particularly budget and/or capital constrained with respect to investment in a sustainability label.
2. Are sensitive to the length of payback periods. 3. Must satisfy short-term (i.e. quarterly or semi-annual) expected investor return
hurdles to sustain business operations.
4. Are interested in completing energy efficiency upgrades that satisfy or exceed the targets set by President Obama’s Better Buildings Initiative.
Based on the analyses conducted, it appears the ENERGY STAR label best serves
owners/operators working on privately funded commercial building projects where
overall profitability and return on investment (ROI) are typically of chief importance.
Assuming that the items above hold true, the LEED-EBOM certification should be considered over the ENERGY STAR label in the following cases where commercial building owner/operators:

45
1. Are interested in taking a holistic approach to sustainable operations, and extending the scope of a project beyond energy efficiency upgrades.
2. Are relatively flexible with respect to capital investment requirements,
payback period length, and expected investor returns.
3. Are willing to commit time, employee, and other resources to satisfy USGBC documentation requirements.
4. Are able to quantify and practically realize the intangible benefits (i.e. occupant productivity, occupant health, site sustainability) associated with LEED-EBOM certification.
Based on the analyses conducted, it appears the LEED-EBOM certification best serves
owners/operators working on publicly funded government building projects where LEED
building standards may be required by the government organization supporting the
venture. It also appears that a LEED-EBOM certification may be more beneficial for
owners/operators who: (1) own buildings that require minimal investment above ENERGY
STAR capital requirements to meet LEED-EBOM performance and operations standards;
(2) own buildings occupied by tenants that place premiums on the indoor environmental
benefits achieved through adhering to LEED-EBOM standards; or (3) are seeking to earn a
reputation for innovation in sustainable commercial building operations which is above
and beyond possible accolades achieved through receiving ENERGY STAR ratings.
CONCLUSION
As noted in the Discussion & Recommendations section above, there are potential
financial and other environmental benefits achieved by obtaining either an ENERGY STAR
or LEED-EBOM certification for commercial buildings. It appears that the greatest single
contributor to potential value generation and simultaneous carbon dioxide emissions
abatement in commercial building operations is energy efficiency upgrades. As noted in
the Energy Consumption Analysis of the report, energy efficiency upgrades consistent with
46
ENERGY STAR and LEED-EBOM standards result in an average carbon dioxide emissions
abatement of 25.8%, while contributing to overall building value.
While this result may lead building owners/operators to believe that the ENERGY
STAR sustainability label is superior to the LEED-EBOM certification, the analyses
conducted as part of this research also suggest that the extent of these benefits varies
greatly based on the specific operating characteristics of each commercial building. Thus,
one sustainability label cannot be deemed superior to the other based on these analyses
alone. Given the challenges and limitations associated with the collection of operating data,
political insight, and general commercial building operating characteristics, it is
recommended that further research be conducted in the future to refine and build on the
analyses contained within this report to determine if one of these labels is superior to the
other in terms of carbon dioxide emissions abatement, value generation, and ROI. The
results of this report indicate that commercial building owners/operators should evaluate
the merits of the ENERGY STAR and LEED-EBOM sustainability labels on a case by case
basis for buildings they wish to certify as having sustainable operations. Doing so should
reveal which of the two sustainability labels will best serve the interests of the
owner/operator from both a financial and environmental perspective.
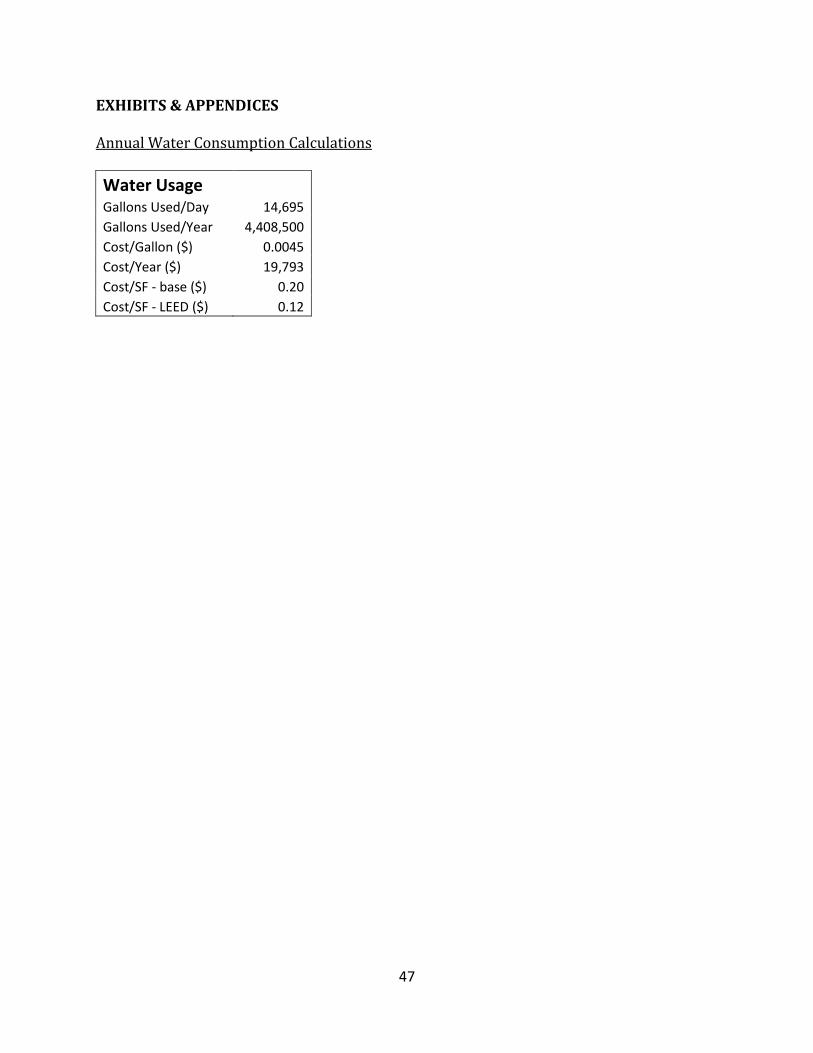
47
EXHIBITS & APPENDICES Annual Water Consumption Calculations
Water Usage Gallons Used/Day 14,695
Gallons Used/Year 4,408,500 Cost/Gallon ($) 0.0045 Cost/Year ($) 19,793 Cost/SF - base ($) 0.20 Cost/SF - LEED ($) 0.12

48
Energy Consumption: Direct Capitalization Model (Baseline)
Building Characteristics GLA (SF) 100,000
Occupied (SF) 80,000 Vacant (SF) 20,000 Vacancy 20.0%
Baseline Per SF Base Rent $ 2,000,000 $ 20.00 Expense Reimbursements 170,793 1.71 Vacancy & Collection Loss (434,159) (4.34)
Effective Gross Income 1,736,635 17.37
Utilities 170,793 1.71 Taxes 100,000 1.00 Repairs & Maintenance 100,000 1.00 Insurance 30,000 0.30 Management Fee (4%) 69,465 0.69
Total Operating Expenses 470,259 4.70
Replacement Reserves 0 0.00 TI/LCs 0 0.00
Total Reserves 0 0.00
NOI $ 1,266,376 $ 12.66 Cap Rate 10.00%
Implied Value $ 12,663,759 Rounded $ 12,660,000

49
Energy Consumption: Direct Capitalization Model (Energy Efficient)
Building Characteristics GLA (SF) 100,000
Occupied (SF) 80,000 Vacant (SF) 20,000 Vacancy 20.0%
Energy Efficient Per SF Base Rent $ 2,000,000 $ 20.00 Expense Reimbursements 123,616 1.24 Vacancy & Collection Loss (424,723) (4.25)
Effective Gross Income 1,698,893 16.99
Utilities 123,616 1.24 Taxes 100,000 1.00 Repairs & Maintenance 100,000 1.00 Insurance 30,000 0.30 Management Fee (4%) 67,956 0.68
Total Operating Expenses 421,572 4.22
Replacement Reserves 0 0.00 TI/LCs 0 0.00
Total Reserves 0 0.00
NOI $ 1,277,321 $ 12.77 Cap Rate 10.00%
Implied Value $ 12,773,211 Rounded $ 12,770,000

50
Energy Consumption: Simple & Discounted Payback Analyses
Building Characteristics GLA (SF) 100,000
Occupied (SF) 80,000 Vacant (SF) 20,000 Vacancy 20.0%
Initial Investment $95,000 NOI Increase $0.09
SIMPLE PAYBACK METHOD Year of Project 0 1 2 3 4 5 6 7 8 9 10 11 12
Investment ($95,000) $0 $0 $0 $0 $0 $0 $0 $0 $0 $0 $0 $0
Nominal NOI Increase $0 $9,060 $9,060 $9,060 $9,060 $9,060 $9,060 $9,060 $9,060 $9,060 $9,060 $9,060 $9,060
TOTAL ($95,000) $9,060 $9,060 $9,060 $9,060 $9,060 $9,060 $9,060 $9,060 $9,060 $9,060 $9,060 $9,060
Simple Payback (Years) 10.49
DISCOUNTED PAYBACK METHOD Discount Rate 10.00% Year of Project 0 1 2 3 4 5 6 7 8 9 10 11 12
Investment ($95,000) $0 $0 $0 $0 $0 $0 $0 $0 $0 $0 $0 $0
Nominal NOI Increase $0 $9,060 $9,060 $9,060 $9,060 $9,060 $9,060 $9,060 $9,060 $9,060 $9,060 $9,060 $9,060
DISCOUNTED TOTAL ($95,000) $8,237 $7,488 $6,807 $6,188 $5,626 $5,114 $4,649 $4,227 $3,842 $3,493 $3,176 $2,887
Discounted Payback (Years) N/A

51
Other Materials & Resources: Direct Capitalization Model (Baseline)
Building Characteristics GLA (SF) 100,000
Occupied (SF) 80,000 Vacant (SF) 20,000 Vacancy 20.0%
Baseline Per SF Base Rent $ 2,000,000 $ 20.00 Expense Reimbursements 170,793 1.71 Vacancy & Collection Loss (434,159) (4.34)
Effective Gross Income 1,736,635 17.37
Utilities 170,793 1.71 Taxes 100,000 1.00 Repairs & Maintenance 100,000 1.00 Insurance 30,000 0.30 Management Fee (4%) 69,465 0.69
Total Operating Expenses 470,259 4.70
Replacement Reserves 0 0.00 TI/LCs 0 0.00
Total Reserves 0 0.00
NOI $ 1,266,376 $ 12.66 Cap Rate 10.00%
Implied Value $ 12,663,759 Rounded $ 12,660,000

52
Other Materials & Resources: Direct Capitalization Model (Water/Energy Efficient)
Building Characteristics GLA (SF) 100,000
Occupied (SF) 80,000 Vacant (SF) 20,000 Vacancy 20.0%
Water/Energy Efficient Per SF
Base Rent $ 2,000,000 $ 20.00 Expense Reimbursements 123,616 1.24
Vacancy & Collection Loss (424,723) (4.25)
Effective Gross Income 1,698,893 16.99
Utilities 123,616 1.24 Taxes 100,000 1.00 Repairs & Maintenance 100,000 1.00 Insurance 30,000 0.30 Management Fee (4%) 67,956 0.68
Total Operating Expenses 421,572 4.22
Replacement Reserves 0 0.00 TI/LCs 0 0.00
Total Reserves 0 0.00
NOI $ 1,277,321 $ 12.77 Cap Rate 10.00%
Implied Value $ 12,773,211 Rounded $ 12,770,000

53
REFERENCES Baskind, Chris. “5 Reasons Not to Drink Bottled Water”. 1 pag. Online. Internet. 2010. Available: http://www.mnn.com/food/healthy-eating/stories/5-reasons-not-to drink-bottled-water. Boston Properties. “Sustainability”. 1 pag. Online. Internet. 2011. Available:
http://ir.bostonproperties.com/phoenix.zhtml?c=120176&p=irol sustainability_home.
Brandywine Realty Trust. “Brandywine Sustainability Intro 1”. Radnor, PA. 2010. Chain Store Age. “PREIT’s 801 Market Street Building Earns LEED Gold”. 1 pag. Online.
Internet. 2010. Available: http://www.chainstoreage.com/article/preit%E2%80%99s-801-market-street-building-earns-leed-gold.
Dazor. “Green Lights: A Bright Investment in the Environment”. 1 pag. Online. Internet. 2011. Available: http://www.dazor.com/green-lights.html.
Fuel Emission Factors. Excel Chart. U.S. Energy Information Administration, 2011. Fuertes, Gwen. “Change in Occupancy Requirement for LEED Existing Buildings: Operations & Maintenance”. 1 pag. Online. Internet. 2009. Available: http://www.usgbc.org/News/USGBCInTheNewsDetails.aspx?ID=4190. Grady, C. et al. “Effects of Green Buildings on Employee Health and Productivity”. American Journal of Public Health 15 July, 2010. Green Building Cost Graph 1. Chart. Sustainable Building Services, LLC, 2010. Highwoods Properties. “Servies & Solutions: Sustainability”. 1 pag. Online. Internet.
2011. Available: http://www.highwoods.com/services/sustainability.aspx. Hincha-Ownby, Melissa. “Green Buildings = Increased Worker Productivity”. 1 pag. Online. Internet. 2009. Available: http://www.mnn.com/money/green workplace/blogs/green-buildingsincreasedworker-productivity. Hsu, Tiffany. “Time to Update the ENERGY STAR Program?”. 1 pag. Online. Internet. 2010. Available: http://latimesblogs.latimes.com/greenspace/2010/08/energy star-energy-efficiency.html. Kay, Russell. “QuickStudy: LEED Certification”. Computerworld Feb. 2008. USGBC in the News Details. Online. 15 Feb. 2008. LEED 2009 for Existing Buildings: Operations and Maintenance. Chart. U.S. Green Building Council, 2009. Liberty Property Trust. Leadership in Sustainable Development. Malvern, PA. 2011. Lorenz, Courtney. Personal interview. 7 Mar. 2011. Macerich. “Focused on the Future, Today”. 1 pag. Online. Internet. 2011. Available:
http://www.macerich.com/experience/social/sustainability.aspx. Mack-Cali Realty Corporation. “Awards”. 1 pag. Online. Internet. 2010. Available:
http://www.mack-cali.com/about-2010-awards. McDermott, Mat. “LEED Buildings Make Workers Feel More Productive & Healthier”. 1 pag. Online. Internet. 2010. Available:
http://planetgreen.discovery.com/work-connect/leed-buildings-workers-feel-more-productivehealthier.html#.
54
Miller, Norm and Pogue, Dave et al. “Green Buildings and Productivity”. Journal of Sustainable Real Estate 1.1 (2009). National Association of Real Estate Investment Trusts (NAREIT). “NAREIT Announces 2010 Leader in the Light Award Winners”. 1 pag. Online. Internet. 2010. Available:
http://www.reit.com/Articles/NAREIT%20Announces%202010%20Leader%20in%20the%20Light%20Award%20Winners.aspx.
Proefrock, Philip. “LEED Version 3 is Coming”. 1 pag. Online. Internet. 2008. Available: http://greenbuildingelements.com/2008/05/19/leed-version-3-is-coming/#. Southwest Florida Water Management District. “Office Building Checklist”. 1 pag. Online.
Internet. 1997. Available: http://www.swfwmd.state.fl.us/conservation/waterwork/checklist-office.html. The Lundy Group. “LEED History”. 1 pag. Online. Internet. 2009. Available: http://www.lundygroup.com/current-projects/green-projects-leed-certified/leed history/. The White House Office of Media Affairs. “President Obama’s Plan to Win the Future by Making American Businesses More Energy Efficient thorough the ‘Better Buildings Initiative’”. 1 pag. Online. Internet. 2011. Available: http://www.whitehouse.gov/the-pressoffice/2011/02/03/president-obama-splan win-future-making-american-businesses-moreenergy. U.S. Department of Energy. “Electric Power”. 1 pag. Online. Internet. Available: http://www.energy.gov/energysources/electricpower.htm. U.S. Energy Information Administration. “Office Buildings: How Do They Use Energy and How Much Does it Cost?”. 1 pag. Online. Internet. 2000. Available: http://www.eia.doe.gov/emeu/consumptionbriefs/cbecs/pbawebsite/office/offic _howuseengy.htm. U.S. Environmental Protection Agency. “Air Emissions”. 1 pag. Online. Internet. 2007. Available: http://www.epa.gov/cleanenergy/energy-and-you/affect/air emissions.html. U.S. Environmental Protection Agency. Benchmark with EPA’s ENERGY STAR Portfolio Manager. Washington, DC. 2011. U.S. Environmental Protection Agency. ENERGY STAR 2009 Annual Report. 2010. http://www.energystar.gov/. U.S. Environmental Protection Agency & U.S. Department of Energy. “Apply for the ENERGY STAR for Your Buildings”. 1 pag. Online. Internet. 2011. Available: http://www.energystar.gov/index.cfm?c=evaluate_performance.bus_portfolioman ger_intro. U.S. Environmental Protection Agency & U.S. Department of Energy. Are You Ready to Take Advantage of the Commercial New Tax Incentives?. Washington, DC. 2005. U.S. Environmental Protection Agency & U.S. Department of Energy. “Carbon Emissions From Building Energy Use”. 1 pag. Online. Internet. 2003. Available: http://www.energystar.gov/index.cfm?c=evaluate_performance.bus_portfolioman ger_carbon. U.S. Environmental Protection Agency & U.S. Department of Energy. “Criteria for Rating Building Energy Performance”. 1 pag. Online. Internet. 2011. Available: http://www.energystar.gov/index.cfm?c=eligibility.bus_portfoliomanager_eligibility
55
U.S. Environmental Protection Agency & U.S. Department of Energy. “History of ENERGY STAR”. 1 pag. Online. Internet. 2011. Available: http://www.energystar.gov/index.cfm?c=about.ab_history. U.S. Environmental Protection Agency & U.S. Department of Energy. “How the Rating System Works”. 1 pag. Online. Internet. 2011. Available: http://www.energystar.gov/index.cfm?c=evaluate_performance.pt_neprs_learn. U.S. Environmental Protection Agency & U.S. Department of Energy. “Major Milestones”. 1 pag. Online. Internet. 2011. Available: http://www.energystar.gov/index.cfm?c=about.ab_milestones. U.S. Environmental Protection Agency & U.S. Department of Energy. “Portfolio Manager Overview”. 1 pag. Online. Internet. 2011. Available: http://www.energystar.gov/index.cfm?c=evaluate_performance.bus_portfolioman ger. U.S. Environmental Protection Agency & U.S. Department of Energy. “The ENERGY STAR for Buildings and Manufacturing Plants”. 1 pag. Online. Internet. 2011. Available: http://www.energystar.gov/index.cfm?c=business.bus_bldgs. U.S. Green Building Council. Buildings and Climate Change. Washington, DC. 2005. U.S. Green Building Council. “LEED for Existing Buildings”. 1 pag. Online. Internet. 2011. Available: http://www.usgbc.org/DisplayPage.aspx?CMSPageID=221. U.S. Green Building Council. LEED for Existing Buildings: O&M - Introduction. Washington, DC. 2009. U.S. Green Building Council. “LEED Projects and Case Studies Director”. 1 pag. Online. Internet. 2011. Available: http://www.usgbc.org/LEED/Project/CertifiedProjectList.aspx. U.S. Green Building Council. “LEED Version 3”. 1 pag. Online. Internet. 2009. Available: http://www.usgbc.org/DisplayPage.aspx?CMSPageID=1970. Vornado Realty Trust. “Sustainability”. 1 pag. Online. Internet. 2011. Available:
http://www.vno.com/sustainability.phtml. Wargo, John. “LEED Building Standards Fail to Protect Human Health”. 1 pag. Online. Internet. 2010. Available:
http://e360.yale.edu/feature/leed_building_standards_fail_to_protect_human_health/2306/.