1 jonathan brallier and matthew donahue. 2 company overview
Post on 20-Dec-2015
214 views
TRANSCRIPT

1111
Jonathan BrallierJonathan Brallierand and
Matthew DonahueMatthew Donahue
Jonathan BrallierJonathan Brallierand and
Matthew DonahueMatthew Donahue

2222
Company OverviewCompany OverviewCompany OverviewCompany Overview
3333
Company OverviewCompany OverviewCompany OverviewCompany Overview
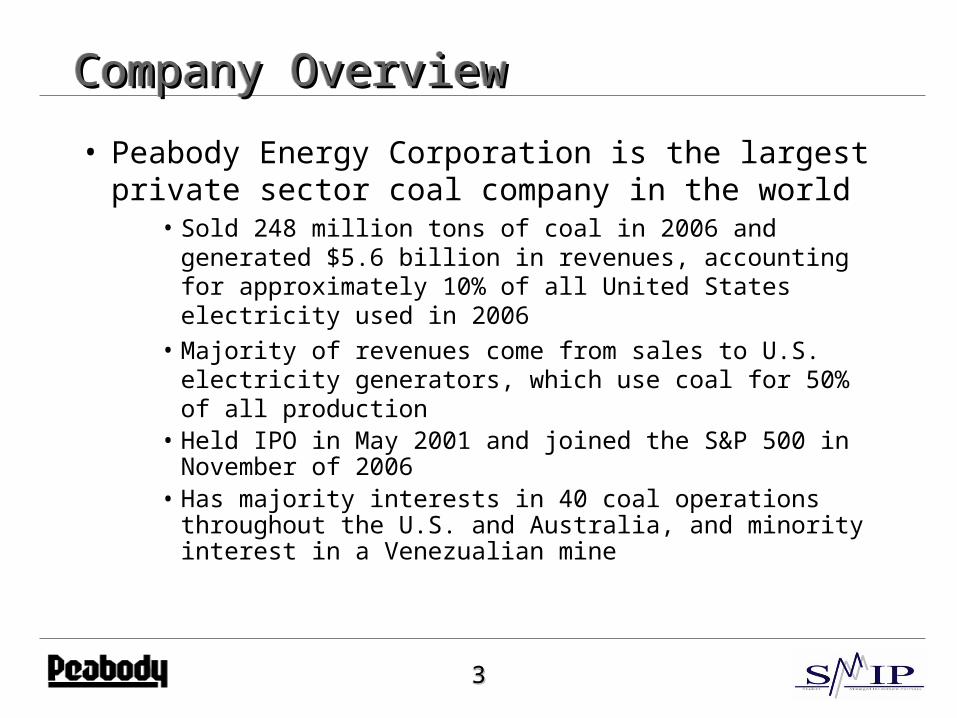
• Peabody Energy Corporation is the largest private sector coal company in the world
• Sold 248 million tons of coal in 2006 and generated $5.6 billion in revenues, accounting for approximately 10% of all United States electricity used in 2006
• Majority of revenues come from sales to U.S. electricity generators, which use coal for 50% of all production
• Held IPO in May 2001 and joined the S&P 500 in November of 2006
• Has majority interests in 40 coal operations throughout the U.S. and Australia, and minority interest in a Venezualian mine

4444
Company OverviewCompany OverviewCompany OverviewCompany Overview
• Operations also include marketing, brokering, and trading coal worldwide
• Traded almost 80 million tons of coal in 2006
• Created an international trading group in 2006
• Recently added operations offices in Europe and Beijing to further its global reach

5555
Company OverviewCompany OverviewCompany OverviewCompany Overview

6666
Financial Ratio AnalysisFinancial Ratio AnalysisFinancial Ratio AnalysisFinancial Ratio Analysis

7777
Financial Ratio AnalysisFinancial Ratio AnalysisFinancial Ratio AnalysisFinancial Ratio Analysis
Ratio Company Industry Sector S&P 500
P/E Ratio (TTM) 19.90 20.69 13.16 20.75
P/E High - Last 5 Yrs. 46.55 44.98 30.34 36.71
P/E Low - Last 5 Yrs. 6.29 7.20 10.28 14.57
Dividend Yield 0.55 1.41 1.83 2.10
Dividend Yield - 5 Year Avg. 0.70 1.49 1.82 1.81
Quick Ratio (MRQ) 0.66 1.01 1.04 1.16
Current Ratio (MRQ) 0.93 1.45 1.47 1.69
LT Debt to Equity (MRQ) 1.35 1.05 0.33 0.64
Total Debt to Equity (MRQ) 1.40 1.09 0.38 0.73

8888
Financial Ratio AnalysisFinancial Ratio AnalysisFinancial Ratio AnalysisFinancial Ratio Analysis
Ratio Company Industry Sector S&P 500
Gross Margin (TTM) 19.60 26.32 37.92 45.14 EBITD Margin (TTM) 19.34 23.85 29.94 22.17 Operating Margin (TTM) 12.62 15.18 22.77 19.82 Pre-Tax Margin (TTM) 10.10 10.74 21.12 18.53 Net Profit Margin (TTM) 11.65 12.54 14.82 13.52
Return On Assets (TTM) 7.49 8.30 14.34 8.08 Return On Investment (TTM) 8.79 9.96 18.34 12.07 Return On Equity (TTM) 26.60 24.64 29.09 19.95
Receivable Turnover (TTM) 17.83 12.96 11.03 10.70
Inventory Turnover (TTM) 11.00 16.17 20.73 12.30
Asset Turnover (TTM) 0.64 0.77 1.32 0.97

9999
Risk FactorsRisk FactorsRisk FactorsRisk Factors

10101010
• Unexpected termination of long term contracts
• Approximately 90% of revenue comes from long-term supply arrangements, the durations of which vary from one to 19 years
• Contracts often have detailed provisions that require Peabody to meet certain quality and service expectations
• Failure to meet these requirements can lead to severe economic consequences
Risk FactorsRisk FactorsRisk FactorsRisk Factors

11111111
• Soured relationships with major suppliers • Over 20% of revenue comes from the
company’s five largest customers
• Leverage could lead to financial stress• Peabody has approximately $1.4 billion in debt
and about $500 million more in available credit
• Peabody hedges commodity price risk by using long-term contracts for coal sales
Risk FactorsRisk FactorsRisk FactorsRisk Factors

12121212
• The company also hedges commodities used in production through fixed price contracts and derivatives
• As the end of 2005, the company had fixed price contracts for 68.9 million gallons of diesel fuel
• The company uses forward contracts, swaps, and options to hedge currency and interest rate fluctuations
Risk FactorsRisk FactorsRisk FactorsRisk Factors

13131313
Recent NewsRecent NewsRecent NewsRecent News

14141414
Recent NewsRecent NewsRecent NewsRecent News
• Mild weather has led to decreased demand for coal
• Companies have been forced to decrease production this year due to high inventory levels and poor demand
• Recent steam coal prices have hovered around $40 per ton, compared to last year’s price of $56
• Coal from the Powder River Basin is slightly over $7 per ton, versus $21 from last year

15151515
Recent NewsRecent NewsRecent NewsRecent News
• CEO Gregory Boyce recently told reporters that Peabody is “managing [its] U.S. production and capital to match demand”
• Reduced capacity will help reduce costs, thus strengthening sluggish revenues
• Merrill Lynch analyst David Lipschitz expects weak industry wide earnings for the first half of 2007 until production cuts take effect

16161616
SWOT AnalysisSWOT AnalysisSWOT AnalysisSWOT Analysis

17171717
• Non-union mines account for 86% of production• About 90% of revenues come from long term contracts, thus
mitigating price fluctuations• Ability to grow organically as well as through strategic
acquisition opportunities• Development of integrated information system, expected to be
fully operational by mid-2007, that will streamline international operations in finance, marketing, materials, human resources, sales, production, etc.
• Safetey record, measured by accident frequency rates, exceeded the industry average by 38%
SWOT AnalysisSWOT AnalysisSWOT AnalysisSWOT Analysis
StrengthsStrengthsStrengthsStrengths

18181818
• #1 market position in U.S. does not leave much room for growth domestically
• Central Appalachia’s coal reserve is of declining quality
• High sulfur levels in Illinois Basin coal and high mercury levels in Powder River Basin coal
SWOT AnalysisSWOT AnalysisSWOT AnalysisSWOT Analysis
WeaknessesWeaknessesWeaknessesWeaknesses
19191919
• Recently established an office in Beijing to pursue new markets and growth opportunities
• Participation in emerging technologies such as Btu conversion, a process that turns coal into natural gas, liquid, or hydrogen
SWOT AnalysisSWOT AnalysisSWOT AnalysisSWOT Analysis
OpportunitiesOpportunitiesOpportunitiesOpportunities

20202020
• Current litigation related to one of the company’s largest supply agreements• Current litigation could cost Peabody several billion
dollars; however, the company claims to “have recorded adequate reserves for these liabilities and that there is no individual case pending that is likely to have a material adverse effect on our financial condition” (2006 10-k)
• Continual reform of industry regulations and standards regarding safety and waste
SWOT AnalysisSWOT AnalysisSWOT AnalysisSWOT Analysis
ThreatsThreatsThreatsThreats

21212121
Industry OverviewIndustry OverviewIndustry OverviewIndustry Overview

22222222
Industry OverviewIndustry OverviewIndustry OverviewIndustry Overview
• Coal generates over 50% of electric power and provides 85% of fossil fuel reserves in the United States
• Coal supply is reliable and relatively inexpensive compared to other energy sources
• Investments in the industry are an excellent hedge against inflation and downturns in the market
• Decreasing labor costs and low unionization will benefit shareholders
• Paul Forward, formerly of Legg Mason, projects demand growth at 3% per year, with prices increasing at 4.6% per year

23232323
Industry OverviewIndustry OverviewIndustry OverviewIndustry Overview
• Coal is not as “clean” as other alternative energy sources, such as wind or solar power
• Democratic control could lead to restrictions on production– History has shown that coal performs better under
republican administrations, and vice versa– Increasing surface mining restrictions– Air pollution legislation often calls for increased capital
requirements, thus draining operating profits

24242424
Relevant Investor InformationRelevant Investor InformationRelevant Investor InformationRelevant Investor Information

25252525
Relevant Investor InformationRelevant Investor InformationRelevant Investor InformationRelevant Investor Information

26262626
Relevant Investor InformationRelevant Investor InformationRelevant Investor InformationRelevant Investor Information

27272727
Relevant Investor InformationRelevant Investor InformationRelevant Investor InformationRelevant Investor Information

28282828
Relevant Investor InformationRelevant Investor InformationRelevant Investor InformationRelevant Investor Information
• Quarterly dividend of $0.06 per share yields a weak 0.6%

29292929
Comparables Model Comparables Model Comparables Model Comparables Model
30303030
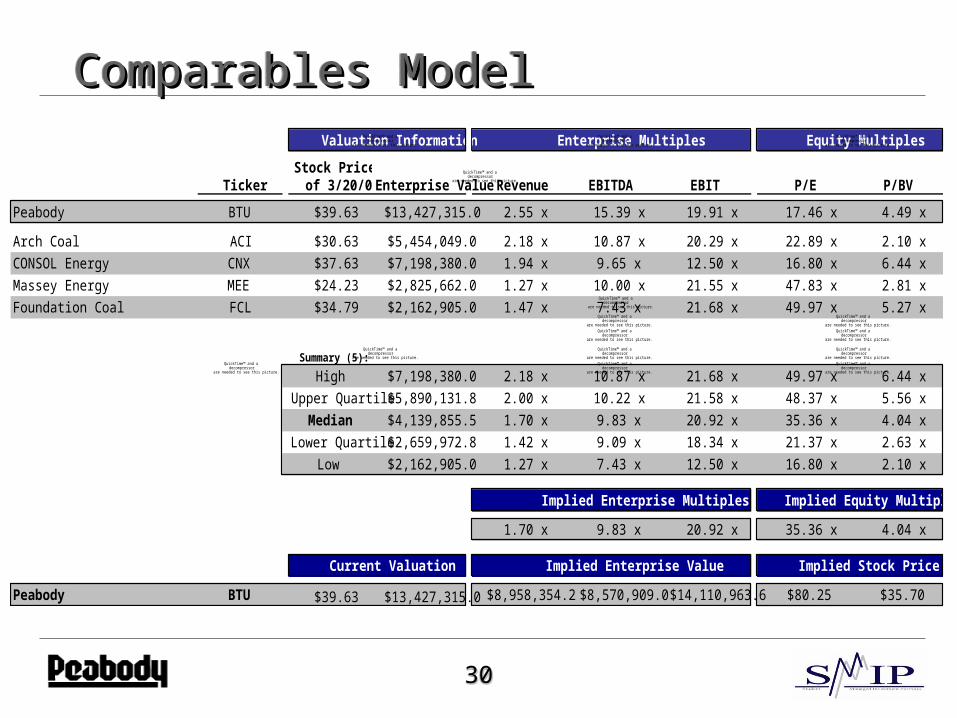
Comparables ModelComparables ModelComparables ModelComparables ModelValuation Information Enterprise Multiples Equity Multiples
TickerStock Price as
of 3/20/07 Enterprise Value Revenue EBITDA EBIT P/E P/BV
Peabody BTU $39.63 $13,427,315.0 2.55 x 15.39 x 19.91 x 17.46 x 4.49 x
Arch Coal ACI $30.63 $5,454,049.0 2.18 x 10.87 x 20.29 x 22.89 x 2.10 x
CONSOL Energy CNX $37.63 $7,198,380.0 1.94 x 9.65 x 12.50 x 16.80 x 6.44 x
Massey Energy MEE $24.23 $2,825,662.0 1.27 x 10.00 x 21.55 x 47.83 x 2.81 x
Foundation Coal FCL $34.79 $2,162,905.0 1.47 x 7.43 x 21.68 x 49.97 x 5.27 x
Summary (5):
High $7,198,380.0 2.18 x 10.87 x 21.68 x 49.97 x 6.44 x
Upper Quartile $5,890,131.8 2.00 x 10.22 x 21.58 x 48.37 x 5.56 x
Median $4,139,855.5 1.70 x 9.83 x 20.92 x 35.36 x 4.04 x
Lower Quartile $2,659,972.8 1.42 x 9.09 x 18.34 x 21.37 x 2.63 x
Low $2,162,905.0 1.27 x 7.43 x 12.50 x 16.80 x 2.10 x
Implied Enterprise Multiples Implied Equity Multiples
1.70 x 9.83 x 20.92 x 35.36 x 4.04 x
Current Valuation Implied Enterprise Value Implied Stock Price
Peabody BTU $39.63 $13,427,315.0 $8,958,354.2 $8,570,909.0 $14,110,963.6 $80.25 $35.70
QuickTime™ and a decompressor
are needed to see this picture.
QuickTime™ and a decompressor
are needed to see this picture.
QuickTime™ and a decompressor
are needed to see this picture.
QuickTime™ and a decompressor
are needed to see this picture.
QuickTime™ and a decompressor
are needed to see this picture.
QuickTime™ and a decompressor
are needed to see this picture.
QuickTime™ and a decompressor
are needed to see this picture.
QuickTime™ and a decompressor
are needed to see this picture.
QuickTime™ and a decompressor
are needed to see this picture.
QuickTime™ and a decompressor
are needed to see this picture.
QuickTime™ and a decompressor
are needed to see this picture.
QuickTime™ and a decompressor
are needed to see this picture.
QuickTime™ and a decompressor
are needed to see this picture.
QuickTime™ and a decompressor
are needed to see this picture.
QuickTime™ and a decompressor
are needed to see this picture.
31313131
eVal eVal eVal eVal

32323232
eValeValeValeVal
Estimated Price/Share=$35.52
Company Name: PEABODY ENERGY CORP
Required Valuation Parameters (to compute value of common equity):10.00%
03/21/071.00
Enter Cost of Debt: ----------------------------------------------------------------------------------------------> 8.00%Enter Cost of Preferred Stock: -----------------------------------------------------------------------------> 9.00%
Implied Cost of Equity CalculatorThis calculator solves for the cost of equity capital that generates a given price/share.To use the calculator, enter a price, hit return and click the 'Calculate' button.
Price/Share = $35.52 1.000000
Valuation Parameters
Enter Cost of Equity Capital:
Enter Date of Valuation:Enter Value of Contingent Claims on Common Equity ($000):
-------------------------------------------- -------------------------------->Enter Dilution Factor for Splits Occurring Since Latest Fiscal Year End:------------>
----------------------------------------------------------------------------->
Optional Valuation Parameters (to compute value to all investors):
---------------------------->

33333333
eValeValeValeVal
Model Summary
Historical Data For:PEABODY ENERGY CORP Most Recent Fiscal Year End: 1/1/11Average ROE (last five years) 15.79%Sales Growth (last five years) 14.11%
Forecast Data:Forecast Horizon 5 YearsThis Year's ROE 22.04%Terminal Year's ROE 20.47%This Year's Sales Growth 11.81%Terminal Year's Sales Growth 5.00%This Year's Forecast EPS $2.13Forecast 5 Year EPS Growth 10.01%
Valuation Data:Cost of Equity Capital 10.00%Valuation Date 3/22/11Estimated Price/Share $35.52Estimated Price/Earnings Ratio 16.71Estimated Market/Book Ratio 3.94
Sensitivity Analysis
Forecast Horizon 5 Years
This Year's ROE (%) 22.04%
Terminal Year's ROE (%) 20.47%
This Year's Sales Growth (%) 11.81%
Terminal Year's Sales Growth (%) 5.00%
Cost of Equity Capital (%) 10.00%
Estimated Price/Share $35.52
Sensitivity Analysis
Forecast Horizon 5 Years
This Year's ROE (%) 22.04%
Terminal Year's ROE (%) 23.00%
This Year's Sales Growth (%) 11.81%
Terminal Year's Sales Growth (%) 7.00%
Cost of Equity Capital (%) 10.00%
Estimated Price/Share $59.96
34343434
Recommendation Recommendation Recommendation Recommendation

35353535
Recommendation Recommendation Recommendation Recommendation
• Moderate Buy
• Analyst Paul Forward recommends Buy
• Yahoo Finance - 7 Strong Buys, 9 Buys, 4 Holds
• MoneyCentral - 7 Strong Buys, 3 Moderate Buys, 3 Holds, 1 Moderate Sell
• Reuters - 6 Buy, 9 Outperform, 5 Hold