1 introduction wald tests p – values likelihood ratio tests statistical inference 3. hypotheses...
TRANSCRIPT

1
Introduction
Wald tests
p – values
Likelihood ratio tests
STATISTICAL INFERENCE
3. Hypotheses testing

2
Goal: not finding a parameter value, but deciding on the validity of a statement about the parameter . This statement is the null hypothesis and the problem is to retain or to reject the hypothesis using the sample information.
Null hypothesis :Alternative hypothesis :
. ,..., ; 1 iidXXFX n
00 : H01 : H
Hypotheses testing: introduction
STATISTICAL INFERENCE

3
Four different outcomes:
TRUE
AC
CE
PT
Type I error
Type II error
H0
H0
H1
H1
Type I error : reject H0 | H0 is trueType II error : accept H0 | H0 is false
STATISTICAL INFERENCE
Hypotheses testing: introduction
4
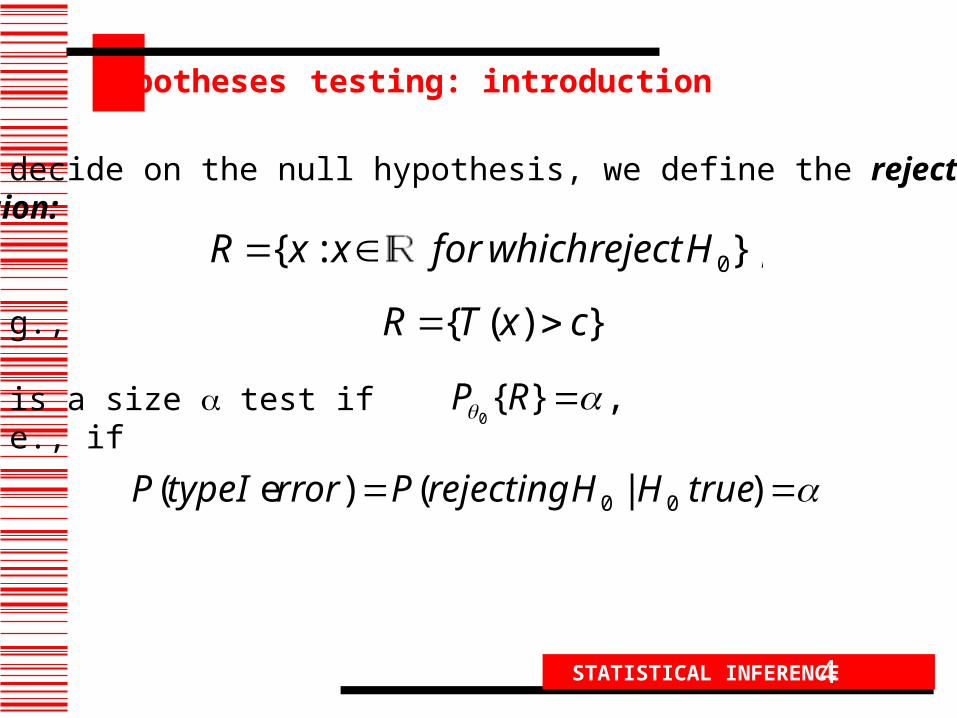
To decide on the null hypothesis, we define the rejectionregion:
e. g.,
It is a size test if i. e., if
}, :{ 0HrejectwhichforxxR
})({ cxTR
,}{0
RP
)|()e ( 00 trueHHrejectingPrrorItypeP
STATISTICAL INFERENCE
Hypotheses testing: introduction

5
Simple hypothesis
Composite hypothesis
Two-sided hypothesis
One-sided hypothesis
00 : H
00 : H
00 : H
00 : H
STATISTICAL INFERENCE
Hypotheses testing: introduction
6
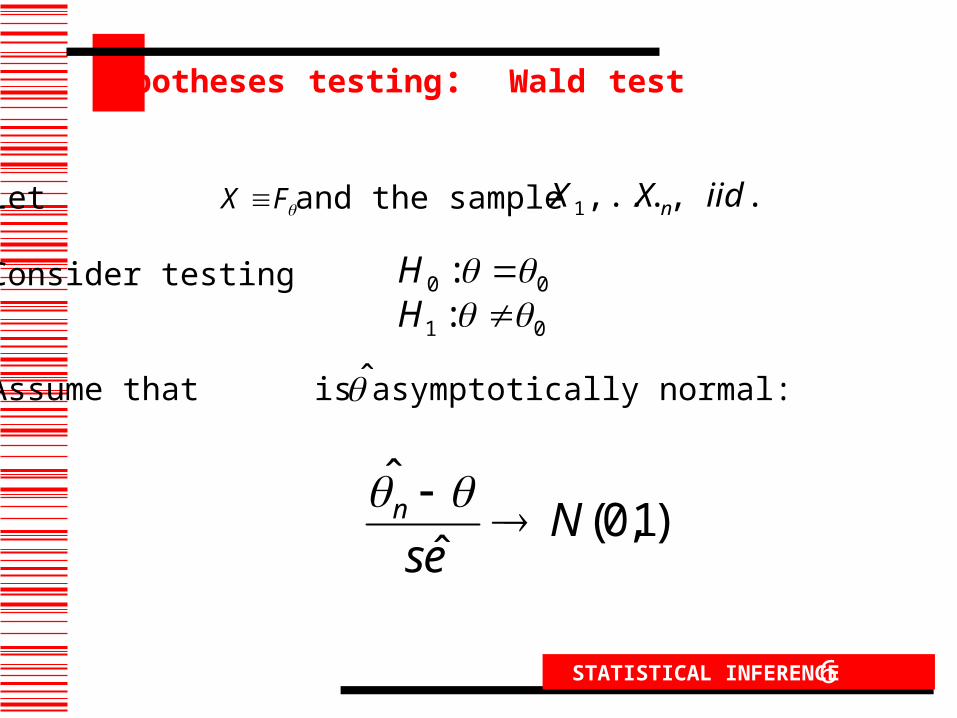
Let and the sample
Consider testing
Assume that is asymptotically normal:
FX .,...,1 iidXX n
01
00
::
HH
)1,0(ˆ
ˆN
esn
Hypotheses testing: Wald test
STATISTICAL INFERENCE

7
The rejection region for the Wald test is:
and the size is asymptotically .
The Wald test provides a size test for thenull hypothesis .: 00 H
STATISTICAL INFERENCE
Hypotheses testing: Wald test
2/0
ˆ
ˆ
z
esR n

Hypotheses testing: p-value
8INFERENCIA ESTADÍSTICA
We want to test if the mean of is zero.
Let and denote by the values of a particular sample.
Consider the sample mean as the test statistic:
)1,(NX )0:( 0 H
iidXX n be ,...,1
nxxx ...,, ,21
n
iiXn
X1
1

Hypotheses testing: p-value
9INFERENCIA ESTADÍSTICA
We use a distance to test the null hypothesis:
;0)0,( XXXd

Hypotheses testing: p-value
10INFERENCIA ESTADÍSTICA
H0 is rejected when is large, i. e., when is large.
This means that is in the distribution tail. The probability of finding a value more extreme thanthe observed one is
This probability is the p-value.
)0,(xdx
xxd )0,(
).|(| xXPp
11
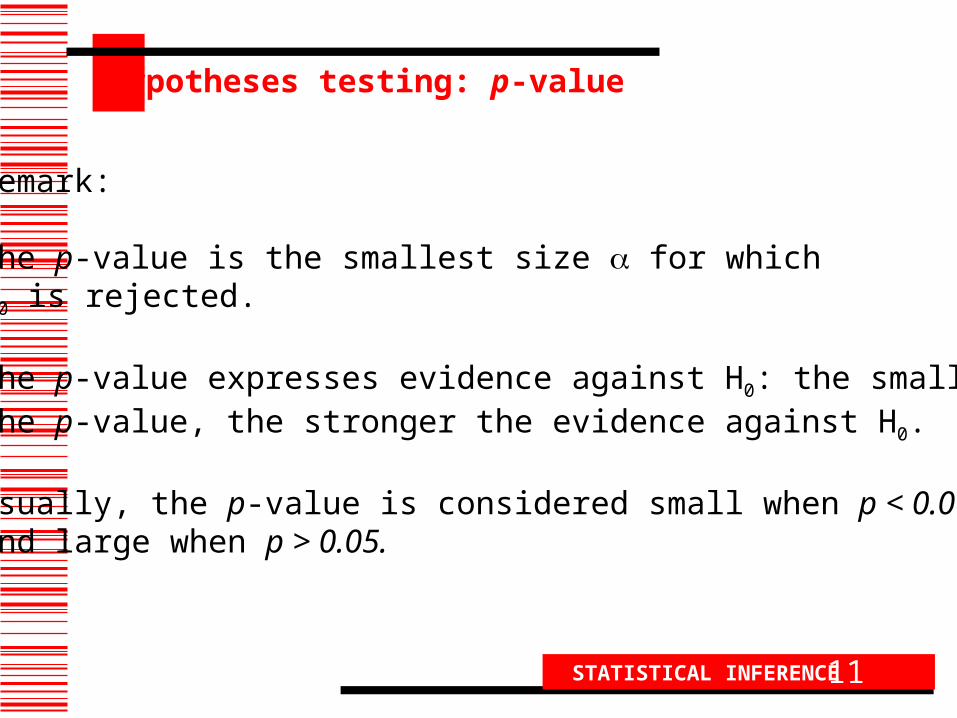
Remark:
The p-value is the smallest size for whichH0 is rejected.
The p-value expresses evidence against H0: the smaller the p-value, the stronger the evidence against H0.
Usually, the p-value is considered small when p < 0.01 and large when p > 0.05.
STATISTICAL INFERENCE
Hypotheses testing: p-value

Hypotheses testing: likelihood ratio test
12INFERENCIA ESTADÍSTICA
Given , we want to test a hypothesisabout with a sample
For instance:
Under each hypothesis, we obtain a different likelihood:
FX ~ . ,...,1 iidXX n
11
00
::
HH
)...;()...;(
11
10
n
n
xxLxxL
13
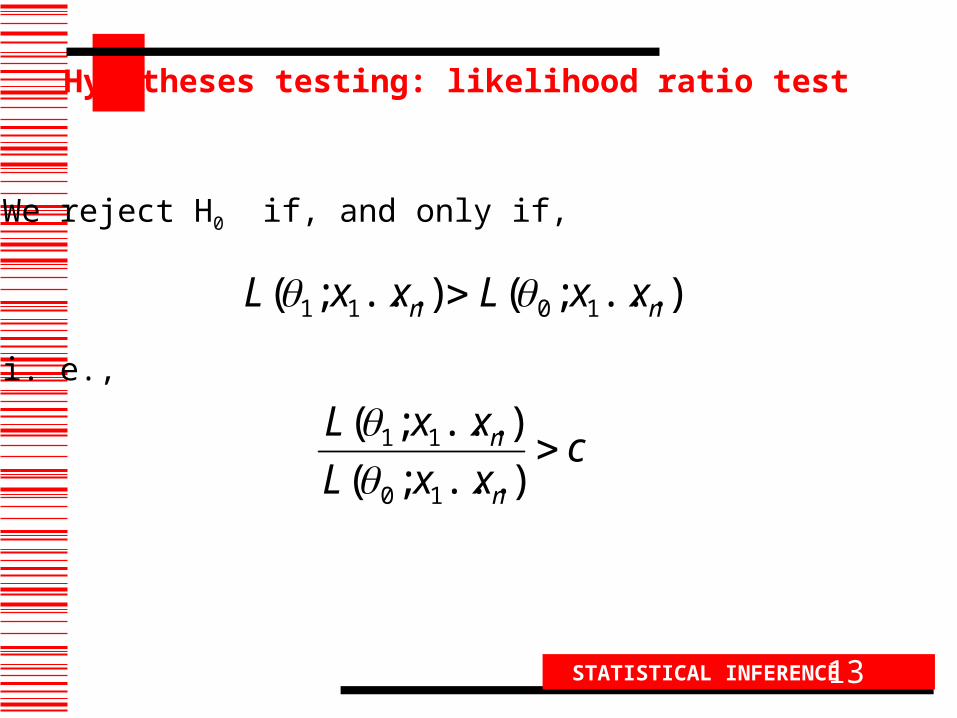
We reject H0 if, and only if,
i. e.,
STATISTICAL INFERENCE
Hypotheses testing: likelihood ratio test
),...;()...;( 1011 nn xxLxxL
cxxL
xxL
n
n )...;(
)...;(
10
11

14
The general case is
where is the parametric space.
We reject H0
11
00
:
:
H
H
10
STATISTICAL INFERENCE
Hypotheses testing: likelihood ratio test
cxxL
xxL
n
n
)...;(max
)...;(max
1
1
0
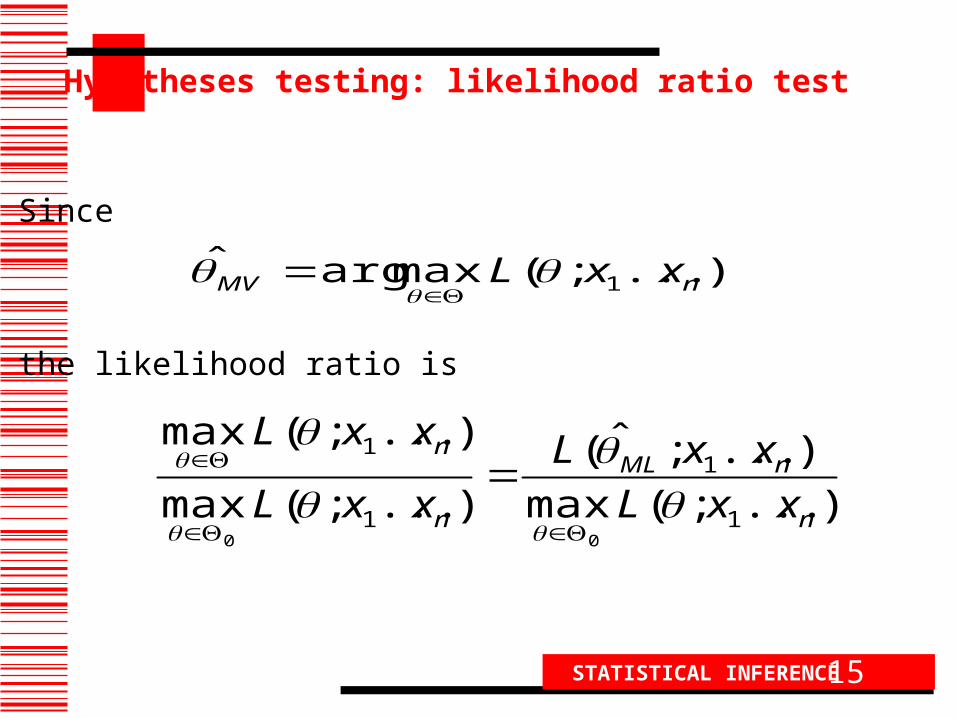
15
Since
the likelihood ratio is
STATISTICAL INFERENCE
Hypotheses testing: likelihood ratio test
),...;(maxargˆ1 nMV xxL
)...;(max
)...;ˆ(
)...;(max
)...;(max
1
1
1
1
00n
nML
n
n
xxL
xxL
xxL
xxL

16
and the rejection region is
STATISTICAL INFERENCE
Hypotheses testing: likelihood ratio test
.)...;(max
)...;ˆ(
1
1
0
cxxL
xxLR
n
nML

17
The likelihood ratio statistic is
STATISTICAL INFERENCE
Hypotheses testing: likelihood ratio test
.)...;(max
)...;ˆ(log2
1
1
0n
nML
xxL
xxL

18
Theorem
Assume that . Let
Let λ be the likelihood ratio test statistic. Under
where r-q is the dimension of Θ minus the dimension of Θ0. The p-value for the test is P{χ2
r-q >λ}.
STATISTICAL INFERENCE
Hypotheses testing: likelihood ratio test
2q-r
00
,01,010
11
,:
.),...(),...,(:
),...,,...,(
H
rqrq
rqq