1. introduction - imos.org.auimos.org.au/fileadmin/user_upload/shared/imos general/acomo/ext… ·...
TRANSCRIPT
Key Bluewater observing systems and datasets; and their use in modelling
Ken Ridgway1, Eric Schulz2, Peter Oke1, Susan Wijffels1, Peter Strutton3, Boris Kelly‐Gerreyn2
1 CSIRO Marine & Atmospheric Research.
2 Bureau of Meteorology
3 Institute for Marine and Antarctic Studies, University of Tasmania
1. Introduction
In this paper the main in situ Bluewater data systems are summarized and their application to ocean modelling is described. Observations are collected for characterizing aspects of the ocean. These include, determining the spatial structure of mean properties through the water column, resolving temporal changes at seasonal, interannnual, and multi‐decadal, capturing global parameters such as sea level, heat content, and to track fluxes of heat, salt and carbon through the atmosphere and ocean. Observation systems need to be designed to resolve both high‐frequency changes for operational requirements as well as high‐quality long‐term time series for climate studies. High‐quality datasets are used to initialise and to provide model forcing fields, to assimilate into models and to provide reference fields for model validation. To ensure full integration of observations with models, a systematic and long‐term strategy incorporating development of metadata standards and automated data analysis, implementation of large‐scale observatory programmes, improvement of observation‐model links, and efficient sampling strategies. Finally, these elements should be tied together in an observation‐modelling framework, coordinated by international organizations, to improve our understanding and quantification of open‐ocean dynamics.
2. Observing Systems
Argo Array
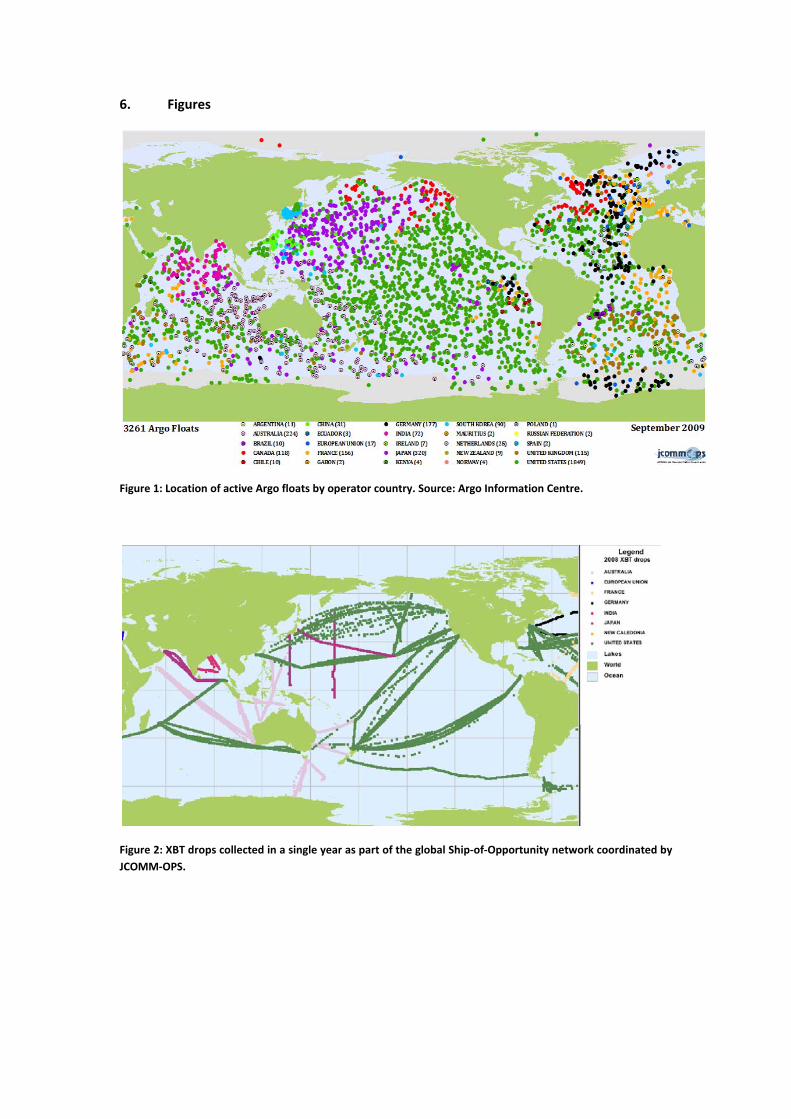
A global array of profiling floats that measure temperature and salinity down to 2000m every 10 days in real time (www.argo.net). The array has proven to be very robust with many floats surpassing their projected lifespan‐ it has now reached a design coverage of more than 3000 floats with a spatial resolution of 3°x3°. This is the first time that the oceans have been sampled with a full global coverage and Argo is now the essential and dominant in situ data stream for ocean and climate research and prediction/reanalyses
Australian deployments of 60 floats/year are required to maintain the 50% contribution in the Australian region which will sustain an array of 210‐230 floats. In the medium term there is no prospect of “operational” funding and support must remain in research sector. The Argo core mission does not measure BGC parameters, nor in marginal seas or under ice.

XBT network
Repeat temperature sections through regional flow systems to monitor variability of regional circulation and temperature structure. Two modes of operation are maintained: frequently repeated (FRX‐ fortnightly with low spatial resolution) and high density (HD ‐ typically once per season but at eddy resolving spatial sampling). There are nearly 20 years of sustained sampling on some lines giving insight into decadal flow variability. These lines are the only existing means of monitoring regional current transport and heat flux variability. However, they are an imperfect tool for WBC monitoring – they are shallow (700m); provide no velocity data; or no corresponding salinity, biogeochemical or ecosystem information.
Australia is a major international contributor to this network (Figure 2) and has a solid longterm partnership with the US program (dominant global contributor). We have proven technical capability and strong relationships with shipping industry and operators
The quality control (QC) system is well bedded down, as is data dissemination via the Global Temperature Salinity Profile Program (GTSPP) and to the USA’s National Ocean Data Centre (NODC) in delayed mode
Ship of Opportunity Network
Available vessels, both commercial and research are used as platforms to collect a range of observations including SST, surface flux, biogeochemical, carbon and plankton measurements. Within the IMOS SOOP Facility there is a relatively sparse set of lines measuring different parameters due to ship requirements and availability
Gaps: coverage not national ‐ limited BGC/ecosystem coverage off east and west coast; no lower trophic information on most lines; no consistent data treatment or dissemination to broader community apart from CO2 data; marine meteorological information poor and insufficient for air/sea flux estimates
High accuracy sea surface temperature data are collected to extend coverage in the Australian region and calibrate surface temperature products from satellites (via the Global High Resolution Sea Surface Temperature Project GHRSST (http://ghrsst‐pp.metoffice.com/pages/GHRSST‐PO/index.htm ). IMOS funding has allowed several new vessels to be instrumented with hull‐mounted sensors and real‐time transmission capability.
High‐quality meteorological measurements have been set up to enable the calculation of accurate air‐sea flux estimates. Through IMOS meteorological measurements on several research vessels of opportunity were upgraded. The data streams will be contributed to the global Shipboard Automated Meteorological and Oceanographic System (SAMOS) project (http://samos.coaps.fsu.edu/html/)
Several research vessels have been instrumented with an underway pCO2 system. This data stream is aimed primarily at filling regional and seasonal gaps in an effort to improve the seasonal climatology of air‐sea carbon fluxes, particularly on the Australian shelves and offshore regional seas. The instrumentation of a repeat SOOP line on l’ Astrolabe which provides repeat transects in October to March to track the variability in carbon fluxes over
the poorly sampled Southern Oceans. The observational programs on these ships for CO2 is integrated with international efforts to establish the ocean uptake of CO2 (http://www.ioccp.org/) and contribute to the Surface Ocean Carbon Atlas project (SOCAT), developing gridded CO2 products for flux estimates and model testing.
Overall, SOOP is a highly cost effective platform. There are many biogeochemical (BGC) and ecosystem parameters that could not be measured without the SOOP program. The ideal platform is one that has combined BGC, ecosystem and physical measurements on the same ship, but that is not always possible due to ship limitations and not all issues require a complete set of measurements.
Deep Ocean Time Series Sections
These sections provide the only means of collecting high‐quality, high‐resolution (vertically and horizontally) observations of the main properties over the full ocean depth. They are therefore the only method of tracking water mass changes in the deep ocean (below the reach of Argo) and tracking the global carbon and biogeochemical inventories (e.g. oxygen and major nutrients). These data also provide the highest standard for calibration of Argo salinity and temperatures. The high cost of implementing these sections is balanced by the fact that they provide many parameters at high accuracy that cannot be measured in any other way. Unfortunately the high cost means that the lines are relatively sparse and are only repeated every 5‐10 years. Australia takes responsibility for the re‐occupation of key sections in ocean surrounding Australia ‐ Southern Ocean (south of Perth, and Tasmania and
western Pacific at 170°W). The sections are a component of the International Repeat Hydrography and Carbon Program
Gaps: National lack of ability to measure chloroflourocarbons (CFCs) or tritium/helium. Ship time and operational costs are subject to individual applications to the Marine National Facility and annual research funding.
Drifting Buoys
For several years satellite‐tracked drifting buoys have been deployed as Lagrangian drifters which follow the path of water parcels at a selected depth. The most recent version is the Surface‐Velocity Programme Barometer (SVP‐B) drifter which provides both SST and air pressure and surface currents (resultant current arising from Ekman and geostrophic components). The buoys are battery powered and last for up to 2 years and are easily deployed by ships crews. They provide the primary source of air pressure over the ocean (vital for NWP) and the SST data they collect are important climate datasets. The surface current observations provide large scale current patterns and are central validation product for model and satellite derived currents.
Tropical Moored Buoy Arrays
A globally coordinated network of moored buoys that collect both atmospheric (winds, pressure, temperature) and oceanic information (temperature, velocity) in real‐time has been implemented in the equatorial oceans. This array is the core of the ENSO observing

network. Australia is a heavy user of this data stream, both for research and operational purposes, but currently plays no current role in operating this infrastructure.
Gaps: Indian Ocean array (RAMA) is only partly completed. There is a ‘hole’ in the array over the maritime continent and north of Australia.
Bluewater Glider
This may be thought of as a ’smart’ Argo float. That is their depth is controlled by changing buoyancy but unlike floats they also have a horizontal velocity component. This means their paths may be controlled by externally rather than being a passive drifter. However, they only achieve forward speeds of 20‐25 cm/s which limits their ability to negotiate strong currents. Temperature, salinity, dissolved oxygen, turbidity, chlorophyll and CDOM data are collected. As for floats, average velocities between surface fixes can be estimated.
The glider deployments are designed to capture the behaviour of the major boundary currents around Australia (EAC, Leeuwin Current). While the deployments have been very much in pilot mode, where the strengths and limitations of the instruments are being determined, the aim is to generate sustained time series of these current systems. At present glider deployments have been made off eastern Tasmania (EAC Extension), southern Australia (Leeuwin Current Extension), NSW (EAC eddy), and Western Australia (Leeuwin Current). Further deployments to ‘transects from the SOTS site to Hobart’ and north Queensland outside the GBR’ have been included.
Deepwater Mooring Arrays
Bottom‐anchored moorings supporting instruments that span the water column are required for observing the time‐varying ocean currents and water properties over sustained periods of a year or longer. These systems are deployed at strategic locations to capture boundary currents (Gulf Stream, EAC), flow through ‘chokepoints’ (Drake Passage), and other dynamic features. The state of the art for mooring deployment duration is around 1 year for surface moorings and 2‐2.5 years for subsurface systems. While discrete conductivity‐temperature‐pressure sensors and some other devices can easily accommodate a 15‐minute sample rate for 2 or more years, many of the other instruments now available exceed their battery or memory capacities after about a year at this sample rate. The extended durations cited above require sampling at reduced frequency, risking aliasing error. The current systems are very energetic and an extremely robust and expensive array is necessary. Another design requirement is that a transport array fully span the current being studied. Apart from those regions where a current is confined bathymetrically and it is feasible for the array to extend that full distance, the point where a particular current ends can be quite difficult to determine. New IMOS deployments include the ITF array across Timor Strait and the new EAC array east of Brisbane.
Biological Data Streams ‐
In general observing systems for biological data have lagged well behind those of physical properties. This is mainly due to the difficulty of actually measuring biological processes and the fact that appropriate and robust technology is not yet available. However, it must be said that a further constraint is that few international sampling collaborations have been developed to coordinate a global observation program. Two areas in which some progress has been made and which offer the potential to generate long‐term biological time series are presented below.
Bioacoustics are collected by deep water echosounders at single and multiple frequencies to understand pelagic ecosystems. Instruments are operated on research vessels, merchant ships and many fishing vessels on transit over regions of high regional, ecological and oceanic importance to provide sustained repeatable basin scale observations of micronecton communities. This is the only means of sampling species distribution at this mid‐trophic level. Mid‐trophic level organisms regulate the primary production involved in biogeochemical cycles and are forage for top predators. Despite the enormous pelagic realm these organisms occupy and their pivotal role in the functioning of ecosystems linking biogeochemistry to the distribution and abundance of predators, they remain one of the least known components of the ecosystem. Research us underway to fully utilise these data, to quantify and interpret the acoustic output and to assimilate data into ecosystem models.
Continuous Plankton Recorders ‐ The AusCPR survey deploys Continuous Plankton Recorders (CPRs) behind ships of opportunity (SOOPs) and on research vessels in the Southern Ocean in collaboration with the international Scientific Committee for Antarctic Research (SCAR). CPR tows collect plankton samples for subsequent identification in the laboratory. The device can carry instrumentation (e.g., CTD‐F, multispectral fluorescence) onboard. Data products from AusCPR are abundances and species composition of phytoplankton and zooplankton communities, as well as the physical data (temperature, salinity, fluorescence) simultaneously. Plankton produce half the primary production on Earth, contribute to the biological pump drawing‐down CO2 into the deep ocean, support most marine life in the oceans, and are extremely sensitive sentinels of climate change. A critical gap limiting the predictive capability of our ecosystem models is our lack of knowledge on how the plankton community will respond to climate change.
3. Data Quality Control
Observations may both be used to characterize an aspect of the ocean, or for input to an ocean model. In each case we must ensure that erroneous data are removed by applying appropriate data quality control methods. These includes both the more real‐time techniques applied in operational systems as well as delayed mode procedures to produce high quality data for climate research. The most successful and efficient QC procedures are coordinated by international data science teams (eg. Argo SWT). Such teams include representatives from all of the data operators, and user groups to ensure that development of metadata standards and automated data analysis

4. Model Applications
Initialization and surface fluxes
Overview ‐ Ocean model forecasts rely on external forcing to alter the model state once initial conditions are implemented. An important external forcing is air‐sea fluxes (the other is side boundary conditions), which represents the interaction of the atmosphere and ocean. The physical fluxes are momentum (wind), heat and mass (evaporation and precipitation) that act on the surface of the ocean to mix, inject momentum, heat and cool, add and subtract mass, thereby changing density, currents and water mass formation.
The momentum flux is fairly well observed thanks to a succession of satellites carrying scatterometers (Seasat‐A, ERS‐1, ERS‐2, NSCAT, QuickSCAT, ASCAT, OceanSAT2) and providing global, high‐resolution (~25km) coverage on a daily basis. While the importance of air‐sea fluxes is widely recognized for understanding processes from waves generation up to inter‐annual variability, there is only a handful of heat and mass flux products available for ocean modelling and forecasting. The flux products have large uncertainty due, in part, to the limited observations available for development and validation. The lack of suitably accurate satellite observations is a major hindrance to developing high spatio//temporal flux products.
Products available ‐ Flux products can be categorized as in situ‐based, satellite‐based, reanalysis, and hybrid. Readily available turbulent heat flux products (excluding the radiation components) include: FSU3 (Florida State University fluxes); NOC version 2 (National Oceanography Centre); HOAPS2 (Hamburg Ocean‐Atmosphere Parameters from Satellite data); IFREMER fluxes (French Research Institute for Exploitation of the Sea); J‐OFURO (Japanese Ocean Flux Data Sets with Use of Remote Sensing Observations); GSSTF2 (Goddard Satellite‐based Surface Turbulent Fluxes); OAFLUX (objectively analysed fluxes); NCEPR2 (National Centers for Environmental Prediction) JRA (Japanese 25‐year reanalysis); ERA‐40 (European Centre for Medium Range Weather Forecasts reanalysis).
Gaps ‐ The range of flux products suffer from various deficiencies for the coastal ocean modelling community such as coarse temporal (monthly) and spatial (1 degree) resolution, incomplete coverage (some are regional) and poor resolution towards the coast (due to satellite footprint, or coarse NWP grids). The uncertainty of the flux magnitude can also be high with poor agreement between the various products and even disagreement on the sign of the heat flux in some regions.
Efforts are being made to obtain the necessary high quality observations across the range of variables required to estimate bulk fluxes. Programs such as OceanSITES and SAMOS (Shipboard Automated Meteorological and Oceanographic System) aim to consolidate and unify the collection of mooring and ship observations although the networks are sparse and not necessarily optimized for coastal applications.
The Australian IMOS project has undertaken the collection of ship‐based fluxes from three research vessels since 2008. This operates in a “ships of opportunity” mode, collecting observations wherever the vessel goes. Bulk flux observations are also collected on a
mooring in the Southern Ocean, which while not in a coastal setting, can be used to verify the flux uncertainty in various flux products. These bulk flux observations can be used directly when collected in the coastal region, but also to improve the flux products listed here.
Data Assimilation
Overview ‐ While advances in methods and computing power have produced major improvements in ocean models there are still limits on model resolution which means that there are unresolved ocean processes. Observations and ocean dynamics are brought together in the large range of data assimilation techniques. Data assimilation (DA) is used to estimate initial or boundary values data, and to provide model hindcasts, nowcasts and forecasts. DA may be thought of as a means of interpolating sparse observations and smoothing noisy data or correcting model trajectories back to realistic targets. Many of the techniques have come from meteorological forecasting where significant advances have been made in the past decades. Ocean applications have been mainly in the assimilation of physical data although there is increasing development of methods to assimilate biogeochemical data.
Since the assimilation of data into a model adds a further potentially extensive computing overhead, when the system is applied to a large domain (such as a global model) compromises need to be made. For a high resolution model only a relatively simple DA scheme may be used – if a more sophisticated system is employed then the model resolution would need to be much coarser. DA may be used to provide model hindcasts, nowcasts and forecasts. Long model runs in hindcast mode provide ocean re‐analyses that are a valuable tool for climate studies such as SODA and GECCO. Nowcasts and forecasts are the focus of more operational prediction systems.
Data The central in situ dataset used in all DA systems is Argo. It provides global coverage, has both real‐time and delayed mode inputs and includes both T and S profiles. Further XBT, CTD and fixed buoy observations are also used. The temperature and salinity profile data are assimilated at all depths. In the operational system the data are obtained from BATHY, TESAC and BUOY messages distributed by the Global Telecommunications System (GTS). These message formats are used to report expendable bathythermograph (XBT) data reported by Voluntary Observing Ships (VOS), and data from the Argo profiling floats and TAO/Triton equatorial moorings respectively. Quality control checks on these data include track, stability, background and buddy checks
Assessment of open‐ocean ecosystems relies on understanding ecosystem dynamics, and development of end‐to‐end ecosystem models represents an approach that addresses these challenges. These models incorporate the population structure and dynamics of marine organisms at all trophic levels. Satellite remote sensing of ocean colour and direct at‐sea measurements provide information on the lower trophic levels of the models, and fisheries studies provide information on top predator species. However, these models suffer from a lack of observations for the so‐called mid‐trophic levels, which are poorly sampled by conventional methods. This restricts further development, and acoustic observations can be linked to the ecosystem models to provide much‐needed information on these trophic

levels. To achieve this, the models need to be tailored to incorporate the available acoustic data, and the link from acoustic backscatter to biologically relevant variables (biomass, carbon, etc.).
Validation
Another major application of observations is the validation of model outputs. We will only have confidence in a model estimate if it is verified by comparison with an equivalent observational value. We also note that such reference data should also be independent of the model estimate. For example, only data withheld from the assimilation are used to validate a DA forecast. In general, to make model validation more systematic comparisons are made between model and observation for a set of standard reference parameters or ‘metrics’. These consist of ocean properties that represent an important physical process, that capture the behaviour of a region, where observations are available and which can be easily extracted from a model. Examples include, the mean property on a surface, the meridional overturning circulation, an ENSO SST index, the ITF strength, the timeseries of flow at specific chokepoints or XBT transects. Observations from ocean climatologies (CARS, WOA), high‐density XBT sections, long‐term mooring arrays provide important data metrics. This validation exercise aims to test the ability of a model to capture the mean and time‐varying nature of ocean properties, the structure of currents, fronts and eddies, the changes through the water column.
5. Observing System Design and Assessment
While the previous aspects generally have involved the input of observations into models; to initialise, force, adjust or validate. However, models are increasingly being used as tool to inform the design, deployment and assessment of ocean observing systems. This is both a process of looking back, to evaluate the relative importance of existing or past observational components (Observing System Experiments, OSE), or looking forward (Observing System Simulation Experiments, OSSEs) to evaluate the potential impact of future observational programs. These methods generally are based on DA approaches and a suite of ensemble‐based and adjoint‐based tools have been developed. Model output may also be used to design the configuration of observing systems such as mooring arrays.
6. Figures
Figure 1: Location of active Argo floats by operator country. Source: Argo Information Centre.
Figure 2: XBT drops collected in a single year as part of the global Ship‐of‐Opportunity network coordinated by JCOMM‐OPS.

Figure 3: Locations and state of implementation of the Tropical Moored Buoy Array. From http://www.pmel.noaa.gov/tao/global/global.html
Figure 4: locations of the CLIVAR/Carbon Repeat Hydrographic lines by country. Australia via CSIRO, the ACE CRC and the Australian Climate Change Science Program (ACCSP) occupies 3 meridional lines in our region.