1. introduction 1 1.1 the greenhouse effect and global ...anly/co2/129_jerndalphd_thesis.pdf · 5.2...
TRANSCRIPT

1. INTRODUCTION 1
1.1 The Greenhouse Effect and Global Warming 1 1.1.1 Historical Background 2 1.1.2 Greenhouse Gases 2 1.1.3 Ways to Reduce Anthropogenic CO2 Emissions 6
1.2 Sequestration of CO2 6 1.2.1 CO2 Storage Options 7 1.2.2 CO2 Transportation 8 1.2.3 CO2 Capture Processes 8 1.2.4 Cost of CO2 Sequestration 10
2. CHEMICAL-LOOPING COMBUSTION 11
2.1 Process Studies 13 2.2 Chemical-Looping Combustion of Solid Fuels 14 2.3 Oxygen Carriers 14 2.3.1 Thermal Aspects 15 2.3.2 Fate of Sulphur Species 20 2.3.3 Selection of Oxygen Carriers for this Work 22
2.4 Carbon Formation 25 2.5 Objective 26
3. EXPERIMENTAL 29
3.1 Preparation of Oxygen Carriers 29 3.1.1 Freeze-Granulation 30 3.1.2 Spray-Drying 32 3.1.3 Unprocessed Materials 33
3.2 Characterization of Oxygen Carriers 34 3.3 Reactivity Investigation of Oxygen Carriers 35
4. RESULTS 45
4.1 Characterization of Oxygen Carriers 45 4.1.1 Effect of Sintering Temperature 46 4.1.2 Effect of Sintering Time 48
4.2 Reactivity of Oxygen Carriers 49 4.2.1 Ni-Based Particles without Additives 49 4.2.2 Ni-Based Particles with Additives 50 4.2.3 Rate Index 52 4.2.4 Reduction Kinetics with NOV1T1450sd 53 4.2.5 Natural and Synthetic Ilmenites 54 4.2.5 Low-Cost Fe-Based Materials 55
4.3 Effect of Up-Scaling in Particle Production 57 4.4 Defluidization 58 4.5 Carbon Formation 60 4.6 Conversion of Solid Fuels 61
5. DISCUSSION 63
5.1 Ni-Based Oxygen Carriers 63 5.2 Fe-Based Oxygen Carriers 65
6. CONCLUSIONS 69
7. ACKNOWLEDGEMENT 71
8. REFERENCES 73


1
1
INTRODUCTION
1.1 The Greenhouse Effect and Global Warming
The greenhouse effect is a naturally occurring process by which the Earth's surface and
its surrounding atmosphere are heated. It results from the fact that certain atmospheric
gases, i.e., greenhouse gases, are able to change the energy balance of the planet.
The Sun is radiating energy at very short wavelengths, predominately in the visible or
near-visible part of the energy spectrum. To balance this input of solar radiation, the
Earth emits energy back to space. As a result of the relatively low temperature on Earth,
the energy emitted is mainly in the long wave infrared part of the energy spectrum. Much
of this thermal radiation is absorbed by greenhouse gases in the atmosphere, and is
reradiated back to Earth, resulting in the warming of the surface, known as the
greenhouse effect.
Without this natural greenhouse effect, the global energy balance would result in an
average temperature on Earth of about -18ºC rather than the present average temperature
of 15ºC [1]. Figure 1-1 visualizes a simplified energy balance of the Earth’s surface.
Figure 1-1. The Earth’s annual and global mean energy balance [2].

2
1.1.1 Historical Background
The basic idea of the greenhouse effect was discovered as early as 1681 by the French
physicist Edme Marriotte who found that the Sun’s light and heat easily passed through
glass and other transparent materials while heat from other sources did not [3].
After this discovery it took until 1824 before the French mathematician Joseph Fourier
suggested that gases in the atmosphere might absorb heat in a similar way [4]. As Fourier
stated, energy in the form of visible light from the Sun easily penetrates the atmosphere
to reach the surface and heat it up, but heat cannot so easily escape back into space.
Although the equations and data available at that time were far too poor to allow accurate
calculations, scientists were able to show that an uncovered, airless rock at the Earth’s
distance from the Sun should be far colder than the Earth actually was [5].
The British philosopher James Tyndall set out to find whether there was in fact any gas
in the atmosphere that could trap the heat released from the Earth. In 1859, his careful
laboratory work identified several gases that did just that, the two most important being
water vapour and carbon dioxide [6].
In 1896, the Swedish chemist Svante Arrhenius first linked the concentration of CO2 in
the atmosphere to the climate of the Earth [7] and suggested that burning of fossil fuels,
and with that release of CO2, might lead to an increased global temperature. Arrhenius
main focus was to understand the cause of the ice ages and he therefore argued in favour
of increasing the atmospheric CO2 concentration, thus avoiding a forthcoming ice age.
The German physicist, Walther Nernst, even presented the idea of setting fire to entire
coal seams in order to release enough CO2 to deliberately cause global warming [5].
In later years, concerns about the increasing atmospheric CO2 concentration, the
subsequent global warming and possible effects such as sea level rise and changes in
precipitation patterns have increased steadily. The Intergovernmental Panel on Climate
Change concludes in their 4th
Assessment Report that changes in the atmosphere, the
oceans and glaciers and ice caps now show unequivocally that the world is warming due
to human activities [8].
1.1.2 Greenhouse Gases
Water vapour (H2O), is the single most important greenhouse gas, accounting for about
60% of the natural greenhouse effect for clear skies [9]. However, human activities play
an insignificant part in influencing the amount of atmospheric water vapour directly.
However, indirectly humans have the potential of affecting water vapour concentrations
substantially by changing the climate, as a warmer atmosphere would contain more water
3
vapour. Greenhouse gas concentrations that are directly affected by human activities are
the so called anthropogenic greenhouse gases. Human activities result in emissions of
four principal greenhouse gases: carbon dioxide (CO2), methane (CH4), nitrous oxide
(N2O) and the halocarbons which is a group of hydrocarbon gases containing fluorine,
chlorine or bromine. Significant increases in the atmospheric concentrations of all these
gases have occurred in the industrial era, at different rates. In 2004, CO2 represented 77%
of the global anthropogenic greenhouse gas emissions [10], when weighted by their
global warming potential, and is therefore often given focus of attention when
considering how to solve the problem of global warming.
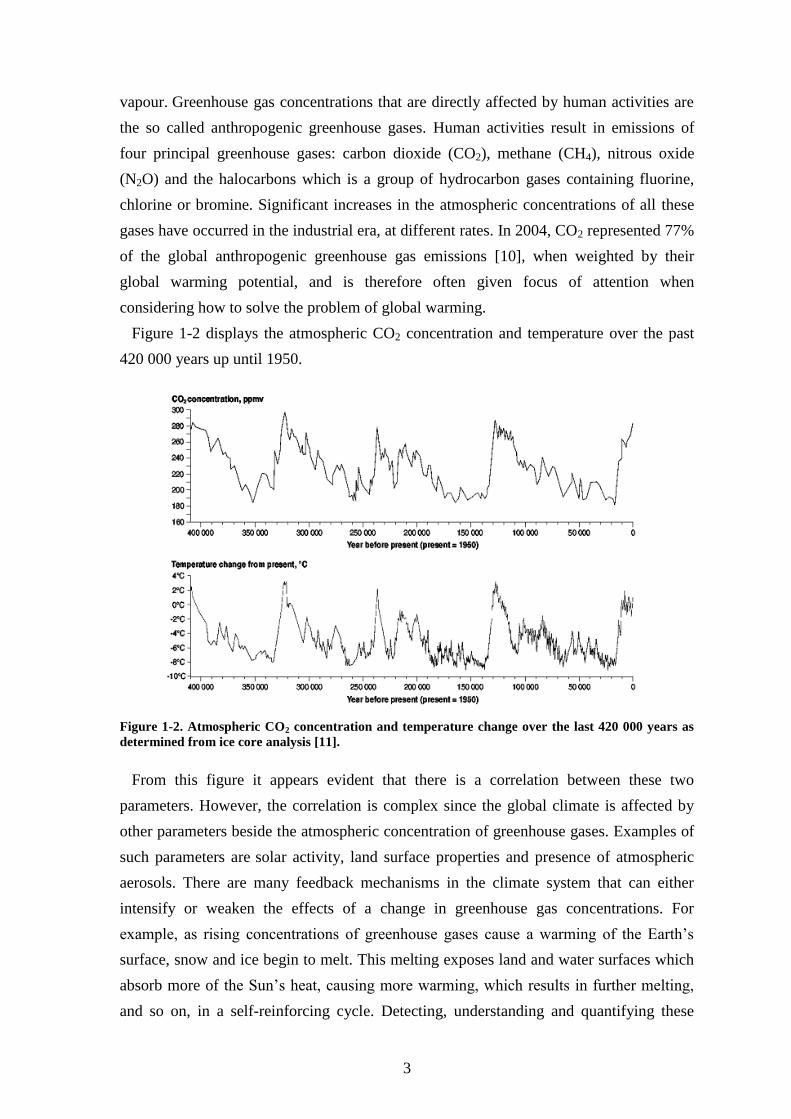
Figure 1-2 displays the atmospheric CO2 concentration and temperature over the past
420 000 years up until 1950.
Figure 1-2. Atmospheric CO2 concentration and temperature change over the last 420 000 years as
determined from ice core analysis [11].
From this figure it appears evident that there is a correlation between these two
parameters. However, the correlation is complex since the global climate is affected by
other parameters beside the atmospheric concentration of greenhouse gases. Examples of
such parameters are solar activity, land surface properties and presence of atmospheric
aerosols. There are many feedback mechanisms in the climate system that can either
intensify or weaken the effects of a change in greenhouse gas concentrations. For
example, as rising concentrations of greenhouse gases cause a warming of the Earth’s
surface, snow and ice begin to melt. This melting exposes land and water surfaces which
absorb more of the Sun’s heat, causing more warming, which results in further melting,
and so on, in a self-reinforcing cycle. Detecting, understanding and quantifying these

4
feedback systems have been the focus of a great deal of research by scientists exploring
the complexity of the Earth’s climate [2]. Figure 1-3 displays the changes in contributions
to radiative forcing for some of the factors affecting the global energy balance from the
start of the industrial era, about 1750, to 2005. As seen, the greenhouse gases, in
particular CO2, have caused the largest change in the global energy balance over this
period and the effect of aerosols emitted to the atmosphere comprises the largest
uncertainty [12]. Positive forcing leads to warming of the Earth while negative forcing
has a cooling effect.
Figure 1-3. Radiative forcing in 2005, relative to 1750. The black line attached to each bar represents
the range of uncertainty [12].
A problem with making predictions of the Earth’s climate is that scientists are unable to
perform controlled experiments on the planet as a whole and then observe the results.
However, empirical tests of numerous different hypotheses have built up substantial
knowledge in this field. This repeated testing has refined the understanding of the
numerous aspects affecting the climate and its inherent feedback systems. The general
scientific consensus today is that the ongoing increase in atmospheric CO2 concentration
caused by human activities has a definite and significant effect on the current heating of
the Earth.
The global atmospheric concentration of CO2 has increased from a preindustrial value
of about 280 ppm to 379 ppm in 2005 [12], as displayed in Figure 1-4. The current CO2
concentration exceeds by far the natural values over the last 420 000 years, which has
varied between 180 and 300 ppm, and is rapidly increasing.

5
Figure 1-4. Change in atmospheric CO2 concentration over the last 1000 years. Concentrations from
1958 and onwards are direct measurements from Mauna Loa Observatory, Hawaii. Older data are
measured in air bubbles trapped in ice core from Law Dome, Antarctica [13].
The drastic increase in CO2 concentration is predominantly due to the intensified use of
fossil fuels, which in 2004 was the source of 80% of the world’s total primary energy
supply [14]. Another contributor to the increased CO2 concentration is deforestation,
which releases CO2 and reduces its uptake by plants. During the past hundred years,
1906-2005, the global average temperature has increased by 0.74±0.18°C [12]. It has
been shown that this temperature increase cannot be explained by natural climate
variations alone [15]. The increased global mean temperature over the last 150 years is
displayed in Figure 1-5.
Figure 1-5. The observed change in global mean temperature over the last 150 years. Temperatures
are shown as deviation from the 1961 to 1990 average [16].
The anthropogenic climate change is having a significant impact on physical and
biological systems globally and temperature related changes in such systems have been
observed on all continents from 1970 to 2004 [15].

6
1.1.3 Ways to Reduce Anthropogenic CO2 Emissions
There is a wide range of possible ways to reduce emissions of CO2. The most obvious
are reducing the use of energy or implement a transition from carbon intensive fossil
fuels to nuclear power or renewable energy sources such as biomass-, hydro-, wind-, or
solar power. In addition to this, atmospheric CO2 can be removed by biomass uptake or
by underground carbon sequestration.
The world is presently heavily dependent on the utilization of fossil fuels and known
reserves of these, especially coal, are plentiful. Therefore, technological options that will
allow for the continued use of fossil fuels without substantial emissions of CO2 to the
atmosphere would be desirable. In this respect, one route forward would be the
development and deployment of technologies for capture and storage of the CO2
produced by combustion of fossil fuels. However, due to the quantities of CO2 involved,
it is likely that a portfolio of measures that include all of the above mentioned options
will prove to be necessary in solving the problem of global warming.
1.2 Sequestration of CO2
Carbon dioxide capture and storage is a process consisting of the separation of CO2
from an industrial or energy-producing source, transport to a storage location and long-
term isolation from the atmosphere. The idea is generally referred to as carbon capture
and storage or carbon sequestration and has received an increased interest in recent years
[17-20]. Implementation of this process would be feasible on any large stationary point
source emitting CO2. Such sources include large fossil- or biomass fuelled power plants,
cement- and steel industries, refineries and natural gas processing facilities and account
for about 60% of the global CO2 emissions [17]. The power production sector itself
accounts for about a third of the total CO2 emissions [21].
The potential contribution of this technology in stabilizing the atmospheric CO2
concentration will be influenced by factors such as the cost relative to other methods, the
possible release of CO2 stored, the transport infrastructure to storage sites, environmental
concerns and the public acceptance of this approach [17].
CO2 capture and storage from combustion of biomass can yield net removal of CO2
from the atmosphere, as the CO2 stored originates from biomass which has absorbed CO2
from the atmosphere as it grew [22, 23].

7
1.2.1 CO2 Storage Options
There are several options for storage of CO2, e.g., in geologic formations, in deep
oceans or by mineral carbonation. At present, geological storage is generally regarded as
the preferred alternative. In order to store CO2 geologically, it must first be compressed to
a dense fluid state. Geological storage sites for CO2 include depleted oil and gas
reservoirs, unmineable coal seams and deep saline formations, as presented in Figure 1-6.
Injection of CO2 into subsurface geological formations has been undertaken since the
early 1970s, primarily for the purpose of enhanced oil recovery. In 1996, the world’s first
large-scale storage project was initiated by Statoil and its partners at the Sleipner gas field
in the North Sea, where about 1 Mt CO2 has been injected annually in the Utsira aquifer
[18]. The injected CO2 is obtained during upgrading of natural gas and stored for
environmental reasons.
Figure 1-6. Options for storing CO2 in deep underground geological formations [17].
Apart from geological storage, CO2 can be injected into oceans at great depth, where
most of it would remain isolated from the atmosphere for centuries. This is due to the fact
that CO2 has a higher density than sea water at depths exceeding 3 000 m. Although there
have been small-scale field experiments and numerous theoretical-, laboratory-, and
modelling studies of ocean storage of CO2, it has not yet been deployed since local
effects on the sea floor environment are inevitable. Potential underground deposit sites
for CO2 are abundant as displayed in Table 1-1.

8
Table 1-1. The worldwide capacity of potential CO2 storage
reservoirs, orders of magnitude [24].
Sequestration option Worldwide capacity [Gt C] Ocean 1 000-10 000+ Deep saline formations 100-10 000 Depleted oil and gas reservoirs 100-1 000 Coal seams 10-1 000
1 Gt C = 1 billion tonnes of carbon equivalent = 3.7 Gt CO2.
These values should be compared to the global annual anthropogenic carbon emissions,
which are approximately 7 Gt C [24], hence the available storage capacity is huge and
should be able to store a large fraction of emitted carbon dioxide.
A third option suggested for storing of CO2 is mineral carbonation, an industrial
imitation of the natural weathering process. Here, gaseous CO2 is converted into a solid
carbonate by reactions with naturally occurring magnesium- or calcium-rich silicates,
which are extremely abundant. The products of mineral carbonation reactions are
naturally occurring stable solids that would provide storage capacity on a geological time
scale [25]. Although these reactions are thermodynamically favoured, they are extremely
slow in nature and the process would require huge amounts of minerals. The main
challenge associated with mineral carbonation is to speed up the reactions in order to
design an economically viable process.
1.2.2 CO2 Transportation
Transportation of CO2 from the point of capture to the storage location can be solved by
currently existing technologies. Carbon dioxide pipelines already extend over more than
2 500 km in the western USA, where they carry 50 Mt CO2 annually from natural sources
to enhanced oil recovery projects [17].
The infrastructure for natural gas and petroleum gases is well established on a very
large scale including transportation in pipelines and marine tankers. Carbon dioxide is
currently transported in the same way, but on a smaller scale. The properties of liquefied
carbon dioxide are not greatly different from those of liquefied petroleum gases and
therefore, the transportation should not involve any major difficulties.
It is generally cheaper to transport CO2 in pipelines than to transmit electricity.
Therefore, it would likely be advantageous to place power stations close to the electricity
demand and transport the CO2 to the storage site [21].
1.2.3 CO2 Capture Processes
The major part of the flue gas emitted by a power station consists of nitrogen, CO2
comprise only about 4-14% of the total flue gas volume [21]. The higher value is typical

9
for a pulverized coal fired power plant and the lower can be expected from a process
utilizing natural gas in a combined cycle. Before carbon dioxide can be transported to,
and stored at, a suitable location, it has to be obtained in a concentrated stream. Highly
concentrated CO2 is necessary since energy and space requirements for compression,
transportation, and storage otherwise would be unbearable.
Most processes for capturing CO2 from combustion in a power production unit can be
divided into three main categories. These are post-combustion, pre-combustion and
oxyfuel combustion, as displayed in Figure 1-7. Each of these technologies are associated
with an energy, and hence an economic, penalty for separation of gases. A fourth option,
where this energy penalty for gas separation is avoided, is chemical-looping combustion
which will be comprehensively described in section 2.
Figure 1-7. Possible CO2 capture technologies [17].
Post-combustion, or flue gas separation, is accomplished by treating the flue gases in a
process which separates most of the CO2 from the rest of the gases. A chemical sorbent
process would normally be used to accomplish this and the main one in use today is
scrubbing of the flue gases, using an amine solution [24]. After leaving the scrubber, the
amine is heated to release high purity CO2; whereafter the amine can be reused. In many
respects, post-combustion capture of CO2 is analogous to flue gas desulphurization,
which is widely used on coal- and oil fired power stations to reduce emissions of SO2
[21].
Pre-combustion is a process for manufacturing hydrogen from a fossil fuel. In a first
step, the fuel is gasified with oxygen or air and/or steam to give mainly a synthesis gas of
carbon monoxide and hydrogen. The carbon monoxide is then reacted with steam in a
catalytic reactor, to give CO2 and more hydrogen. Hereafter, CO2 is separated, usually by
a physical or chemical absorption process, resulting in a hydrogen-rich fuel which can be
used in many applications, such as boilers, furnaces, gas turbines, engines and fuel cells
[17]. Although pre-combustion capture involves a more radical change to the power

10
station design than post-combustion, most of the technology is already well proven in
ammonia production and other industrial processes [21].
The third option, oxyfuel combustion, is based on a combustion process using pure
oxygen instead of air to obtain a flue gas stream containing mostly CO2 and H2O, where
the water can easily be condensed. A part of the flue gas needs to be recycled into the
combustion chamber, in order to control the flame temperature [24]. The energy
demanding step in this process is to separate oxygen from nitrogen in the air, prior to
combustion. The most efficient technology for producing large quantities of oxygen is
cryogenic air separation [26].
For pre- and post-combustion systems the capture efficiency is expected to be 85-95%
whereas the capture efficiency in an oxyfuel based power production unit is expected to
be very close to 100% [17]. The capture efficiency is defined as the fraction of CO2
separated from the gas stream. Another advantage with oxyfuel combustion is that NOx
formation is suppressed.
1.2.4 Cost of CO2 Sequestration
The cost of capturing CO2 is the largest contributor to the overall cost of CO2 capture,
transportation and storage. The capture cost for a new pulverized coal fired power plant
or a natural gas combined cycle power plant, based on current technology, is expected to
be in the range of 30-90 US$/t CO2 avoided [17]. This cost should be compared to the
cost of transportation, which is typically 1–8 US$/t CO2/250 km, and the geological
storage cost which is believed to range from 0.6–8.3 US$/t CO2 [17]. It should be noted
that the transportation cost depends strongly on the quantity transported. The storage cost
also includes cost of monitoring the storage site and is estimated without potential
benefits from enhanced oil or gas production, which can actually yield a negative storage
cost. The main determinants of storage costs are reservoir and injection characteristics
such as permeability, thickness and reservoir depth [17].
The high capture cost is associated with the highly energy consuming gas separation
processes. It would be beneficial if CO2 could be obtained separated from nitrogen
without such a gas separation process. An option to achieve this is by using chemical-
looping combustion.

11
2
Chemical-Looping Combustion
Chemical-looping combustion is a novel combustion technology where fossil fuels can
be utilized while CO2 is separated from the rest of the flue gases, without an energy
consuming gas separation process. This is accomplished by performing the combustion in
two interconnected reactors, one with a continuous inlet of air and one with a continuous
feed of fuel gas. The technology requires an oxygen carrier, generally in the form of
metal oxide particles, with the purpose of transferring oxygen from the combustion air to
the fuel, as presented in Figure 2-1. Since the combustion is accomplished by a gas-solid
reaction between the fuel and the metal oxide, direct contact between fuel and air is
avoided and a high-purity CO2 stream is obtained from the fuel reactor after water vapour
condensation. The outlet stream from the air reactor will contain nothing but oxygen
depleted air. The oxygen carriers are circulated between the two reactors, constantly
providing new oxygen for the combustion process.
Air
Reactor
Fuel
Reactor
MexOy
MexOy-1
Air Fuel
N2, O2 CO2, H2O
Figure 2-1. Schematic representation of the chemical-looping combustion process.
In the air reactor, the reduced metal oxide, denoted MexOy-1, is oxidized by air
according to reaction (1) and in the fuel reactor it is reduced back to its initial state by a
fuel, according to reaction (2).
yxyx OMeOMeO 22 12 (1)
1222 22 yxyxmn Om)Men(OmHnCOOm)Men(HC (2)

12
Reaction (1) is strongly exothermic while reaction (2) could be either exothermic or
endothermic depending on the fuel used and the characteristics of the oxygen carrier.
However, the sum of the energy released in these two reactions is always the same as the
heat released in conventional combustion, where the air and the fuel are in direct contact;
hence no extra energy is needed in the CO2 separation process. In addition to this,
chemical-looping combustion minimizes formation of NOx as the fuel conversion occurs
in absence of air and the temperature in the air reactor is generally too low to generate
any thermal NOx [27].
The basic ideas of chemical-looping combustion can be found in a patent from 1954
where it is presented as a technique to produce pure CO2 from fossil fuels [28]. A similar
concept was proposed as a power production technique in 1983 by Richter and Knoche
[29], with the purpose of increasing the thermal efficiency. In 1994, Ishida and Jin
suggested that chemical-looping combustion could be used as a technology to separate
CO2 from the rest of the flue gases in a power plant in order to reduce climate impact [30]
and in 2001, Lyngfelt et al. proposed a reactor design of two interconnected fluidized
beds for the process as shown in Figure 2-2 [31].
air
flue gas
CO2 fuel
H2O
1
3
2
Figure 2-2. Propsed design of chemical-looping combustion. 1) Air reactor and riser, 2) Cyclone and
3) Fuel reactor [31].
The design of a reactor system with two fluidized beds gives the advantage of a good
contact between the oxygen carrier and the reacting gas. In this design, the air reactor is a
riser where the flow is high enough to entrain the oxygen carriers which are separated
from the oxygen-depleted air in a cyclone. Hereafter, the oxygen carriers fall down into
the fuel reactor. The fuel reactor could be designed as a bubbling fluidized bed from

13
where the oxygen carriers are allowed to fall down into the air reactor using for instance
an overflow exit. To prevent mixing of the gas streams from the air reactor and the fuel
reactor, two loop seals are installed between the reactors. This design has significant
similarities to a circulating fluidized bed boiler for solid fuels, thus using well proven
technology and components [31].
Fluidization occurs when a bed of solid particles is exposed to an upward moving gas
flow exceeding the minimum fluidization velocity, umf. The minimum fluidization
velocity is dependent on both the characteristics of the gas and of the particles and is
reached when the drag force from the upward moving gas equals the weight of the bed
particles. The terminal velocity, ut, is reached when the drag force from the ascending gas
on a single particle equals the weight of that particle. At gas velocities exceeding the
terminal velocity, particles are entrained and carried away from the fluidization vessel
[32]. Thus, in the air reactor, a gas velocity exceeding the terminal velocity should be
used and in the fuel reactor, assuming a bubbling bed reactor, a gas velocity between the
minimum fluidization velocity and the terminal velocity is required.
Although the fuel reactor is generally designed as a bubbling bed in small-scale
prototype units, the gas-solids contact is expected to be improved by designing the fuel
reactor as a circulating fluidized bed, thus using a gas velocity exceeding the terminal
velocity. Kolbitsch et al. have designed and successfully operated a 120 kWth reactor
system where both reactors are circulating fluidized beds [33].
2.1 Process Studies
Several simulations, investigating power processes and their thermal efficiencies, using
both natural gas and synthesis gas and different oxygen carriers, have been performed.
Reviews of these and relating literature can be found in doctoral theses of Anheden [34],
Wolf [35], Brandvoll [36] and Naqvi [37].
These theoretic studies indicate that the thermal efficiencies are generally high and the
overall efficiencies are higher compared to conventional systems with CO2 capture. To
reach these high efficiencies for gaseous fuels, combined cycle processes involving
pressurized fluidized beds should be developed. However, the temperatures used in such
combined cycles are higher than those at which oxygen carriers have normally been
tested and therefore, further oxygen carrier development is crucial.
14
2.2 Chemical-Looping Combustion of Solid Fuels
Most research and development of chemical-looping combustion up to date has focused
on gaseous fuels. However, as solid fuels like coal are considerably more abundant, less
expensive, account for a larger share of global power generation sector and releases more
CO2 per unit of energy produced than natural gas [38], it would be highly advantageous if
the chemical-looping combustion process could be adapted to convert solid fuels. This
adaptation could be accomplished in three different ways; by introducing the solid fuel
directly to the fuel reactor where it is gasified and reacted with the circulating oxygen
carrier [39, 40], by introducing synthesis gas, produced in a prior gasification step, to the
fuel reactor [41] or by chemical-looping with oxygen uncoupling, CLOU, which is a
novel technology using an oxygen carrier which releases gas-phase O2 in the fuel reactor
[42].
When the solid fuel is introduced directly to the fuel reactor, the solid-solid reaction
rate between the fuel and the oxygen carrier is inadequate and a gasifying agent, such as
H2O, is generally used [43, 44]. Apart from gasifying the fuel to an intermediate
synthesis gas, according to reaction (3), this agent also acts to fluidize the solid material
in the fuel reactor.
22 HCOOHC (3)
2.3 Oxygen Carriers
One of the keys to successfully implement chemical-looping combustion is the
development of suitable oxygen carriers [45]. Some of the most important criteria for the
oxygen carriers to be used in a circulating system of interconnected fluidized beds have
been identified as:
High conversion of the fuel to CO2 and H2O, i.e., no major thermodynamic constraints
High reactivity with fuel and oxygen
Low fragmentation and attrition
Low tendency for agglomeration
Low cost
Low environmental impact

15
Several transition state metal oxides, primarily based on Ni, Cu, Mn and Fe, have been
used as oxygen carriers in chemical-looping combustion since they fulfil the above
mentioned criteria to varying extents [46, 47].
To increase the performance of the active oxygen carrier material, it is generally
supported by an inert material [48]. This material acts as a porous support and contributes
to improve some important properties of the oxygen carrier. It increases the surface area
and hence the reactivity of the active material. It also helps maintaining the particle
structure during the reactions.
A comprehensive review of the different oxygen carrier systems tested can be found in
a doctoral thesis of Johansson [49]. Most of the research has been performed in
laboratory batch reactors, often by exposing the particles to repeated oxidizing and
reducing conditions and thereby simulating the chemical-looping combustion process.
However, several prototype units ranging from 0.3-120 kWth [50-56] have also been
operated and in one case, the same particles have been used for more than 1000 h [57].
These oxygen carrier particles were based on NiO, supported by NiAl2O4, and developed
in the present work. The total operational experience of chemical-looping combustion
exceeds 4000 h in 12 different units with totally 29 oxygen carrier materials [58].
In addition to the primarily used metal oxides, i.e., oxides based on Ni, Cu, Mn and Fe,
other materials have potential for serving as oxygen carriers. These include sulphates,
such as CaSO4 [59] and combined oxides, such as the mineral ilmenite, FeTiO3 [55, 60,
61]. Combining Mn oxides with a number of other oxides have also been shown to be
highly interesting as these materials have the ability to release gas-phase oxygen in the
fuel reactor [62-64].
2.3.1 Thermal Aspects
In Paper I, the feasibility to use 27 different oxygen carrier systems for chemical-
looping combustion were analyzed theoretically with respect to parameters important for
oxygen carriers in chemical-looping combustion. To simulate chemical reactions and
perform equilibrium calculations of these oxygen carrier systems, the HSC Chemistry 5.0
software was used and details of the method are described in Paper I. Most of the oxygen
carrier systems were based on metal oxides of Ni, Cu, Fe, Cd, Mn, Co, Zn, Ce, W and
Mo. Furthermore, two of the systems were based on the transition between metal sulphate
and metal sulphide, i.e., Ba and Sr. CaSO4/CaS was not included in Paper I but has been
added here since it has been suggested as a highly promising oxygen carrier system for
chemical-looping combustion [59].

16
To determine the degree of fuel conversion to carbon dioxide and water, gas yields for
three different fuels were defined as the fraction of the fuel which is oxidized to CO2 or
H2O, as presented in Paper I. Table 2-1 shows the gas yields, at thermodynamic
equilibrium, for all these oxygen carrier systems at 800°C and 1000°C at atmospheric
pressure. Of the 28 systems presented, only 8 have complete fuel conversion although
roughly half of them have conversions above 0.98.
The results presented for CH4 are highly relevant for common gaseous fuels such as
natural gas and refinery gas because of their high fraction of CH4. CO and H2 are relevant
when syngas is used in the process.
Table 2-1. The gas yield for different oxygen carrier systems.
Systems with yields below 0.92 are indicated with *.
4CH
CO
2H
800ºC 1000ºC 800ºC 1000ºC 800ºC 1000ºC
NiO/Ni 0.9949 0.9883 0.9949 0.9883 0.9946 0.9931
CuO/Cu 1.0000 1.0000 1.0000 1.0000 1.0000 1.0000
Cu2O/Cu 1.0000 0.9999 1.0000 0.9999 1.0000 0.9999
Fe2O3/Fe3O4 1.0000 1.0000 1.0000 1.0000 1.0000 1.0000 Fe3O4/Fe0.945O* 0.5406 0.6820 0.5408 0.6820 0.5264 0.7841
Fe0.945O/Fe* 0.3676 0.2898 0.3681 0.2898 0.3548 0.4086
CdO/Cd 0.9880 0.9827 0.9880 0.9827 0.9873 0.9897
Mn2O3/Mn3O4 1.0000 1.0000 1.0000 1.0000 1.0000 1.0000
Mn3O4/MnO 1.0000 0.9999 1.0000 0.9999 1.0000 0.9999 MnO/Mn* 0.0000 0.0000 0.0000 0.0000 0.0000 0.0000
Co3O4/CoO 1.0000 1.0000 1.0000 1.0000 1.0000 1.0000
CoO/Co 0.9691 0.9299 0.9691 0.9299 0.9674 0.9574
ZnO/Zn* 0.0022 0.0124 0.0035 0.0124 0.0033 0.0209
CeO2/CeO1.83* 0.4426 0.6917 0.4429 0.6917 0.4288 0.7916 CeO1.83/CeO1.72* 0.0167 0.0516 0.0190 0.0517 0.0179 0.0844 CeO1.72/Ce2O3* 0.0001 0.0040 0.0004 0.0040 0.0003 0.0068
Ce2O3/Ce* 0.0000 0.0000 0.0000 0.0000 0.0000 0.0000
WO3/WO2.96 0.9998 0.9984 0.9998 0.9984 0.9998 0.9991 WO2.96/WO2.722 0.9957 0.9858 0.9957 0.9858 0.9954 0.9916
WO2.722/WO2* 0.5647 0.4804 0.5649 0.4804 0.5506 0.6102
WO2/W* 0.2819 0.3095 0.2827 0.3095 0.2711 0.4316
MoO3/MoO2.889 1.0000 0.9646 1.0000 0.9646 1.0000 0.9788 MoO2.889/MoO2.75 1.0000 1.0000 1.0000 1.0000 1.0000 1.0000
MoO2.75/MoO2 1.0000 0.9999 1.0000 0.9999 1.0000 1.0000
MoO2/MoO* 0.2821 0.3060 0.2829 0.3060 0.2713 0.4275
BaSO4/BaS 0.9822 0.9648 0.9822 0.9648 0.9812 0.9789 SrSO4/SrS 0.9875 0.9738 0.9875 0.9738 0.9868 0.9844 CaSO4/CaS 0.9925 0.9835 0.9925 0.9835 0.9921 0.9902
Calculations in Paper I showed that when introducing Ni, Fe, Cd, Zn, Ce, W, Mo, BaS,
SrS or CaS, or any partially oxidized form of these into the air reactor, they will be
oxidized to NiO, Fe2O3, CdO, ZnO, CeO2, WO3, MoO3, BaSO4, SrSO4 and CaSO4
respectively at all temperatures and oxygen partial pressures realistic for the process.
However, Cu, Mn and Co can be oxidized to CuO or Cu2O, Mn2O3 or Mn3O4 and Co3O4
or CoO respectively, depending on partial pressure of oxygen and temperature, as shown
in Figure 2-3.

17
600 800 1000 1200T [ºC]
0.01
0.1
1
PO
2 [
-]
Oxidized Form
Reduced Form
Figure 2-3. The partial pressure of oxygen at which the metal oxides decompose to their more
reduced form as a function of temperature for Mn2O3/Mn3O4 ( ), Co3O4/CoO ( ) and CuO/Cu2O ( ).
The more oxidized form is favoured at low temperatures and high oxygen partial
pressures. The oxygen released and captured during transition between the two oxidation
states can actually be used in the CLOU-process, especially suitable for solid fuels [42].
Other aspects of the oxygen carriers that need consideration include melting
temperatures, oxygen ratios, heat balances of the reactors and possible side reactions in
the fuel reactor where different sulphur containing compounds may form.
In a fluidized bed, it is important to avoid melting and agglomeration of the fluidizing
particles. Agglomerations may form as the materials become soft at temperatures
approaching their melting points and therefore, it would be advantageous to operate the
process far below this temperature. Table 2-2 shows the melting temperatures of the
investigated metals and metal oxides. Since the chemical-looping combustion process
needs a temperature between 600°C and 1200°C, some of the suggested metals and
metal oxides are unsuitable.
Table 2-2. Melting temperatures of the metals and metal
oxides.
Melting Temperature (°C) Ni 1455 Mn 1246 CeO1.72 - MoO2.889 - NiO 1955 MnO 1842 CeO1.83 - MoO3 802 Cu 1085 Mn3O4 1562 CeO2 2400 BaS 2230 Cu2O 1235 Mn2O3 1347 W 3407 BaSO4 1580 CuO 1446 Co 1495 WO2 1724 SrS 2227 Fe 1538 CoO 1830 WO2.722 - SrSO4 1607 Fe0.945O - Co3O4 - WO2.96 - CaS 2525 Fe3O4 1597 Zn 420 WO3 1472 CaSO4 1460 Fe2O3 1565 ZnO 1975 Mo 2623
Cd 321 Ce 798 MoO2 1927 CdO - Ce2O3 2230 MoO2.75 -

18
Copper has the disadvantage of a comparably low melting temperature of 1085º.
Therefore, agglomeration and defluidization may occur when the particles are exposed
to high temperatures. Cho et al. noticed agglomeration of freeze-granulated Cu-based
oxygen carriers [65], but de Diego et al. have developed Cu-based oxygen carriers by
impregnation that did not present agglomeration problems in a batch fluidized-bed
reactor [66]. Furthermore, Adánez et al. tested a Cu-based oxygen carrier based on these
results in a 10 kWth chemical-looping combustor without defluidization or
agglomeration problems [67].
From the analysis of the fuel conversion, formation of oxides in the air reactor and
melting temperatures, several oxygen carrier systems are not suitable, as described in
Paper I. Thus, the oxide systems indicated with * in Table 2-1 can be excluded as a
result of their low ability to oxidize the fuel and Cd cannot be used because of its low
melting temperature. Also, Mo is excluded because MoO3, the oxide formed in the air
reactor, has too low melting temperature.
The oxygen ratio shows the maximum mass flow of oxygen that can be transferred
between the air and the fuel reactor for a given mass flow of circulating oxygen carrier
particles, and is defined as:
ox
redox
m
)m(mR0 (4)
where mox is the mass of oxygen carrier when fully oxidized and mred is the mass of the
fully reduced state. A high oxygen ratio is an advantage for the process since more
oxygen can be transported per mass unit of added material. Table 2-3 displays the oxygen
ratio of the investigated oxygen carrier systems. It should be noted that these oxygen
ratios will decrease when an inert material is used together with the active oxygen carrier.
Table 2-3. Oxygen ratio, R0, for the different oxygen carrier systems.
Oxygen ratio, R0 (-) NiO/Ni 0.214 Fe2O3/Fe3O4 0.033 Co3O4/Co 0.266 BaSO4/BaS 0.274 CuO/Cu 0.201 Mn2O3/MnO 0.101 CoO/Co 0.214 SrSO4/SrS 0.348 Cu2O/Cu 0.112 Mn3O4/MnO 0.070 WO3/WO2.722 0.019 CaSO4/CaS 0.470
For oxygen carrier systems with a high reactivity, in combination with a high oxygen
ratio, e.g., NiO/Ni, a comparatively small amount of material, and thus smaller reactor
sizes, are needed.
The reaction enthalpies for the reaction between the various metals or reduced metal
oxides and oxygen at 1000°C can be found in Table 2-4. The ratio of the reaction
enthalpy of the oxidation to that of conventional combustion for the three fuels is also

19
shown. Because the overall heat released from chemical-looping combustion is the same
as that from normal combustion, it is possible to determine whether the reactions in the
fuel reactor are endothermic or exothermic from this ratio. A ratio above 1 means that the
reaction in the fuel reactor is endothermic and a ratio below 1 indicates an exothermic
fuel reactor reaction. As seen in Table 2-4, the reaction in the fuel reactor is always
exothermic when H2 or CO is used. An exothermic fuel reactor reaction is advantageous
as a high particle circulation is not needed to maintain the fuel reactor temperature.
Table 2-4. Reaction enthalpies at 1000ºC.
ΔH (kJ/mol O2) ΔH/ΔHdir comb CH4 ΔH/ΔHdir comb H2 ΔH/ΔHdir comb CO
O2 + 1/2CH4 → 1/2CO2 + H2O -401.7 1.00 O2 + 2H2 → 2H2O -498.5 1.00 O2 + 2CO → 2CO2 -562.8 1.00 O2 + 2Ni → 2NiO -468.5 1.17 0.94 0.83 O2 + 2Cu → 2CuO -295.9 0.74 0.59 0.53 O2 + 4Cu → 2Cu2O -331.7 0.83 0.67 0.59 O2 + 4Fe3O4 → 6Fe2O3 -478.8 1.19 0.96 0.85 O2 + 4MnO → 2Mn2O3 -359.1 0.89 0.72 0.64 O2 + 6MnO → 2Mn3O4 -449.4 1.12 0.90 0.80 O2 + 3/2Co → 1/2Co3O4 -446.8 1.11 0.90 0.79 O2 + 2Co → 2CoO -466.9 1.16 0.94 0.83 O2 + 2/0.278WO2.722 → 2/0.278WO3 -419.6 1.04 0.84 0.75 O2 + 1/2BaS → 1/2BaSO4 -481.7 1.20 0.97 0.86 O2 + 1/2SrS → 1/2SrSO4 -475.7 1.18 0.95 0.85 O2 + 1/2CaS → 1/2CaSO4 -471.0 1.17 0.94 0.84
When methane is used as fuel, the reactions in the fuel reactor are endothermic for most
oxygen carriers and the fuel reactor temperature will be decreased. The temperature drop
in the fuel reactor was calculated in Paper I as a function of the mass-based conversion of
the oxygen carrier, ω, defined as the ratio of the actual mass and the mass in its fully
oxidized state:
oxm
mω (5)
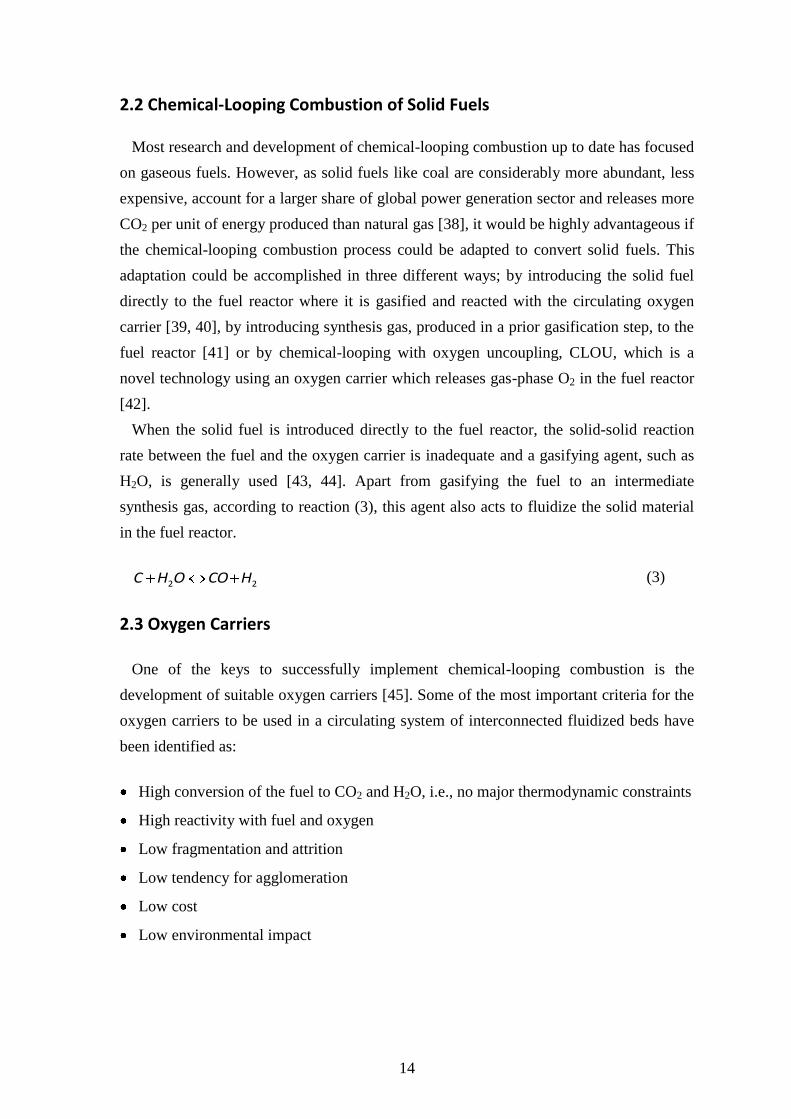
The temperature difference between the reactors depends on the oxygen carrier
circulation. A high mass flow gives a small difference in the mass conversion between
the two reactors and results in a small temperature difference between the reactors, as
displayed in Figure 2-4. Further details of the calculations are presented in Paper I. As
seen, the temperature decrease for highly reduced metal oxide/sulphates is in many cases
large. The implication of this is that the change in solid conversion, Δω, between the fuel
and air reactor should be kept low by maintaining a sufficient circulation of solids.
20
[a] [b]
Figure 2-4. Temperature in the fuel reactor for [a] NiO/Ni ( ), CoO/Co ( ), Co3O4/Co ( ), SrSO4/SrS
( ), BaSO4/BaS ( ), CaSO4/CaS ( ) and [b] Fe2O3/Fe3O4 ( ), WO3/WO2.722 ( ), Mn3O4/MnO ( ) as a
function of oxygen carrier conversion.
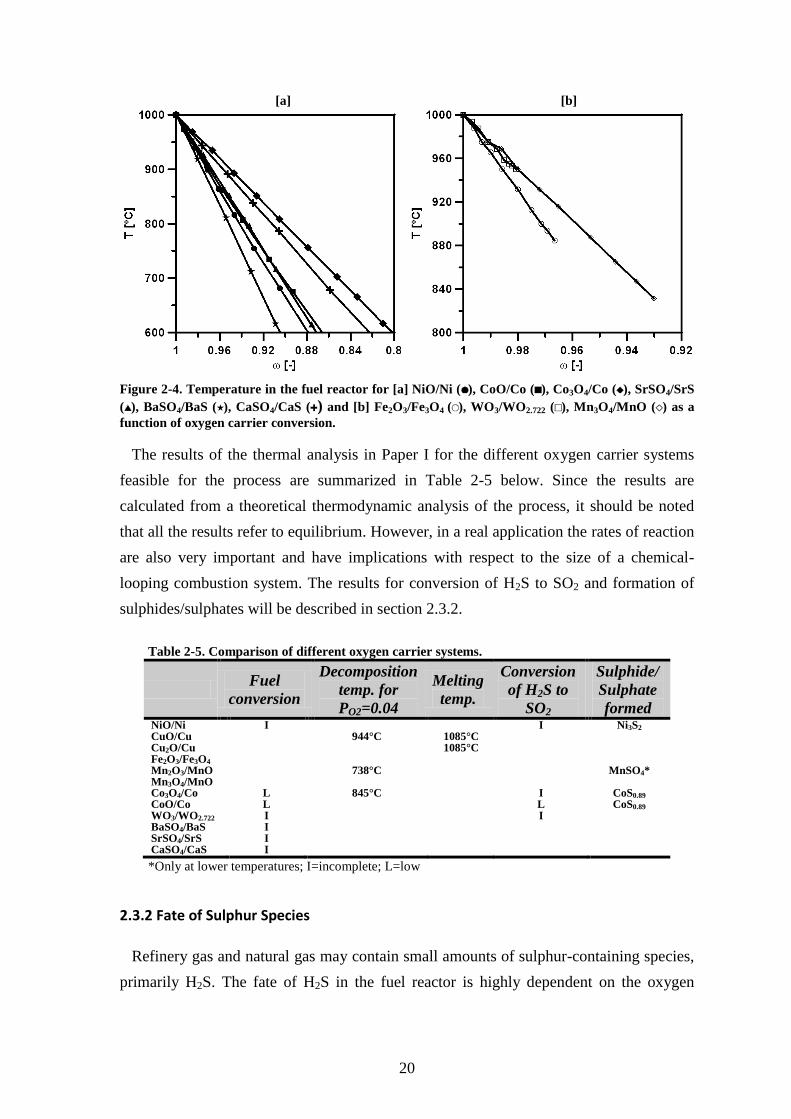
The results of the thermal analysis in Paper I for the different oxygen carrier systems
feasible for the process are summarized in Table 2-5 below. Since the results are
calculated from a theoretical thermodynamic analysis of the process, it should be noted
that all the results refer to equilibrium. However, in a real application the rates of reaction
are also very important and have implications with respect to the size of a chemical-
looping combustion system. The results for conversion of H2S to SO2 and formation of
sulphides/sulphates will be described in section 2.3.2.
Table 2-5. Comparison of different oxygen carrier systems.
Fuel
conversion
Decomposition
temp. for
PO2=0.04
Melting
temp.
Conversion
of H2S to
SO2
Sulphide/
Sulphate
formed NiO/Ni I I Ni3S2 CuO/Cu 944°C 1085°C Cu2O/Cu 1085°C Fe2O3/Fe3O4 Mn2O3/MnO 738°C MnSO4* Mn3O4/MnO Co3O4/Co L 845°C I CoS0.89 CoO/Co L L CoS0.89 WO3/WO2.722 I I BaSO4/BaS I SrSO4/SrS I CaSO4/CaS I
*Only at lower temperatures; I=incomplete; L=low
2.3.2 Fate of Sulphur Species
Refinery gas and natural gas may contain small amounts of sulphur-containing species,
primarily H2S. The fate of H2S in the fuel reactor is highly dependent on the oxygen

21
carrier used; it may be oxidized to SO2 by oxidants such as H2O, CO2 or the metal oxide.
Further, solid sulphur compounds may form by reactions with the oxygen carrier.
For CuO/Cu, Cu2O/Cu, Fe2O3/Fe3O4, Mn2O3/MnO and Mn3O4/MnO, H2S in the fuel
will be converted to SO2 to somewhere between 99.3 and 100%, for every temperature
between 600°C and 1200°C, as calculated in Paper I. For the NiO/Ni, WO3/WO2.722 and
the two systems including cobalt oxides, i.e., Co3O4/Co and CoO/Co, the conversion of
H2S is somewhat lower, as displayed in Figure 2-5. As seen, the oxidation of H2S is
enhanced at high temperatures and low pressures.
[a] [b] [c]
600 800 1000 1200T [°C]
0
0.2
0.4
0.6
0.8
1
Fr.
SO
2 in
ga
s p
ha
se
[-]
600 800 1000 1200T [°C]
0
0.2
0.4
0.6
0.8
1
Fr.
SO
2 i
n g
as p
ha
se
[-]
600 800 1000 1200T [°C]
0
0.2
0.4
0.6
0.8
1
Fr.
SO
2 in
ga
s p
ha
se
[-]
Co3O4/Co
CoO/Co
Figure 2-5. Degree of conversion from H2S in the fuel to SO2 at 1 bar ( ), 15 bar ( ) and 30 bar ( ) for
[a] NiO/Ni, [b] WO3/WO2.722 and [c] CoO/Co and Co3O4/Co.
Formation of metal sulphides or sulphates could result in oxygen carrier deactivation.
Thus, calculations were performed in Paper I to find out at what partial pressure of
sulphur-containing gases formation could occur. In summary, the risk of sulphide
formation is significant if Ni or Co is used and for the Mn2O3/MnO system, formation of
MnSO4 may occur at low temperatures, as shown in Figure 2-6. The sulphur
concentration needed for formation of these compounds increases with temperature and
decreases with total pressure.
[a] [b] [c]
600 800 1000 1200T [ºC]
1
10
100
1000
10000
100000
S in
gas p
has
e [
pp
m]
600 800 1000 1200T [ºC]
1
10
100
1000
10000
100000
S i
n g
as p
hase [
pp
m]
600 800 1000 1200T [ºC]
1
10
100
1000
10000
100000
S i
n g
as p
hase [
pp
m]
Co3O4/Co
CoO/CO
Figure 2-6. Concentration of sulphur containing gases needed at 1 bar ( ) and 15 bar ( ) for
formation of [a] Ni3S2 with Ni/NiO, [b] MnSO4 with Mn2O3/MnO and [d] CoS0.89 with Co3O4/Co and
CoO/Co.

22
For systems containing BaSO4/BaS, SrSO4/SrS and CaSO4/CaS, SO2 may form by
decomposition of the sulphate, predominantly at high temperatures and low total
pressures, as shown in Figure 2-7. Decomposition results in formation of sulphur-
containing gases and the metal oxides BaO, SrO and CaO, respectively. Thus, to avoid
loss of oxygen carrier by decomposition, the sulphur content of the added fuel must not
be too low and the temperature should not be too high.
[a] [b] [c]
600 800 1000 1200
T [°C]
10
100
1000
S in
ga
s p
has
e [
pp
m]
600 800 1000 1200
T [°C]
100
1000
10000
S in
ga
s p
has
e [
pp
m]
600 800 1000 1200
T [°C]
1000
10000
100000
S in
ga
s p
ha
se
[p
pm
]
Figure 2-7. Decomposition temperature at different concentrations of sulphur containing gases at 1
bar ( ), 15 bar ( ) and 30 bar ( ) for [a] BaSO4, [b] SrSO4 and [c] CaSO4.
2.3.3 Selection of Oxygen Carriers for this Work
The most frequently investigated oxygen carrier systems for chemical-looping
combustion are; NiO/Ni, CuO/Cu, Mn3O4/MnO and Fe2O3/Fe3O4. Most of these oxygen
carrier materials have been prepared by combining the active material to an inert support
material such as SiO2, TiO2, ZrO2, Al2O3, YSZ or bentonite [45, 49, 68]. The oxygen
carriers can be prepared under different conditions by numerous production methods such
as; freeze-granulation [69], impregnation [70] mechanical mixing [71], co-precipitation
[72], spray-drying [73] or spin-flash drying [74]. The choice of oxygen carrier materials
is highly dependent on the intended application and the large number of materials and
preparation methods gives rise to an infinite number of possible oxygen carriers with
varying properties.
Considerable work has been performed on investigating the reactivity of different
oxygen carriers. However, it is difficult to compare the reactivity directly as it varies
significantly with parameters such as fuel; preparation method, inert material and size of
oxygen carrier particles; type and size of the reactor and experimental conditions such as
gas velocities and reaction temperature. Still, from reactivity investigations comparing
different oxygen carriers with CH4 as fuel, it can be concluded that NiO and CuO are
generally far more reactive than Mn3O4 and Fe2O3 [47, 65, 69, 75, 76]. The price of these
metals follows the opposite order as the reactivity, with Fe being the cheapest and Ni the

23
most expensive [45]. Further, Ni has the disadvantages of a higher toxicity compared to
the other proposed oxygen carrier materials and a restricted fuel conversion due to
limitations from thermodynamic equilibria. However, as a high reaction temperature is
needed when chemical-looping combustion is integrated in a natural gas combined cycle,
the low melting temperature of Cu may cause problems and Ni is believed to be the
primary option in such applications [35]. With NiO as oxygen carrier, the overall reaction
in the fuel reactor is:
OHCONiCHNiO 224 244 (6)
and in the air reactor:
NiOONi 424 2 (7)
For Ni-based oxygen carriers, Al2O3 and NiAl2O4 have received the most attention as
support materials because of their favourable fluidization properties and thermal stability
[68]. The first results with NiO supported by NiAl2O4 were presented by Ishida et al. in
1998 [77] and in the following year, Jin et al. stated that this material combination may
play a vital role in developing chemical-looping combustion [78]. NiO/NiAl2O4 has
displayed a high reactivity with CH4, CO, H2 and O2 [68, 73, 78-80], its chemical
composition, structure and reactivity seems fairly unchanged after continuous operation
in a 10 kWth chemical-looping combustor [81], as well as at reduction and oxidation
temperatures up to 1200ºC [73, 82]. Further, this material combination has been tested in
fluidized beds without agglomeration problems [51, 74, 83]. Linderholm et al. obtained a
fuel conversion of above 99% with carriers based on these materials, in a 10 kWth unit
[74], and the reactions of NiO/NiAl2O4, with alternating methane and oxygen, have been
studied in detail by Mattisson et al. [84]. Here, it was found that although NiAl2O4 can
release oxygen to the fuel, this reaction is extremely slow compared to the reaction of
NiO with CH4. Hence, NiAl2O4 is considered as an inert material. Further, there is a
thermodynamic limitation of the NiAl2O4 in converting CH4 to CO2 and H2O. Another
support material, for Ni-based oxygen carriers, which has gained an increased interest is
MgAl2O4 [72]. Selection of MgAl2O4 instead of NiAl2O4 has been found to give an
improved methane conversion, higher selectivity to reforming and a lower tendency for
carbon formation [85]. NiO supported by MgAl2O4 has also been successfully tested in
continuous operation [86, 87].
When adapting chemical-looping combustion to convert solid fuels, the requirements of
the oxygen carriers are somewhat different as compared to the case of using gaseous

24
fuels. If direct introduction of the solid fuel to the fuel reactor is used, the lifetime of the
oxygen carriers is expected to be shorter as compared to when gaseous fuels are being
used. The reason for this is possible ash deactivation of the oxygen carriers and loss of
oxygen carrier particles during ash separation. For this reason, the use of low-cost and
environmentally friendly oxygen carriers is important. Further, as the gasification
products from solid fuels are mainly CO and H2, as displayed in reaction (3), expensive
oxygen carriers with high reaction rates with CH4 may not be useful to employ in a solid
fuel application. Fe-based oxygen carriers have the advantage of being comparatively
cheap, environmentally sound and accessible in large quantities [88, 89]. Generally, these
materials display higher reactivity towards CO and H2 than towards CH4 [90, 91].
Therefore, Fe-based oxygen carriers could be suitable for solid fuel applications. Most
studies regarding Fe-based oxygen carriers have focused on particles manufactured from
pure chemicals and stabilized by supporting materials [90, 92]. However, to further
decrease the oxygen carrier cost when utilizing solid fuels, an option is to use natural
minerals, such as iron ores [93], or by-products from other processes, such as oxide
scales from the steel industry [91]. Leion et al. have concluded that such materials are
good candidates for converting solid fuels in chemical-looping combustion [94] and Xiao
et al. have reported promising results using an iron ore to convert solid fuels in a fixed
bed reactor under pressurized conditions [89]. The overall reaction in the fuel reactor, for
Fe-based oxygen carriers, with syngas as fuel is:
OHCOOFeHCOOFe 2243232 /2/3 (8)
and in the air reactor:
32243 32
12 OFeOOFe (9)
Moldenhauer has investigated the natural mineral ilmenite and an iron based oxide scale
in a 300 Wth circulating chemical-looping combustion unit, fuelled by syngas, to improve
the understanding of the lifetime behaviour and other basic characteristics of these
oxygen carrier materials [95].
Ilmenite has been suggested as a capable oxygen carrier material for combustion of
solid fuels and investigated extensively. The reduced form of ilmenite is FeTiO3 and the
completely oxidized state is pseudobrookite, Fe2TiO5 and rutile, TiO2 [60, 61]. Ilmenite
has been used in a 10 kWth chemical-looping combustor [55] with solid fuels, its
properties have been studied experimentally in a laboratory setup, where reactivity

25
towards CH4 and CO/H2 as well as fluidization behaviour were investigated [60].
Furthermore, ilmenite has been tested in a 120 kWth chemical-looping combustor fuelled
by H2 [54] and structural changes of the material after successive reduction and oxidation
periods have been analyzed [61]. The overall reaction in the fuel reactor with ilmenite as
oxygen carrier is:
OHCOFeTiOHCOTiOTiOFe 2232252 /2/ (10)
and in the air reactor:
252232
12 TiOTiOFeOFeTiO (11)
2.4 Carbon Formation
Under certain conditions solid carbon deposition on the oxygen carrier particles may
occur if a carbon-containing fuel is used. Carbon formed can be transported back to the
air reactor, causing CO2 formation, and hence lower the separation efficiency of CO2
[96]. Solid carbon may form through methane decomposition:
24 2HCCH (12)
or through the Boudouard reaction:
22 COCCO (13)
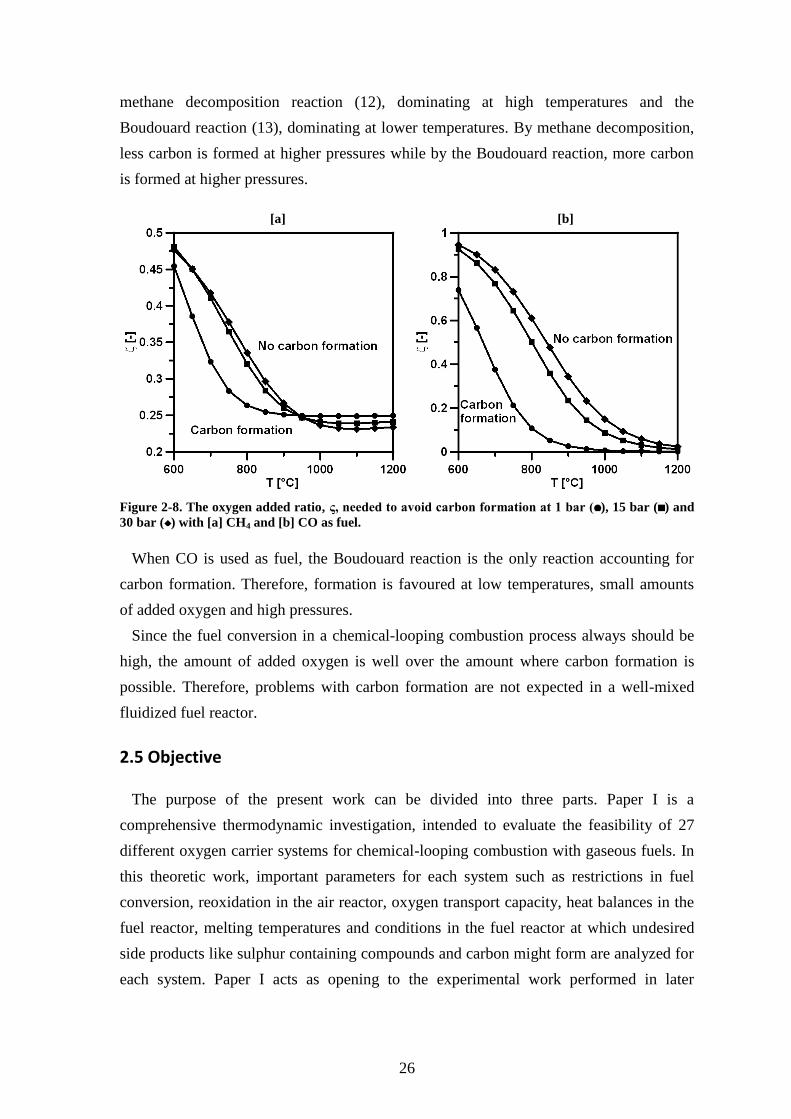
The oxygen added ratio, ς, is defined as the actual amount of O added to the gas, over
the stoichiometric amount needed for full conversion of the fuel gas:
O,stoich
O,added
n
nς (14)
Normally, low temperatures and small amounts of added oxygen benefit the formation,
as calculated in Paper I and shown in Figure 2-8. Here, the oxygen added ratio, equation
(14), below which carbon formation is thermodynamically feasible, is shown as a
function of temperature. With CH4 as fuel, an increased pressure will favour carbon
formation at low temperatures while an increased pressure counteracts carbon formation
at high temperatures. This is due to the fact that carbon is formed by two reactions, the
26
methane decomposition reaction (12), dominating at high temperatures and the
Boudouard reaction (13), dominating at lower temperatures. By methane decomposition,
less carbon is formed at higher pressures while by the Boudouard reaction, more carbon
is formed at higher pressures.
[a] [b]
Figure 2-8. The oxygen added ratio, ς, needed to avoid carbon formation at 1 bar ( ), 15 bar ( ) and
30 bar ( ) with [a] CH4 and [b] CO as fuel.
When CO is used as fuel, the Boudouard reaction is the only reaction accounting for
carbon formation. Therefore, formation is favoured at low temperatures, small amounts
of added oxygen and high pressures.
Since the fuel conversion in a chemical-looping combustion process always should be
high, the amount of added oxygen is well over the amount where carbon formation is
possible. Therefore, problems with carbon formation are not expected in a well-mixed
fluidized fuel reactor.
2.5 Objective
The purpose of the present work can be divided into three parts. Paper I is a
comprehensive thermodynamic investigation, intended to evaluate the feasibility of 27
different oxygen carrier systems for chemical-looping combustion with gaseous fuels. In
this theoretic work, important parameters for each system such as restrictions in fuel
conversion, reoxidation in the air reactor, oxygen transport capacity, heat balances in the
fuel reactor, melting temperatures and conditions in the fuel reactor at which undesired
side products like sulphur containing compounds and carbon might form are analyzed for
each system. Paper I acts as opening to the experimental work performed in later

27
publications and therefore, the results of Paper I are summarized in section 2.3.1, 2.3.2
and 2.4 of this thesis.
Paper II-V presents experimental results for oxygen carriers of NiO, mostly supported
by NiAl2O4. The main reason for using Ni-based oxygen carriers to convert gaseous fuels
is the high reaction rate with methane, the main component in natural- and refinery gas,
in combination with a high melting temperature, which reduces the risk of agglomeration
when exposed to high temperatures. Previously, the oxygen carrier materials developed
for chemical-looping combustion have mainly been prepared using very fine and pure
materials. In order for this system to be viable for use in a power plant, it is important that
the raw materials are both commercial and can be obtained in large quantities at a
reasonable cost. Thus, the aim of Paper II is to verify that commercially available raw or
semi-finished materials can be used to produce high performing oxygen carriers of
NiO/NiAl2O4. Paper III investigates if these oxygen carriers could be prepared with a
method well suited for large-scale particle production, i.e., spray-drying. In Paper IV, it is
investigated if MgAl2O4 or MgO and/or Ca(OH)2 can be used as additives to increase the
performance of the spray-dried oxygen carriers, prepared by commercially available raw
materials. In Paper V, one of the more promising Ni-based oxygen carriers found in the
prior screening investigation is examined more closely, and a comparison of the
reactivity data from the small fluidized bed reactor with actual reactivity data from a 10
and 120 kWth circulating chemical-looping combustion reactor is made. All oxygen
carriers produced in Paper II-V are analyzed with respect to parameters important for a
process utilizing gaseous fuels with a high CH4 content, regarding both chemical and
physical properties as well as reactivity and gas conversion.
In Paper VI-VII, iron-based oxygen carriers are investigated experimentally. In Paper
VI, the main purpose is to improve the understanding of ilmenite, the most frequently
investigated oxygen carrier in solid fuel applications. To achieve this, both synthetically
produced ilmenites with varying Fe:Ti ratios and ilmenite minerals are investigated with
syngas as fuel, the main gasification product when solid fuels are utilized. In Paper VII,
several industrial iron-based materials and an iron ore are studied with respect to
parameters important for oxygen carriers in chemical-looping combustion with solid
fuels. Here, natural Norwegian ilmenite is used as a reference material. Further, one
oxygen carrier in Paper VII is tested with three different solid fuels and compared to this
reference sample.

28

29
3
EXPERIMENTAL
3.1 Preparation of Oxygen Carriers
There is considerable experience in producing high performing oxygen carrier particles
for chemical-looping combustion by freeze-granulation at laboratory scale. However, in
an industrial application of chemical-looping combustion, a production method better
suited for large scale particle preparation is necessary. Spray-drying is a well established
industrial method for production of dry solid particles in large quantities. The technology
has been applied in many areas, including the food-, pharmaceutical-, ceramic-, polymer-,
and chemical industries [97]. The spray-dried oxygen carriers are investigated in Paper
III-V.
The oxygen carriers investigated in Paper II-V are based on 6 different NiO materials,
obtained from 4 different commercial suppliers. Physical properties of the commercially
available raw materials, including the MgAl2O4 investigated in Paper IV and the MgO
and Ca(OH)2 investigated in Paper II and IV, are displayed in Table 3-1.
Table 3-1. Commercial raw materials used in oxygen carrier production.
Density (kg/m3)* BET-Surface (m
2/g)**
Raw Material, NiO Novamet Refractory grade 6600 3.5 Novamet Green grade F 6810 3.6 OMG Standard grade 6210 46.5 OMG HSA grade 5790 130 Umicore 6800 58.5 Vogler Brown grade 6100 1.3 Raw Material, α-Al2O3 Almatis CT3000SG 3960 7.0 Almatis CT800FG 3960 1.0 Raw Material, MgAl2O4 Almatis CTC55 2500 3.5-4.7 Almatis E-SY2000 3400 2.1-2.8 Almatis AR78 3300 <0.5 Additive, MgO MagChem30 3590 24.2 Additive, Ca(OH)2 Nordkalk SL 2330 16.0
*Measured by a Helium pycnometer, Micromeretics, AccuPyc 1330 or GeoPyc 1360
**Measured by Nitrogen adsorption, Micromeritics, Flowsorb II 2300 or Gemini 2360

30
3.1.1 Freeze-Granulation
A fine powder of the raw materials was combined with polyacrylic acid as dispersant.
Water-based slurries of the mixtures were prepared by ball milling for about 24 h. After
milling, polyethylene glycol was added as a binder to keep the particles intact during
freeze-drying and sintering. Spherical particles were produced by pumping the slurry to a
spray nozzle where passing atomizing-air produced drops, which were sprayed into liquid
nitrogen where they froze instantaneously. The frozen water in the resulting particles was
then removed by sublimation in a freeze-drier. After drying, the Ni-based particles were
sintered at three different temperatures, 1400, 1500 and 1600°C for 6 h. During heat
treatment, the α-Al2O3 reacted completely with part of the NiO to form the supporting
spinel NiAl2O4. An excess of NiO was used in the preparation to achieve a mass ratio
between NiO and NiAl2O4 of 4/6.
In an initial screening, 30 oxygen carriers were prepared by combining the different
NiO and α-Al2O3 materials from various suppliers, shown in Table 3-1. These particles
are presented in Table 3-2, where the sintering temperature is given in the abbreviation
for each oxygen carrier.
Table 3-2. Physical properties of particles produced by freeze-granulation, investigated in Paper II.
Oxygen carriers in italic typeface defluidized during reactivity testing.
NiO
α-Al2O3 Almatis CT3000SG Almatis CT800FG
Oxygen Carrier Abbr.
BET-Surface (m
2/g)*
Crushing Strength
(N)**
Apparent Density
(kg/m3)***
Oxygen Carrier Abbr.
BET-Surface (m
2/g)*
Crushing Strength
(N)**
Apparent Density
(kg/m3)***
Novamet Refractory grade
NOV1T1400 0.91 1.4 2400 NOV1T1500 0.52 4.1 3400
Was not Prepared NOV1T1600 0.04 11.7 4460
Novamet Green grade F
NOV2T1400 1.85 1.6 2490 NOV2T1500 0.97 3.8 3180 NOV2T1600 0.18 9.2 4380
OMG Standard grade
OMG1T1400 - S 1770 OMG2T1400 OMG1T1500 1.43 0.4 2060 OMG2T1500 No Spherical Particles OMG1T1600 0.55 1.3 2810 OMG2T1600
OMG HSA grade
OMG3T1400 - S 1440 OMG4T1400 OMG3T1500 1.28 0.5 1790 OMG4T1500 No Spherical Particles OMG3T1600 0.48 1.6 2920 OMG4T1600
Umicore UMI1T1400 2.38 0.2 1470 UMI2T1400 1.14 0.2 2070 UMI1T1500 1.53 0.4 1940 UMI2T1500 0.61 0.4 2290 UMI1T1600 0.47 1.2 3140 UMI2T1600 0.41 0.7 2410
Vogler Brown grade
VOG1T1400 - S 1290 VOG2T1400 No Spherical Particles VOG1T1500 - S 1690 VOG2T1500 - S 1350 VOG1T1600 0.48 0.6 2410 VOG2T1600 - S 1550
*Measured by Micromeritics, Flowsorb II 2300; **Average force needed to fracture individual particle;
***Assuming a void factor of 0.37; S - Too soft to measure crushing strength
Of the oxygen carriers prepared, seven failed in the production phase, i.e., no spherical
particles were obtained, and six formed too soft granules to give a distinct crushing
strength value. These problems occurred mainly with the cheaper and coarser α-Al2O3
material, i.e., Almatis CT800FG. The reason for this is likely the larger size of the

31
particles in the raw material of this α-Al2O3, which limits the contact area for reaction
with the nickel oxides. For this reason, some material combinations were not prepared
using Almatis CT800FG.
To study the effect of additions of MgO and Ca(OH)2 to oxygen carriers based on NiO,
six oxygen carriers using OMG HSA grade NiO and Almatis CT3000SG α-Al2O3 were
prepared. The ratio of 4/6 between the active NiO and the supporting material was
maintained. However, 1% MgO, 5% MgO or 1% Ca(OH)2, based on weight, was added
during particle production, as shown in Table 3-3. It is believed that these additions result
in formation of the inert spinel MgAl2O4 or CaAl2O4. Results for all Ni-based oxygen
carriers prepared by freeze-granulation are presented in Paper II.
Table 3-3. Physical properties of NiO-based particles produced by freeze-
granulation with additives, investgated in Paper II. Oxygen carriers in italic
typeface defluidized during reactivity testing.
Additive
NiO/α-Al2O3 OMG HSA grade/Almatis CT3000SG
Oxygen Carrier Abbreviation
BET-Surface (m
2/g)*
Crushing Strength (N)**
Apparent Density (kg/m
3)***
1% MgO MagChem30
OMG5T1500 - S 1680 OMG5T1600 0.69 0.6 2380
5% MgO MagChem30
OMG6T1500 - S 1770 OMG6T1600 0.37 0.9 2780
1% Ca(OH)2 Nordkalk SL
OMG7T1500 0.19 4.2 3730
OMG7T1600 0.056 7.0 4330
*Measured by Micromeritics, Flowsorb II 2300; **Average force needed to fracture
individual particle; ***Assuming a void factor of 0.37; S - Too soft to measure
crushing strength
The ten Fe/Ti-based oxygen carriers were sintered at 1100°C for 6 h. During the
sintering process, the mixtures containing pure Fe2O3 and TiO2 powders at different
ratios formed pseudobrookite, Fe2TiO5, the most oxidized level of ilmenite in a chemical-
looping combustion process. Details of these oxygen carriers are presented in Table 3-4
and investigated in Paper VI. Here, the materials are compared to a natural Norwegian
ilmenite, supplied by Titania A/S and a South African ilmenite, supplied by IFP.
Table 3-4. Properties of particles produced by freeze-granulation from Fe2O3/TiO2,
investigated in Paper VI.
Oxygen Carrier
Abbreviation
Fe:Ti ratio
(% molar based)
Crushing
strength (N)*
Phases
indicated by
XRD sample 1-1 50:50 2.67 Fe2TiO5, TiO2 sample 1-2 52.4:47.6 2.80 Fe2TiO5, TiO2 sample 1-3 47.6:52.4 2.80 Fe2TiO5, TiO2 sample 2-1 45:55 2.46 Fe2TiO5, TiO2 sample 2-2 55:45 1.95 Fe2TiO5, TiO2 sample 2-3 40:60 2.27 Fe2TiO5, TiO2 sample 2-4 60:40 1.70 Fe2TiO5, TiO2 sample 2-5 25:75 3.50 Fe2TiO5, TiO2 sample 2-6 75:25 1.47 Fe2TiO5, Fe2O3 sample 2-7 100:0 1.62 Fe2O3
*Average force needed to fracture individual particle

32
3.1.2 Spray-Drying
A powder mixture of NiO and α-Al2O3 was dispersed in deionized water containing the
necessary organic additives. Polyethyleneoxide and/or polyvinylalcohol and/or
polyethyleneglycol were used as organic binder. Darvan C or Dolapix were used as
dispersants. The suspension was homogenized either by milling in a planetary ball mill
for small quantities or by means of a horizontal attrition mill for larger amounts. The
water-based suspension was continuously stirred with a propeller blade mixer while
being pumped to a 2-fluid spray-dry nozzle. Sintering was performed in air at top
temperatures in the range of 1400°C to 1600°C, generally for 4 hours but two batches
were sintered for 8 and 16 hours respectively. Further details on the production procedure
can be found in Paper III.
A total of 17 oxygen carrier materials were produced in this manner and investigated in
Paper III. All of the oxygen carriers were prepared with the α-Al2O3 Almatis CT3000SG
while the NiO raw material was varied. Nine of the materials were prepared with the NiO
Novamet Refractory grade, at five different sintering temperatures, NOV1T1400sd-
NOV1T1500sd, and three different sintering times, NOV1T1450t4sd-NOV1T1450t16sd,
as indicated in the oxygen carrier abbreviation in Table 3-5. One of the materials,
NOV1T1450m30sd, was prepared in a larger batch of 30 kg to investigate up-scaling of
the particle production. Three materials were prepared with the NiO Novamet Green
grade F, NOV2T1400sd-NOV2T1500sd, each prepared at a different sintering
temperature. Further, five materials were prepared with the nickel oxides OMG HSA
grade, Vogler Brown grade and Umicore at varying sintering temperatures and times.
Table 3-5. Physical properties of particles produced by spray-drying,
investigated in Paper III.
NiO
α-Al2O3 Almatis CT3000SG
Oxygen Carrier Abbreviation
Crushing Strength (N)*
Apparent Density (kg/m
3)**
Novamet Refractory grade
NOV1T1400sd 1.6 2900 NOV1T1425sd 1.8 2990 NOV1T1450sd 1.8 3190 NOV1T1475sd 2.7 3470 NOV1T1500sd 3.0 3550 NOV1T1450t4sd 2.3 3190 NOV1T1450t8sd 2.7 3500 NOV1T1450t16sd 3.6 3750 NOV1T1450m30sd 2.3 3210
Novamet Green grade F
NOV2T1400sd 1.2 2830
NOV2T1450sd 1.5 3030
NOV2T1475sd 1.9 3350
OMG HSA grade OMG3T1600t16sd 0.4 2920
Vogler Brown grade VOG1T1475sd 0.6 2850
VOG1T1600t16sd 0.8 3600
Umicore UMI1T1475sd 0.3 2230
UMI1T1600t16sd 0.6 3220
*Average force needed to fracture individual particle; **Assuming a void factor of 0.37

33
To further increase the performance of the spray-dried particles, 24 oxygen carriers
with varying support materials were prepared and investigated in Paper IV. The NiO and
support materials used are presented in Table 3-6. All materials were prepared to give an
active NiO content of 40 wt%. The additions of MgO and Ca(OH)2 presented in Table 3-
6 are mass fractions based on the total mass of raw material.
Table 3-6. Raw materials used in oxygen carrier optimization by spray-drying in Paper IV.
Oxygen Carrier
Abbreviation NiO Support 1 Support 2 Support 3
S1 Novamet Refractory grade
α-Al2O3, CTC3000sg
5% MgO, Magchem30
S2 OMG Standard grade
α-Al2O3, CTC3000sg
5% MgO, Magchem30
1% Ca(OH)2, Nordkalk
S3 Novamet Refractory grade
MgAl2O4, CTC55
S4 OMG Standard grade
MgAl2O4, CTC55
S5 Novamet Refractory grade
α-Al2O3, CTC3000sg
1% MgO, Magchem30
S6 Novamet Refractory grade
MgAl2O4, E-SY2000
S7 Novamet Refractory grade
MgAl2O4, AR78
S8 Novamet Refractory grade
α-Al2O3, CTC3000sg
10% MgO, Magchem30
S9 OMG Standard grade
α-Al2O3, CTC3000sg
1% Ca(OH)2, Nordkalk
Sintering of these oxygen carriers was performed in air at top temperatures in the range
of 1300°C to 1600°C, for 4 hours. This sintering temperature is displayed in the
abbreviation for each oxygen carrier in Table 3-7.
Table 3-7. Physical properties of particles produced with varying support material by spray-
drying, investigated in Paper IV.
Oxygen
Carrier
Abbreviation
Crushing
Strength
[N]*
Apparent
Density
[kg/m3]**
Oxygen
Carrier
Abbreviation
Crushing
Strength
[N]*
Apparent
Density
[kg/m3]**
S1T1400 2.0 2850 S6T1400 1.6 2990 S1T1450 3.4 3360 S6T1450 2.5 3200
S2T1400 0.5 2040 S6T1500 3.5 3470 S2T1500 1.6 3360 S7T1400 2.1 2920 S2T1600 2.8 3950 S7T1450 3.1 3060 S3T1400 1.3 2850 S7T1500 3.5 3230 S4T1400 S 2070 S8T1400 2.5 2910 S4T1500 0.1 2220 S8T1450 3.9 3480 S4T1600 0.3 2530 S8T1500 5.0 3740 S5T1400 1.6 2970 S9T1300 S 1800 S5T1500 2.7 3290 S9T1400 0.2 2070 S5T1600 3.6 3660 S9T1500 1.1 3180
*Average force needed to fracture individual particle; **Assuming a void factor of 0.37; S - Too soft to
measure crushing strength
3.1.3 Unprocessed Materials
In Paper VII, the oxygen carriers are not manufactured by any particle preparation
method. Instead, seven of these were oxide scales, a by-product from the steel industry,

34
four from Scana, two from Sandvik and one from ESAB. Further, an industrial iron
material from Höganäs, an unprocessed iron ore from LKAB and a magnetic material
obtained from vehicle recycling from Stena Metall were tested. Before the reactivity
experiments, each of these oxygen carrier material was heated in air at 950°C for about
24 h to obtain a high degree of oxidation and then sieved into narrow size fractions.
These materials, and their physical strength, are presented in Table 3-8.
Table 3-8. Unprocessed oxygen carriers, investgated in Paper VII.
Oxygen Carrier Material Crushing Strength (N)* Scana 1 12.2 Scana 2 11.0 Scana 3 11.4 Scana 8 8.7 Sandvik 1 11.0 Sandvik 2 9.6 ESAB F Stena Metall 3.6 Höganäs 3.9 LKAB 5.9 Ilmenite 4.0
*Average force needed to fracture individual particle; F - Flake-like
geometry, crushing strength could not be measured.
3.2 Characterization of Oxygen Carriers
The oxygen carriers in chemical-looping combustion will be exposed to harsh
conditions such as high temperatures and high gas velocities. To avoid major
fragmentation and attrition, it is expected that oxygen carriers need to possess certain
strength. Thus, the crushing strength, or the force needed to fracture the particles, was
measured as an average of 30 particles, sized 180-250 µm for the freeze-granulated and
unprocessed particles and 180-212 µm for the spray-dried particles, using a Shimpo
FGN-5 device. Although these crushing strength tests give information about the strength
of single particles, their resistance to fragmentation and attrition in a circulating system is
also dependent on properties of their environment such as interactions with surrounding
particles, chemical-reactions, time, velocity, pressure and temperature [98]. Therefore,
the crushing strength can only be regarded as an indicative value that needs to be
complemented by experiments in circulating units.
To study the chemical composition and investigate possible phase transitions of the
oxygen carriers, both after the sintering process and the reactivity tests, the particles were
analyzed using X-ray powder diffraction by a Siemens D5000 powder diffractometer,
utilizing Cu Kα radiation. The shape and morphology of fresh and tested oxygen carriers
were studied using a FEI, Quanta 200 Environmental Scanning Electron Microscope
FEG. The Environmental Scanning Electron Microscope was equipped with an Oxford

35
Inca Energy dispersive X-ray system, by which information on the elemental surface
composition was obtained for some of the oxygen carriers.
Further, the industrial iron-based materials and the natural iron ore presented in Paper
VII were analyzed by Inductively Coupled Plasma – Optical Emission Spectrometry
(ICP-OES). The analysis was performed prior to the reactivity investigation to determine
the chemical composition of each oxygen carrier material.
Also, the apparent density of all synthetically produced oxygen carriers, sized 125-180
µm, was determined. The apparent density was calculated by weighing 5 ml of particles
filled in a cylinder and assuming a void factor of 0.37, which is the theoretical voidage of
a normally packed bed with uniformly sized spherical particles [32].
3.3 Reactivity Investigation of Oxygen Carriers
The reactivity investigations were conducted in a fluidized bed reactor of quartz, with
a length of 870 mm and an inner diameter of 22 mm. The reactor had a porous quartz
plate placed 370 mm from the bottom, and the temperature was measured 5 mm under
and 25 mm above this plate, using Pentronic CrAl/NiAl thermocouples enclosed in
inconel-600 alloys, inside quartz shells. The pressure drop over the bed was measured by
Honeywell pressure transducers at a frequency of 20 Hz. From the pressure fluctuations
obtained, it was possible to establish if the particles defluidized during the experiment,
and if so, at what point the defluidization occurred.
The bed material of size 125-180 µm was placed on the porous plate and heated in an
electric oven while being exposed to an inert atmosphere of N2, until reaching a desired
reaction temperature of 950ºC. When the experimental temperature was reached, the
particles were exposed alternatingly to oxidizing and reducing gases, thus simulating the
cyclic conditions of a chemical-looping combustion system. The standard gas
concentration used during oxidation was 5% O2 in N2. This low O2 concentration was
selected to avoid a large temperature increase, caused by the highly exothermic oxidation
reaction. For reduction, 100% CH4 was used for Ni-based oxygen carriers and synthesis
gas containing 50% CO and 50% H2 was used for Fe-based oxygen carriers. CH4 was
used since it is the major constituent of natural gas, and simplifies the experimental
evaluation compared to using natural gas. The synthesis gas concentration was chosen to
resemble the gas formed by steam gasification of a solid fuel, as presented in reaction (3).
The experiments for the reactivity study of a Ni-based oxygen carrier in Paper V were
conducted with 50% H2O in the reducing gas to avoid defluidization. Further details on
those experiments are presented in Paper V. To avoid mixing of oxidizing and reducing

36
gases during the transition, inert N2 was introduced for 180 s after each period in all
experiments.
The standard bed mass used during reactivity experiments was 15 g and most
experiments with Ni-based oxygen carriers were conducted with 15 g of active material.
However, some Ni-based materials were also investigated using a 1 g active bed mass
mixed in inert quartz, still with a total bed mass of 15 g, and one material was
investigated with a bed mass of 3 g. These small active bed masses were used in order to
obtain an incomplete fuel conversion and thereby provide the possibility to calculate an
oxygen carrier reactivity, which was not limited by the amount of incoming methane.
Further, a few experiments with Ni-based oxygen carriers were conducted with higher
bed masses of up to 40 g to study fluidization behaviour. In these cases, the reduction
flow was increased in order to keep the ratio of the bed mass to reduction flow constant.
All experiments with Fe-based oxygen carriers were conducted with the standard bed
mass of 15 g. However, the active oxygen carriers were diluted with inert quartz to obtain
an incomplete fuel conversion and thereby enable comparison of different materials.
Here, the mass-fraction of oxygen carriers in the bed was 20 or 40%.
The inlet CH4 and N2 flows with Ni-based oxygen carriers were varied between 450
mLN/min and 1200 mLN/min during reduction and inert periods with most experiments
conducted at the lower flow. The flow during the oxidizing period was kept constant at
1000 mLN/min for Ni-based oxygen carriers. A reduction flow of 450 mLN/min
corresponds to 2.5-8.7umf, where umf is the minimum fluidization velocity, i.e., the gas
velocity at which the oxygen carriers would start to fluidize theoretically [32]. An
oxidation flow of 1000 mLN/min corresponds to 8.1-28umf. The experiments with Fe-
based oxygen carriers were conducted with an inlet flow of 900 mLN/min for all periods.
This flow corresponds to 5.9–7.9umf for the reduction period and 8.5–11.3umf for the
oxidation period, for the synthetically produced materials. All flows were normalized to 1
bar and 0ºC.
All oxygen carriers were tested for several reduction and oxidation periods and
normally, the time in reduction was gradually increased until full oxygen carrier
conversion was reached or until defluidization occurred. The time under oxidizing
conditions was adjusted to give complete oxygen carrier oxidation.
The gas from the reactor was led to an electric cooler, where the water produced in the
reduction was condensed and removed, and then on to a Rosemount NGA-2000 gas
analyzer where the concentrations of CO2, CO, CH4 and O2 as well as the flow were
measured. During the experiments with Fe-based oxygen carriers, an updated version of

37
the analyzer with the ability to measure the concentration of H2 was used. The
experimental set-up of the reactivity analysis equipment is presented in Figure 3-1.
Figure 3-1. Schematic arrangement of the experimental set-up.
The basic set-up for the solid fuel experiments in Paper VII was similar to the set-up of
the gaseous fuel experiments. However, the shape of the reactor, the amount of oxygen
carriers, the feed of fuel, the temperature and the gas flows used during the experiments
were different. Further details of these experiments are presented in Paper VII.
Examples of the outlet gas concentrations, after water condensation and removal, for a
reduction and an oxidation period are presented for a Ni-based oxygen carrier in Figure
3-2 and for an Fe-based oxygen carrier in Figure 3-3.
[a] [b]
0 20 40 60 80 100 120 140Time [s]
0
20
40
60
80
100
Co
nc
en
tra
tio
n [
%]
Reduction
CH4
CO
CO2
Inert
CO
CH4
0 400 800 1200 1600
Time [s]
0
1
2
3
4
5
6
Co
nc
en
tra
tio
n [
%]
O2
Oxidation Inert
Figure 3-2. Outlet gas concentrations during [a] reducing and [b] oxidizing conditions with 15 g of
NOV1T1400. Vertical dashed lines indicate the end of the reacting period and transition to inert gas.

38
[a] [b]
0 10 20 30 40 50 60Time [s]
0
20
40
60
80
100C
on
ce
ntr
ati
on
[%
]
CO2
CO
H2
Reduction Inert
0 200 400 600
Time [s]
0
1
2
3
4
5
6
Co
nc
en
tra
tio
n [
%]
O2
InertOxidation
Figure 3-3. Outlet gas concentrations during [a] reducing and [b] oxidizing conditions with 3 g of
Sandvik 2. Vertical dashed lines indicate the end of the reacting period and transition to inert gas.
A peak of unconverted methane appears early in the reduction period for Ni-based
oxygen carriers, but disappears as the oxygen in the particles is gradually consumed. This
can be explained by the formation of metallic Ni-sites on the surface, which acts as
catalyst for converting methane through steam reforming:
224 3HCOOHCH (15)
and/or through methane pyrolysis:
24 2HCCH (16)
The thermodynamic limitation when using nickel as an oxygen carrier can be seen from
the small amount of CO always present during reduction. The CO released from the
reactor had two peaks. The first is connected with the decrease of CO2 and is caused by
the lack of oxygen to fully convert the fuel. The second is caused by a solid-solid reaction
of carbon formed with some remainders of oxygen in the oxygen carriers and will be
discussed in the Carbon Formation section.
For Fe-based oxygen carriers, the incoming CO and H2 are partially converted to CO2
and H2O, as seen in Figure 3-3a. However, as a result of the insufficient oxygen carrier
bed mass, there is always unreacted CO and H2 passing through the bed.
During the oxidations, presented in Figure 3-2b and 3-3b, complete conversion of the
incoming O2 occurs initially. This implies good contact between gas and oxygen carrier
and indicates a high oxidation rate, which is limited by the amount of oxygen supplied.

39
As seen in Figure 3-2a and 3-3a, the retention time between the introduction of reacting
gases and detection of product gases in the analyzer is 10-15 s. To obtain a more accurate
concentration profile of the gases leaving the reaction zone, where this residence time and
back-mixing in the system are considered, a method of deconvolution [90, 99] was used
to correct the gas concentrations. Figure 3-4 shows the corrected gas concentrations, for
the reduction of a Ni-based oxygen carrier, when dispersion in the system was accounted
for. The calculations show that most of the dispersion takes place in the electric cooler
after the reactor. Since steam is condensed before reaching the gas analyzer, the H2O
concentration is calculated by estimating equilibrium between the reacting gases in the
water-gas shift reaction. The major H2 peak in the end of the reduction period is not
measured in the gas analyzer but estimated to make up a total gas concentration of 100%.
0 20 40 60 80 100 120 140Time [s]
0
20
40
60
80
100
Co
nc
en
tra
tio
n [
%]
Reduction
CH4
CO2
Inert
CH4
H2O
H2
COCO
CO2
Figure 3-4. Concentration profiles during reduction of NOV1T1400 after correction for dispersion in
the system. Vertical dashed lines indicate the end of the reduction period and transition to inert gas.
From the measured outlet gas concentrations, together with flow measurements, the
reactivity of the Ni-based particles could be calculated. The degree of oxidation of the
oxygen carriers, or the conversion, was defined as:
redox
red
mm
mmX (17)
where m is the actual mass of sample, mox is the mass of the sample when fully oxidized,
and mred the mass of the sample in its fully reduced form. The degree of conversion,
during reduction of Ni-based oxygen carriers, was calculated as a function of time, as:

40
1
0
22)34(
1,,,1
t
t
outHoutCOoutCOout
toto
ii dtpppnPn
XX (18)
Here, Xi is the conversion as a function of time for period i, Xi-1 is the conversion after
the preceding period, t0 and t1 are the times for the start and the finish of the period, no is
the number of moles of active oxygen in the unreacted oxygen carrier, outn is the molar
flow of the gas leaving the reactor after water has been condensed and removed, Ptot is the
total pressure and pi,out is the outlet partial pressure of component i after H2O removal. As
outHp ,2 was not measured online in the experiments with Ni-based oxygen carriers, it was
assumed to be related to the outlet partial pressure of CO and CO2 through a relation
based on the equilibrium of the gas shift reaction:
222 HCOOHCO (19)
In order to enable a comparison of the Fe-based oxygen carriers, which were containing
varying amounts of active oxygen, the mass-based conversion, ω, defined in equation (5)
was used. The degree of mass-based conversion, with syngas as fuel, was calculated as a
function of time as:
1
0
22)2( ,,,1
t
t
outHoutCOoutCOout
totox
Oii dtpppn
Pm
M (20)
Here, ωi is the mass-based conversion as a function of time for period i, ωi-1 is the mass-
based conversion after the preceding period and MO is the molar mass of oxygen. The
degree of conversion or the degree of mass based conversion was also calculated during
the oxidation period to verify that the oxygen carriers were completely oxidized.
Gas yields, for the three different fuel gases, were defined in accordance with the gas
yields presented in Table 2-1 as:
outCOoutCOoutCH
outCO
CHppp
p
,,,
,
24
2
4 (21)
outCOoutCO
outCO
COpp
p
,,
,
2
2 (22)

41
outHoutOH
outOH
Hyy
y
,,
,
22
2
2 (23)
Here, yi,out is the partial pressure of component i in the outgoing gas stream before H2O
condensation. The condensed H2O is separated in the electric cooler before the gases
reach the analyzer, and therefore not measured. However, since the incoming
concentrations of H2 and CO are equal in these tests, equation (23) can be rewritten as:
outCOoutCO
outH
Hpp
p
,,
,
2
2
21 (24)
To quantify the total conversion of CO for the Fe-based oxygen carriers, the yield for
CO during a complete reduction period was defined as:
dtppn
dtpn
outCOoutCO
t
t
out
outCO
t
t
out
totCO
)( ,,
,
,
2
1
0
2
1
0
(25)
In order to facilitate comparison of different synthetically produced oxygen carriers
with varying fractions of Fe:Ti, an average CO conversion at high degrees of oxygen
carrier conversion was introduced. The boundary values of mass-based conversion, ω,
were chosen as the gas conversion was fairly high in this interval for all materials tested.
The average CO conversion was defined as:
9990
990
9990
990
2
2
.X
.
out,COout,CO
.
.
out,CO
avg,CO
d)pp(
dp
(26)
To quantify the amount of unreacted methane leaving the reactor, when using Ni-based
oxygen carriers, a ratio of methane in the outlet gas stream was defined as:
outCOoutCOoutCH
outCH
CHppp
pfr
,,,
,
24
4
4 (27)
To facilitate comparison of different Ni-based oxygen carriers, a Methane index was
introduced, defined as the fraction of methane leaving the reactor when X was between

42
0.95 and 0.99. These values of conversion, X, were chosen since the initial methane peak
appeared somewhere in this interval for all oxygen carriers studied. The Methane index
was defined as:
990
950
990
9504
24
4
.X
.X
out,COout,COout,CH
.X
.X
out,CH
index,
dX)ppp(
dXp
CH (28)
As is evident from Figure 3-2a and 3-4, the conversion rate of oxygen carrier was
limited by the methane supplied for most of the reduction with Ni-based oxygen carriers.
However, the fuel conversion was incomplete in the tests with 1 g oxygen carriers diluted
in quartz and with 3 g oxygen carriers. Hence, the conversion rate of oxygen carrier was
not limited by the amount of CH4 supplied. Therefore, the experiments with 1 g oxygen
carriers were used to determine the reactivity by calculating a Rate index, using the same
method as has been described in detail by Cho [100] and Mattisson et al. [101]. The
definitions used to calculate the Rate index is also explained in Paper II and III. The Rate
index obtained can be used to estimate the needed bed mass in the fuel reactor, also
shown in Paper II and III. The experiments with 3 g oxygen carriers were used to obtain
kinetic data and to determine the solids inventory in an ideal fuel reactor without gas
solid-phase mass transfer limitations, as shown in Paper V.
Carbon formation can be calculated by integrating the total amounts of CO2 and CO
produced during the inert period following a reduction period. The carbon formation
ratio, Cdep/Cadded, is the amount of carbon formed during the reduction period over the
total amount of carbon introduced during the reduction period and is defined as:
3
0
24
3
1
2
t
t
out,COout,COout,CHout
t
t
out,COout,COout
added
dep
dtppp(n
dtpp(n
C
C
)
)
(29)
Here, t0 is the time when the reduction started, t1 is when the inert period started, and t3
is a point of time when no more CO2 or CO was registered. Because of the time delay
caused by gas residence time in the system, t1 is defined as the point of time in the inert
period when no more CH4 is detected in the outlet flow.

43
The degree of carbon conversion for solid fuels, as calculated in Paper VII, was defined
as:
tot
tC
m
mX (30)
where mt is the mass of carbon converted until time t and mtot is the total mass of carbon
converted during the reduction period. To facilitate comparison of the amount of CO and
H2 leaving the reactor during solid fuel experiments, two indices were defined as:
70
30
42
70
30
.CX
.CX
.CX
.CX
t
t
out,CHout,COout,COout
t
t
out,COout
index
dt)ppp(n
dtpn
,CO
(31)
70
30
42
70
30
2
2 .CX
.CX
.CX
.CX
t
t
out,CHout,COout,COout
t
t
out,Hout
index
dt)ppp(n
dtpn
,H
(32)
where CXt is the time needed to reach a certain degree of carbon conversion, XC. The
boundary values of the degree of carbon conversion XC=0.3 and XC=0.7 were chosen as
the rate of conversion is high and fairly stable in this region.

44

45
4
RESULTS
4.1 Characterization of Oxygen Carriers
The X-ray powder diffraction investigation revealed no differences in phase
composition between the Ni-based materials sintered at different temperatures and for
different times. The NiO raw materials used contain some impurities, although the
amounts are too small to be detected by X-ray powder diffraction. As specified by each
NiO supplier, most materials contain impurities of primarily Co, Cu, and Fe. The
amounts of these are highest for the nickel oxides Novamet Refractory grade and Vogler
Brown grade, where the fraction of Co is up to 1.5 wt%, while the fractions of Cu and Fe
are somewhat lower.
From the Inductively Coupled Plasma – Optical Emission Spectrometry (ICP-OES)
analysis of the iron-based materials presented in Paper VII, it was seen that all materials
contained varying fractions of non-iron elements. The oxide scales from Scana and
ESAB, the ore from LKAB and the industrial material from Höganäs are fairly pure iron
oxides while the oxide scales from Sandvik contain significant amounts of Cr and Ni and
the material from Stena Metall contains a wide variety of elements, including Al, Ca, Cu,
K, Mg, Na, Si and Zn.
The Scanning Electron Microscopy, SEM, analysis, confirmed that the manufactured
particles were spherical and that this sphericity was maintained during the reactivity
analysis. A difference noticed between the freeze-granulated and spray-dried oxygen
carriers was that some of the spray-dried particles had a hollow interior, as seen in Figure
4-1. This hollow interior was not seen in any particles produced by freeze-granulation
and is therefore believed to be a result of the preparation procedure. A difference between
the Ni-based oxygen carriers and the synthetically produced ilmenites was the cracks
found on the surface of many of synthetically produced ilmenites after the reactivity
investigation. Despite these cracks, no particle breakage was observed. Minor cracks
were also found on the surface of the natural ilmenites investigated in Paper VI. No such
cracks were seen on any Ni-based oxygen carrier, likely as a result of the inert material,
which helps maintaining the particle structure during the reactions.

46
[a] [b]
Figure 4-1. SEM-images of [a] freeze-granulated NOV1T1400 and [b] spray-dried NOV1T1400sd
prior to reactivity testing. The bar at bottom is 2 mm.
For Fe-based materials, the tested oxygen carriers were generally hard and none of
them could be excluded due to low mechanical strength, as displayed in Table 3-4 and 3-
8. Natural ilmenites were generally somewhat harder, with a crushing strength of 3.5-4 N,
as compared to synthetically produced ilmenites. For synthetically produced ilmenites,
the strength generally decreased as the Fe:Ti ratio was increased.
4.1.1 Effect of Sintering Temperature
Figure 4-2a shows the apparent density of the Ni-based oxygen carriers without
additives, as a function of sintering temperature. In Figure 4-2b, the crushing strength for
the particles that were hard enough to give a distinct value is displayed as a function of
sintering temperature.
[a] [b]
1400 1500 1600Sintering Temperature [°C]
0
1000
2000
3000
4000
5000
Ap
pa
ren
t D
en
sit
y [
kg
/m3]
1400 1500 1600Sintering Temperature [°C]
0.1
1
10
Cru
sh
ing
Str
en
gth
[N
]
Figure 4-2. [a] apparent density and [b] crushing strength as a function of sintering temperature for NOV1 ( ), NOV2 ( ), OMG1 ( ), OMG3 ( ), UMI1 ( ), UMI2 ( ), VOG1 ( ) and VOG2 ( ). Dashed
line indicates particles prepared by spray-drying.

47
Both the apparent density and the crushing strength increased with an increased
sintering temperature and were highly dependent on the starting material. Particles with
low apparent density have generally also low crushing strength and run the risk of
fragmentation or attrition, when exposed to circulation in a large-scale unit. As seen, the
production method does not seem to affect the physical properties of these particles
considerably as the two hardest and densest materials; NOV1 and NOV2, display similar
properties when produced by spray-drying as when produced by freeze-granulation.
Ni-based oxygen carriers with a low apparent density and crushing strength, e.g.,
UMI1T1400, have a more rough surface structure of fine granules while particles with
high apparent density and crushing strength, e.g., NOV1T1600, have a smoother surface
made up of coarser granules, as displayed in Figure 4-3. Further, the harder and denser
particles have generally a lower BET-surface, as seen in Table 3-2.
[a] [b] [c]
[d] [e] [f]
Figure 4-3. SEM-images of particles and their surfaces prior to reactivity testing. [a] and [d]
UMI1T1400, [b] and [e] NOV1T1400 and [c] and [f] NOV1T1600. The bar at bottom is 200 µm and
20 µm respectively.
Apart from increasing the sintering temperature, the density and crushing strength of
Ni-based oxygen carriers can be increased by an addition of Ca(OH)2 during particle
preparation, which is displayed in Figure 4-4. The figure shows the apparent density and
crushing strength as a function of sintering temperature for Ni-based particles with
additions of MgAl2O4 or MgO and/or Ca(OH)2.

48
[a] [b]
1300 1400 1500 1600
Sintering Temperature [°C]
1000
2000
3000
4000
5000A
pp
are
nt
Den
sit
y [
kg
/m3]
1400 1500 1600Sintering Temperature [°C]
0
2
4
6
8
Cru
sh
ing
Str
en
gth
[N
]
Figure 4-4. [a] apparent density and [b] crushing strength as a function of sintering temperature for OMG5 ( ), OMG6 ( ), OMG7 ( ), S1 ( ), S2 ( ), S3 ( ), S4 ( ), S5 ( ), S6 ( ), S7 ( ), S8 ( ) and S9
( ). Solid line indicates particles based on OMG HSA grade prepared by freeze-granulation with
additives. Dashed line indicates particles based on Novamet Refractory grade prepared by spray-
drying with additives. Dashed and dotted line indicates particles based on OMG Standard grade
prepared by spray-drying with additives.
OMG5 and OMG6 are prepared with an addition of MgO, see Table 3-3, and display
similar physical properties as OMG3 prepared without additives and shown in Figure 4-2.
OMG7 is prepared with an addition of Ca(OH)2 and its apparent density and crushing
strength is considerably higher than OMG3. The oxygen carriers S1, S3, S5, S6, S7 and
S8 are all prepared by spray-drying and based on Novamet Refractory grade, supported
by different magnesium-containing support materials, see Table 3-6. These oxygen
carriers display similar physical properties as NOV1sd in Figure 4-2, which is produced
without additives. The particles S2, S4 and S9 are based on OMG Standard grade and as
shown, the strength is highest for S2 and S9, which are prepared with an addition of
Ca(OH)2.
4.1.2 Effect of Sintering Time
Harder Ni-based oxygen carriers of higher density can also be obtained by increasing
the time period during which they are exposed to high temperatures during sintering, as
displayed in Figure 4-5. This result suggests that durable particles can be prepared at
moderate sintering temperatures, thus avoiding the need of using ultra high temperature
furnaces.

49
[a] [b]
4 8 12 16Sintering Time [h]
3000
3500
4000A
pp
are
nt
Den
sit
y [
kg
/m3]
4 8 12 16
Sintering Time [h]
2
2.5
3
3.5
4
Cru
sh
ing
Str
en
gth
[N
]
Figure 4-5. [a] apparent density and [b] crushing strength as a function of sintering time for
NOV1T1450sd ( ).
4.2 Reactivity of Oxygen Carriers
4.2.1 Ni-Based Particles without Additives
Figure 4-6 shows examples of the gas yield and outlet methane fraction as a function of
oxygen carrier conversion for some of the materials investigated in the batch fluidized
bed reactor. In general, the gas conversion was high for all materials which were
fluidizing properly.
[a] [b]
Figure 4-6. [a] gas yield, 4CHγ , and [b] fraction of unreacted CH4 as a function of the conversion, X,
for NOV1T1400sd ( ), NOV2T1400sd ( ), NOV1T1400 ( ) and NOV2T1400 ( ).

50
The main difference seen between the oxygen carriers was the fraction of unreacted
CH4 released early in reduction. This amount was a function of the raw materials used
during preparation, but fairly independent of the preparation method, i.e., freeze-
granulation or spray-drying, as displayed in Figure 4-6.
During the initial screening of the oxygen carriers prepared by freeze-granulation
without additives, ten of the oxygen carriers displayed a high gas conversion in
combination with excellent fluidization behaviour. Two of these materials, NOV1T1400
and NOV2T1400, also displayed a high strength. Therefore, focus was set on oxygen
carriers based on the same raw materials as NOV1T1400 and NOV2T1400 when the
spray-dried oxygen carriers were investigated. Table 4-1 shows the CH4,index for the
freeze-granulated and spray-dried oxygen carriers. As seen from the initial screening of
freeze-granulated oxygen carriers, the materials based on Vogler NiO have the highest
fraction of unconverted CH4 while materials based on Novamet green grade F and
Umicore NiO have the lowest. As shown from the reactivity investigation of the spray-
dried oxygen carriers, the fraction of unreacted CH4 cannot be significantly lowered by
changing the sintering temperature. This was true for both the oxygen carriers based on
Novamet Refractory grade, NOV1T1400sd-NOV1T11475sd, and for the oxygen carriers
based on Novamet Green grade F, NOV2T1400sd-NOV2T1475sd. However, by
increasing the sintering time, the fraction of unreacted CH4 is considerably lowered, as
seen by comparing the methane index for NOV1T1450t4sd-NOV1T1450t16sd.
Table 4-1. Methane index for particles without additives.
Freeze-Granulated
Oxygen Carriers
CH4,index
(%)
Spray-Dried
Oxygen Carriers
CH4,index
(%)
OMG1T1400 7.3 NOV1T1400sd 8.2
OMG1T1500 4.6 NOV1T1425sd 6.9
OMG3T1400 3.1 NOV1T1450sd 10.2
OMG3T1500 3.8 NOV1T1475sd 7.9
NOV1T1400 6.4 NOV2T400sd 4.0
NOV2T1400 2.6 NOV2T1450sd 3.4
VOG1T1400 17.8 NOV2T1475sd 3.3
VOG1T1500 8.4 NOV1T1450t4sd 10.5
UMI1T1400 2.8 NOV1T1450t8sd 7.5
UMI2T1500 2.8 NOV1T1450t16sd 3.9
4.2.2 Ni-Based Particles with Additives
The main reason for preparing oxygen carriers based on NiO with magnesium-
containing support materials was to improve the fuel conversion early in reduction.
Generally, the amount of unconverted CH4 is higher with NiAl2O4 as support material as
compared to with MgAl2O4 for Ni-based oxygen carriers [72, 85, 87, 102]. The improved
fuel conversion, and hence lowered CH4,index, when adding MgO during particle

51
preparation was confirmed in the screening of the freeze-granulated oxygen carriers.
Here, the CH4,index for oxygen carriers based on OMG HSA grade was decreased from
3.8% for an oxygen carrier without MgO to 2.8% with an addition of 1 wt% MgO and
0.3% with an addition of 5 wt% MgO as shown in Paper II. The improvement in methane
conversion has been explained by an improved dispersion of nickel, which increases the
catalytic performance of the oxygen carriers [103].
The fraction of unreacted methane detected in the outlet of the reactor for seven of the
oxygen carriers prepared by spray-drying, supported by MgAl2O4 or with an addition of
MgO, is displayed in Figure 4-7. Also included for comparison is NOV1T1450sd which
was produced without magnesium. S4 and S9 are not included in the figure since their
crushing strength was believed to be too low to withstand fragmentation and attrition in a
large-scale application. As is evident, all materials studied displayed a significant
improvement in methane conversion when compared to NOV1T1450sd. A quantification
of this improvement is displayed in the CH4,index for each oxygen carrier.
1 0.95 0.9 0.85 0.8 0.75X [-]
0
0.02
0.04
0.06
0.08
0.1
frC
H4 [
-]
Figure 4-7. Fraction of unreacted CH4 as a function of oxygen carrier conversion, X, and CH4,index for
NOV1T1450sd (---), S5T1400 ( ), S3T1400 ( ), S6T1400 ( ), S1T1400 ( ), S2T1500 ( ), S8T1400
( ) and S7T1400 ( ).
The fraction of unreacted CH4 was fairly unchanged as a function of reduction cycle for
all these materials although the conversion to CO2 was not, as displayed in Figures 4-8
and 4-9. All materials displayed the same trend of increasing their oxygen carrier
conversion span with high gas yield as a function of cycle number. Interestingly, oxygen
carriers with a high CH4,index also have a high gas yield for a large oxygen carrier
conversion span. In fact, a rank of the oxygen carrier’s CH4,index and conversion span with
high gas yield follows exactly the same order. However, it should be pointed out that the
improved gas yield as a function of cycle number showed no tendencies of slowing down
Oxygen Carrier
CH4,index [%]
NOV1T1450sd S5T1400 S3T1400 S6T1400 S1T1400 S2T1500 S8T1400 S7T1400
10.2 3.9 2.5 1.6
0.69 0.36 0.21 0.13

52
and therefore even the oxygen carriers with a low CH4,index may give high gas yields at
low degrees of oxygen carrier oxidation eventually.
Figure 4-8. Gas yield, 4CHγ , as a function of oxygen carrier conversion, X, for S5T1400, S3T1400,
S6T1400 and S1T1400.
Figure 4-9. Gas yield, 4CHγ , as a function of oxygen carrier conversion, X, for S2T1500, S8T1400 and
S7T1400.
4.2.3 Rate Index
The tests with 1 g of Ni-based oxygen carriers diluted in inert quartz resulted in a
maximum gas yield of approximately 90-95%. In these experiments, the active material
corresponded to only 4 kg/MW fuel. Hence, the reactivity was not restricted by the
amount of methane supplied and a reduction rate could be calculated, see Table 4-2.
Table 4-2. Rate index of Ni-based oxygen carrier particles.
Freeze-
Gran.
Rate index
[%/min]
Freeze-Gran.
with MgO
Rate index
[%/min]
Spray-
Dried
Rate index
[%/min] OMG1T1400 78 OMG5T1500 84 NOV1T1400sd 75 OMG1T1500 87 OMG6T1500 78 NOV1T1450sd 63 OMG3T1400 74 OMG6T1600 62 NOV2T1400sd 83 OMG3T1500 88 NOV2T1450sd 83 NOV1T1400 72 NOV2T1400 82 VOG1T1400 83 VOG1T1500 84 UMI1T1400 77 UMI2T1500 85
The Rate index is defined as a normalized conversion rate, expressed in terms of
percentage mass change per minute [101]. Calculations assume a first-order reaction and

53
a negligible mass-transfer resistance between the bubble phase and the dense phase in the
bed. Details of the calculations are presented in Paper II and III. A comparison using Rate
index showed that the reactivity was similar for most materials tested, with a Rate index
varying between 62 and 88%/min, as seen in Table 4-2.
4.2.4 Reduction Kinetics with NOV1T1450sd
In Paper V, a more detailed analysis of the reactivity of NOV1T1450sd was conducted
and experiments were made at temperatures between 750 C and 950 C using bed masses
of 3 g and 30 g, corresponding to 6 and 57 kg/MW. The particles clearly showed high
reactivity, with a maximum gas yield between 86% and 93% in the investigated
temperature interval using only 6 kg/MW, as displayed in Figure 4-10.
[a] [b]
Figure 4-10. Gas yield, 4CHγ , as a function of the conversion, X, for NOV1T1450sd, using a bed mass
corresponding to [a] 57 kg/MW and [b] 6 kg/MW at 950ºC ( ), 850ºC ( ) and 750ºC ( ).
A comparison of the reactivity with data from TGA experiments conducted at CSIC in
Zaragoza showed that the reactivity generally was higher in the batch fluidized bed. A
simple reactor model using kinetic data from the batch fluidized bed reactor and the TGA
was used to predict the mass of oxygen carrier particles necessary for full gas yield of
methane to carbon dioxide in the fuel reactor. Results from this study showed that less
than 10 kg/MW would be sufficient for complete conversion assuming a 0.6th
order of
reaction with respect to methane, or 10-20 kg/MW for a reaction order of 1 or using TGA
data. Comparison with experiments performed in a 10 and a 120 kWth chemical-looping
combustion reactor with the same type of oxygen carrier showed that even when
employing 13 to 50 times the amount of oxygen carrier theoretically needed for complete
gas conversion, full gas yield was not obtained in the circulating systems.

54
4.2.5 Natural and Synthetic Ilmenites
For ilmenite particles, the fuel conversion was increased as a function of number of
cycles. This increase was clearly seen in the conversion of CO whereas the conversion of
H2 was generally high and stable throughout the experiments. The conversion of H2 was
always higher than the conversion of CO.
Figure 4-11 shows the fuel conversion for three of the synthetically produced materials
and the two natural ilmenite minerals, after reaching a fairly stable conversion.
Figure 4-11. [a] gas yield of CO, COγ , and [b] gas yield of H2, 2Hγ , as a function of mass-based
conversion, ω, for sample 1-1 ( ), sample 2-5 ( ), sample 2-7 ( ), Norwegian ilmenite ( ) and South
African Ilmenite ( ).
As seen in Figure 4-11a, all synthetically produced materials display a high conversion
of CO early in the reduction period. However, for the material containing pure Fe2O3
(sample 2-7) in its oxidized state, the conversion was maintained fairly high throughout
the reduction while the material with a Fe:Ti ratio of 25:75 (sample 2-5) showed a rapidly
decreasing conversion of CO. The material containing equal amounts of Fe and Ti
(sample 1-1) showed a conversion between these two. The CO conversion of natural
Norwegian ilmenite was fairly similar to the synthetically produced ilmenite containing
50% Fe although the initial conversion was somewhat lower. The South African ilmenite
agglomerated when the reduction time was increased and the conversion displayed in
Figure 4-11 is from a reduction period before this agglomeration occurred. As seen, the
CO conversion with the South African ilmenite was poor, as compared to the other
materials. As displayed in Figure 4-11b, the conversion of H2 was high and fairly stable
as a function of mass-based oxygen carrier conversion, ω, for all materials. The H2
conversion with South African ilmenite was somewhat lower, as compared to the other
materials.
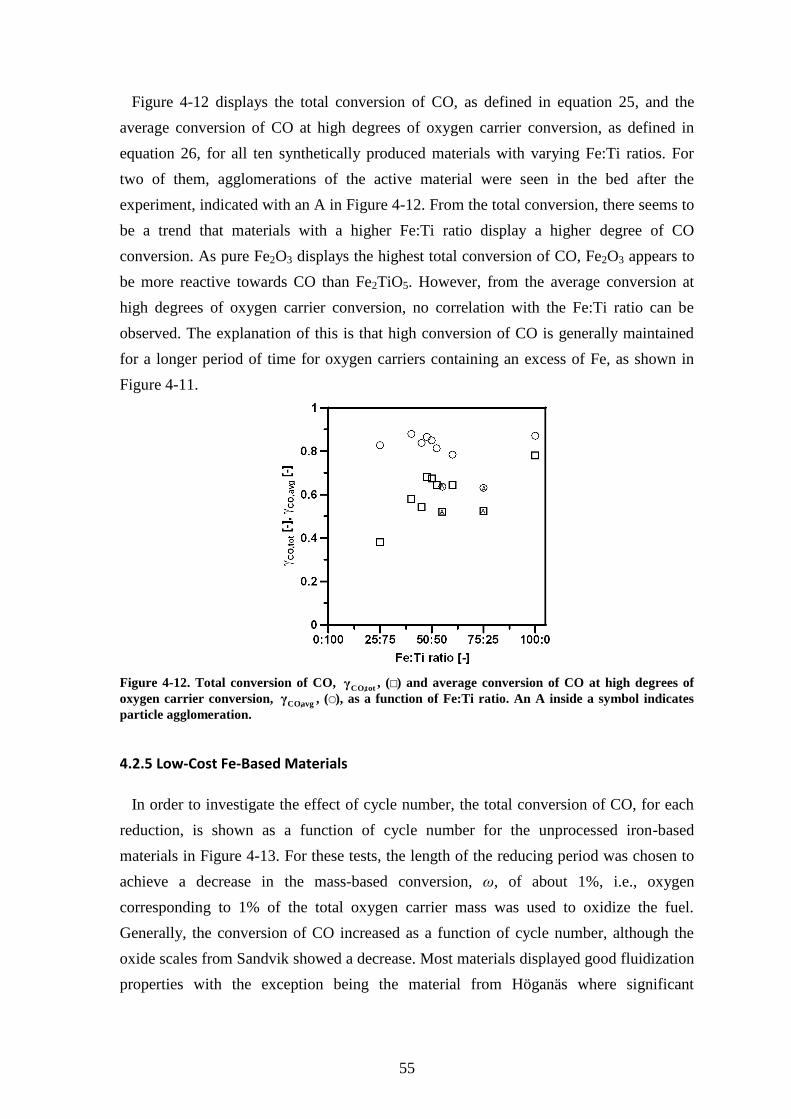
55
Figure 4-12 displays the total conversion of CO, as defined in equation 25, and the
average conversion of CO at high degrees of oxygen carrier conversion, as defined in
equation 26, for all ten synthetically produced materials with varying Fe:Ti ratios. For
two of them, agglomerations of the active material were seen in the bed after the
experiment, indicated with an A in Figure 4-12. From the total conversion, there seems to
be a trend that materials with a higher Fe:Ti ratio display a higher degree of CO
conversion. As pure Fe2O3 displays the highest total conversion of CO, Fe2O3 appears to
be more reactive towards CO than Fe2TiO5. However, from the average conversion at
high degrees of oxygen carrier conversion, no correlation with the Fe:Ti ratio can be
observed. The explanation of this is that high conversion of CO is generally maintained
for a longer period of time for oxygen carriers containing an excess of Fe, as shown in
Figure 4-11.
Figure 4-12. Total conversion of CO, totCO,γ , ( ) and average conversion of CO at high degrees of
oxygen carrier conversion, avgCO,γ , ( ), as a function of Fe:Ti ratio. An A inside a symbol indicates
particle agglomeration.
4.2.5 Low-Cost Fe-Based Materials
In order to investigate the effect of cycle number, the total conversion of CO, for each
reduction, is shown as a function of cycle number for the unprocessed iron-based
materials in Figure 4-13. For these tests, the length of the reducing period was chosen to
achieve a decrease in the mass-based conversion, ω, of about 1%, i.e., oxygen
corresponding to 1% of the total oxygen carrier mass was used to oxidize the fuel.
Generally, the conversion of CO increased as a function of cycle number, although the
oxide scales from Sandvik showed a decrease. Most materials displayed good fluidization
properties with the exception being the material from Höganäs where significant

56
agglomeration was formed. All of the investigated materials displayed a higher
conversion of CO than the reference sample, ilmenite.
Figure 4-13. Total conversion of CO, totCO,γ , as a function of cycle number for Sandvik 1 ( ), Sandvik
2 ( ), Scana 1 ( ), Scana 2 ( ), Scana 3 ( ), Scana 8 ( ), ESAB ( ), LKAB ( ), Höganäs ( ), Stena
Metall ( ) and the reference sample, ilmenite (---).
The conversion of H2 was considerably higher than the conversion of CO. All materials
converted between 90 and 96% of the incoming H2, independent of reduction number.
The difference in H2 conversion between the different oxygen carrier materials was
insignificant.
Figure 4-14 shows a comparison of the fuel conversion between three of the iron-based
materials selected after an initial screening, and the reference sample, ilmenite. Here, the
experiments were performed with longer reduction periods, as compared to the results
presented in Figure 4-13, and the results represent a reduction where fairly stable fuel
conversion has been reached. The dashed lines represent conversion of H2 and the solid
lines the CO conversion. It should be noted that the amount of active oxygen carrier is
lower than in the experiments with natural and synthetically produced ilmenites presented
in Figure 4-11, hence the lower fuel conversion in Figure 4-14. As seen, the oxide scale
from Sandvik displays the highest conversion of CO and together with the oxide scale
from Scana, the highest conversion of H2. Ilmenite displays the lowest conversion with
respect to both these gases. The reason why the oxide scale from Sandvik is the most
reactive may be due to higher levels of non-iron metals. As shown in Paper VII, Sandvik
2 contains 8.0 wt% of Ni, 1.0 wt% of Mn and 0.22 wt% of Cu. All these elements have
shown high reactivity with syngas in TGA experiments [104, 105].

57
Figure 4-14. gas yield of H2, 2Hγ , dashed lines and gas yield of CO,
COγ , solid lines, as a function of
mass-based oxygen carrier conversion, ω, for Sandvik 2 ( ), Scana 8 ( ), LKAB ( ) and the reference
sample, ilmenite ( ).
4.3 Effect of Up-Scaling in Particle Production
In order to investigate the effect of up-scaling in particle production of NOV1T1450sd,
and to produce Ni-based oxygen carriers to be used in a 10 kWth circulating chemical-
looping combustion system, a batch of 30 kg was produced, in contrast to the typical
amount of 100-200 g, needed for laboratory testing. When comparing these two batches,
it was seen that the gas yield and fraction of unreacted methane was practically identical,
thus no difficulties should be expected during scale-up in particle production, as
displayed in Figure 4-15.
[a] [b]
Figure 4-15. [a] gas yield, 4CHγ , and [b] fraction unreacted CH4, as a function of the conversion, X,
for NOV1T1450sd ( ) and NOV1T1450m30sd ( ).

58
4.4 Defluidization
During the reactivity testing of the freeze-granulated, Ni-based, oxygen carriers,
defluidization sometimes occurred, as indicated in Table 3-2. Defluidization always came
about late in a reduction period or early in a subsequent inert period. To avoid this, the
inert flow was increased to make fluidization recommence. However, defluidization then
reoccurred during one of the subsequent reduction periods or its following inert period
until it was permanent.
During the reactivity testing of the spray-dried, Ni-based, oxygen carriers, special focus
was placed on investigating the defluidization behaviour. Thus, the reduction time was
increased as a function of cycle until the particles defluidized or until complete oxygen
carrier conversion was reached. In this manner, the conversion, X, of the oxygen carrier
where defluidization occurred could be obtained. The time in reduction for each test
performed can be found in Paper III. To study the phenomena of defluidization, the
reduction and inert flows were varied in these experiments. However, the oxygen carrier
bed mass to fuel flow ratio was kept constant to make the gas conversion comparable
between different experiments.
From this investigation, it was clearly seen that the risk of defluidization could be
decreased, either by increasing the inlet gas flow or by shortening the time in reduction.
In all cases where defluidization occurred, only soft and easily breakable agglomerates
were formed and the oxygen carriers remained spherical.
The fact that defluidization only occurred for fully or partially reduced oxygen carriers
suggest that the formation of nickel affect the fluidization properties adversely. This was
also confirmed by the Energy dispersive X-ray, EDX, analysis, which clearly showed
accumulations of pure Ni on the oxygen carrier surface, for highly reduced particles
where defluidization had occurred, as displayed in Figure 4-16. It is believed that these
accumulations contribute to attaching particles together, thus causing defluidization [82].
Generally, no such accumulations were seen on oxidized particles prior to reactivity
testing or on reduced particles after reactivity testing where no defluidization had
occurred.

59
Figure 4-16. SEM-image of NOV1T1450sd, after reactivity testing.
Figure 4-17 shows the gas velocity, expressed as a ratio of incoming methane velocity,
u, over the minimum fluidization velocity, umf, i.e., the gas velocity where the oxygen
carriers would start to fluidize theoretically, for NOV1 and NOV1sd as a function of the
apparent density for a number of tests. In some of the tests, the inlet gas velocity was
raised to counteract the decrease in u/umf, resulting from increasing density. Clearly, this
did not help and particles with higher densities also defluidized at higher u/umf.
2000 2500 3000 3500 4000 4500apparent density [kg/m3]
1
2
3
4
5
6
7
8
9
10
u/u
mf [-
]
1
4
2
3
56
65
8
8
8
7
Figure 4-17. Ratio between actual velocity and minimum fluidization velocity as a function of the
apparent density. Circle around number indicate defluidization. 1=NOV1T1400, 2=NOV1T1500,
3=NOV1T1600 4=NOV1T1400sd, 5=NOV1T1425sd, 6=NOV1T1450sd, 7=NOV1T1475sd and
8=NOV1T1500sd.
During the reactivity tests with oxygen carriers prepared with Mg-rich additives by
spray-drying, displayed in Figure 4-7, no defluidization tendencies occurred for any of
the oxygen carriers. In addition, no accumulations of pure Ni were detected on the
Ni Ni
Ni

60
surface of these particles. Thus, besides increasing the CH4 conversion, an addition of
MgO also seems to improve the fluidization behaviour.
4.5 Carbon Formation
During the reduction period carbon might form on the oxygen carrier particles, most
likely at low gas yields where the availability of oxygen is low [96]. With CH4 as fuel,
carbon formation should not be expected at 950ºC, as long as at least one fourth of the
oxygen needed for complete methane conversion is supplied as shown in Figure 2-8a.
With CO as fuel, the amount of oxygen needed to avoid carbon formation is only about
1% of the total amount needed for complete conversion of the fuel, at 950ºC and
atmospheric pressure, as shown in Figure 2-8b. With Ni-based oxygen carriers, Cho et al.
have concluded that formation of solid carbon occurs rapidly when the availability of
oxygen is low [96]. However, for Fe-based oxygen carriers the formation of solid carbon
appears to be insignificant [96].
These thermodynamic limitations and the previous experimental results agreed well
with the present results as carbon formation was clearly seen on Ni-based oxygen
carriers, at low degrees of conversion, while no formation of solid carbon was detected
on any of the Fe-based oxygen carriers. Figure 4-18a displays the amount of carbon
formed on the Ni-based oxygen carriers produced by freeze-granulation, and its
correlation with the oxygen carrier conversion.
[a] [b]
Figure 4-18. Carbon formation ratio, Cdep/Cadded, [a] as a function of the conversion, X, and [b] as a
function of the gas yield at breakpoint, 4CHγ , i.e., at the end of the reduction period, for OMG1T1400
( ), OMG1T1500 ( ), OMG3T1400 ( ), OMG3T1500 ( ), NOV1T1400 ( ), NOV2T1400 ( ),
VOG1T1400 ( ), VOG1T1500 ( ), UMI1T1400 ( ), UMI1T1500 ( ), OMG5T1500 ( ), OMG6T1500 (
) and OMG6T1600 ( ).
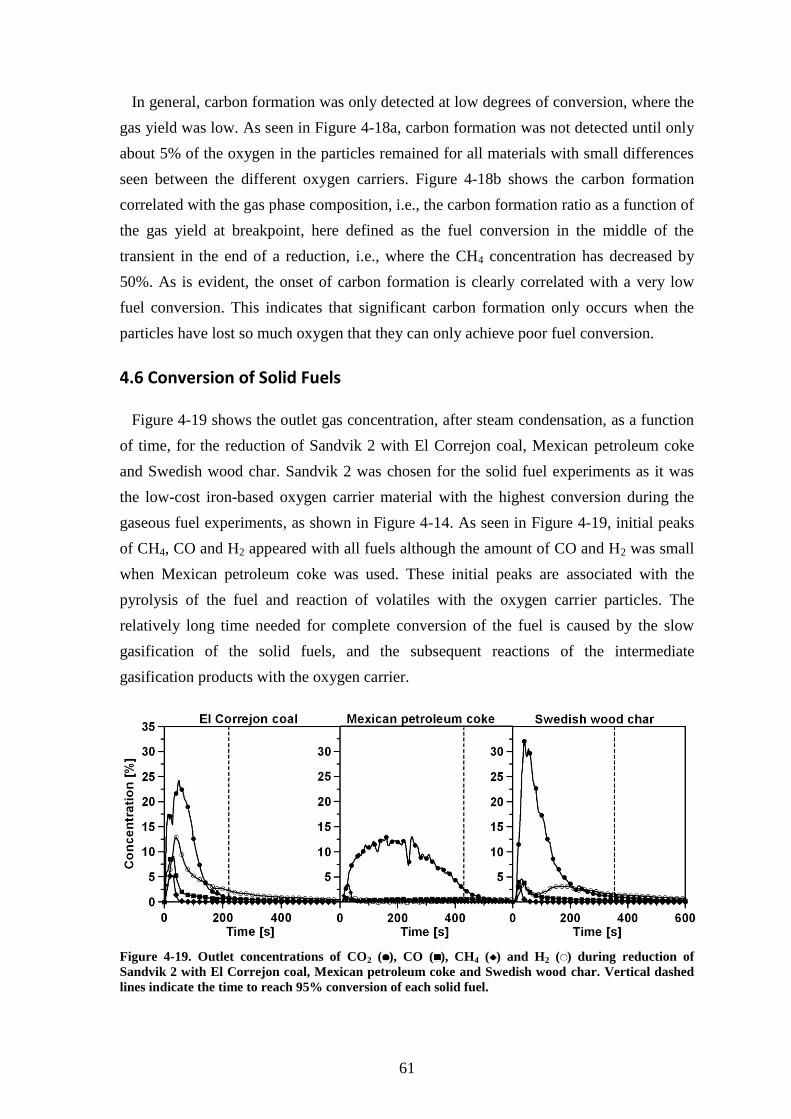
61
In general, carbon formation was only detected at low degrees of conversion, where the
gas yield was low. As seen in Figure 4-18a, carbon formation was not detected until only
about 5% of the oxygen in the particles remained for all materials with small differences
seen between the different oxygen carriers. Figure 4-18b shows the carbon formation
correlated with the gas phase composition, i.e., the carbon formation ratio as a function of
the gas yield at breakpoint, here defined as the fuel conversion in the middle of the
transient in the end of a reduction, i.e., where the CH4 concentration has decreased by
50%. As is evident, the onset of carbon formation is clearly correlated with a very low
fuel conversion. This indicates that significant carbon formation only occurs when the
particles have lost so much oxygen that they can only achieve poor fuel conversion.
4.6 Conversion of Solid Fuels
Figure 4-19 shows the outlet gas concentration, after steam condensation, as a function
of time, for the reduction of Sandvik 2 with El Correjon coal, Mexican petroleum coke
and Swedish wood char. Sandvik 2 was chosen for the solid fuel experiments as it was
the low-cost iron-based oxygen carrier material with the highest conversion during the
gaseous fuel experiments, as shown in Figure 4-14. As seen in Figure 4-19, initial peaks
of CH4, CO and H2 appeared with all fuels although the amount of CO and H2 was small
when Mexican petroleum coke was used. These initial peaks are associated with the
pyrolysis of the fuel and reaction of volatiles with the oxygen carrier particles. The
relatively long time needed for complete conversion of the fuel is caused by the slow
gasification of the solid fuels, and the subsequent reactions of the intermediate
gasification products with the oxygen carrier.
Figure 4-19. Outlet concentrations of CO2 ( ), CO ( ), CH4 ( ) and H2 ( ) during reduction of
Sandvik 2 with El Correjon coal, Mexican petroleum coke and Swedish wood char. Vertical dashed
lines indicate the time to reach 95% conversion of each solid fuel.

62
Table 4-3 displays the time needed to convert 95% of each fuel and the CO and H2
indices, as presented in equation (31) and (32). The conversion time is based on the
carbon containing gases detected in the analyzer; hence the losses of fuel during injection
are not included. The values with ilmenite as oxygen carrier are obtained from Leion et
al. [107] and included for comparison. However, as these experiments were performed
without on-line H2 measurements and only with Mexican Petroleum coke and Swedish
wood char as fuel, results from experiments by Azimi with El Correjon coal and for
calculating the H2,index for Swedish wood char have also been included [108].
Table 4-3. Time to reach 95% fuel conversion and CO and H2 indices for El Correjon coal, Mexican
petroleum coke and Swedish wood char with Sandvik 2 and Ilmenite as oxygen carriers.
Sandvik 2 Ilmenite
Time to convert 95%
of the fuel [min]
CO,index
[%]
H2,index
[%]
Time to convert 95%
of the fuel [min]
CO,index
[%]
H2,index
[%]
El Correjon coal 3.7 14 39 5.9* 21* 29*
Mexican petroleum coke 7.2 4.1 1.8 10.8 4.6 -
Swedish wood char 5.9 6.1 7.6 6.3 15 20*
*-values calculated from experiments by Azimi [108].
As shown in Table 4-3, the conversion of El correjon coal and Mexican petroleum coke
is significantly faster with Sandvik 2 than with ilmenite and the conversion of Swedish
wood char is slightly faster with the oxide scale from Sandvik as oxygen carrier. Further,
the amount of CO released is lower with Sandvik 2 as compared to with ilmenite as
oxygen carrier for all fuels. The amount of H2 released was higher with Sandvik 2 than
with ilmenite as oxygen carrier when El Correjon coal was used as fuel. However, with
Swedish wood char, the amount released with ilmenite was significantly higher than the
amount released with Sandvik 2. The reason why the H2,index was higher with Sandvik 2
than with ilmenite with El Correjon coal may be attributed to the very high fraction of
volatiles in this fuel. As the solid fuel conversion is faster with Sandvik 2, a large fraction
of the volatiles are released in the interval where the H2,index is calculated, hence this
index may be somewhat misleading for this fuel.

63
5
DISCUSSION
5.1 Ni-Based Oxygen Carriers
Oxygen carriers for gaseous fuel applications of chemical-looping combustion based on
commercially available NiO and α-Al2O3 are generally very promising, with high
reactivity for most materials independent of the supplier and sintering temperature. The
two most promising oxygen carriers from the screening of the freeze-granulated particles
were NOV1T1400 and NOV2T1400. These materials displayed excellent fluidization
behaviour in combination with comparatively high strength. The other materials with
good fluidization behaviour were rather soft, with a crushing strength below 1 N. Hence,
these materials may run an increased risk of fragmentation and attrition in a large-scale
circulating system. However, the harder particles that defluidized should not be entirely
excluded since the higher gas velocities and lower degree of reduction in a large-scale
application may improve their fluidization behaviour. Particles of lower strength may
also be suitable if a small amount of Ca(OH)2 is added. An addition of Ca(OH)2 during
particle preparation will most likely lead to the formation of the spinel CaAl2O4.
However, the amounts of Ca(OH)2 added in the present investigation were too small to
confirm the presence of this compound by X-ray analysis, although the assumption of
CaAl2O4 formation was supported by thermodynamic equilibrium calculations. Other
ways of improving the strength of the oxygen carriers is to increase the time and/or the
temperature during sintering of the particles.
Adding MgO to the raw material in the particle production phase will lead to the
formation of the spinel MgAl2O4. Using MgAl2O4 as supporting material, for nickel-
based oxygen carriers, has been shown to enhance the methane conversion compared to
using NiAl2O4 [85, 87, 102, 109]. This improvement in methane conversion has been
explained by the improved dispersion of active nickel, which increases the catalytic
performance when CH4 is partially oxidized to CO and H2 [72, 103]. The reason why Ni-
based oxygen carriers supported by MgAl2O4 display a lower gas yield at low degrees of
oxidation, compared to Ni-based oxygen carriers supported by NiAl2O4 is not well
known. However, it is believed to be caused by a decreased internal transport of oxygen

64
in the oxygen carriers supported by MgAl2O4. A decreased internal transport is assumed
to give a higher ratio of nickel on the surface of the oxygen carrier and hence an
increased catalytic effect in converting CH4. However, the decreased internal transport
seems to limit the conversion to CO2, which results in major CO formation for these
oxygen carriers at low degrees of oxidation. A possibilty may be to use a system of
mixed oxides, i.e., a combination of one oxygen carrier which has a good oxygen
transport capability and one oxygen carrier with good methane cracking capacity.
Linderholm et al. used a combination of NOV1T1450sd and S1T1400, the latter
containing MgO, in a continuous 10 kWth chemical-looping combustion reactor, and
found that this mixture resulted in higher methane conversion and gas yield in
comparison to using only NOV1T1450sd [57]. Shulman et al. concluded that most of
these particles maintained their structural integrity and chemical composition, after more
than 600 h of operation with the combination of NOV1T1450sd and S1T1400 and more
than 1000 h of total operation with NOV1T1450sd in the 10 kWth reactor [109]. The
improved fuel conversion, when mixing these oxygen carriers, has also been confirmed in
the fluidized bed batch reactor and in a continuous 300 Wth reactor system [106].
The Rate index was calculated as a normalized conversion rate, expressed in terms of
percentage mass change per minute and based on a few general assumptions. Because the
Rate index is not based on detailed kinetics, it should be regarded as an indicative number
used to compare different oxygen carriers and to estimate a needed mass of solids and not
as a definite value to determine the solids inventory in a chemical-looping combustion
unit. The high rate indices obtained here correspond to the mass of solids in the fuel
reactor of less than 10 kg/MW, which is consistent with the fact that up to 95%
conversion is attained in the 1 g tests, i.e., with a bed mass of 4 kg/MW.
The oxygen carrier NOV1T1450sd showed a gas yield of roughly 80-90% independent
of the temperature in most of the solids conversion range and calculations in Paper V
show that somewhere between 10-20 kg/MW bed material or less should be sufficient for
full yield of methane depending upon reaction order and source of kinetic data, i.e., TGA
or fluidized bed. This is similar to the bed masses found when utilizing the Rate index for
calculating the necessary bed masses. For the fluidized bed experiments employing a 30 g
bed, or 57 kg/MW of the NOV1T1450sd material there is close to complete conversion
of the methane for most degrees of solid conversion, as seen in Figure 4-10.
With respect to the 10 kWth circulating reactor, the mass of particles in the fuel reactor
is 5 kg, corresponding to 500 kg/MW with a fuel conversion of 96-98%. In the 120 kWth
circulating unit in Vienna, a mass corresponding to 133 kg/MW was used in the fuel

65
reactor, and a gas conversion of 89% was reached. It is obvious that considering kinetics
both from the fluidized bed and the TGA, the fuel conversion should be complete for
both the 10 kWth and 120 kWth units. The reason for the discrepancy is likely that the gas
and solid flows in the circulating units differ considerably from the assumptions used in
the model of plug flow and no consideration of mass transfer resistance between the
dilute and dense phases of a fluidized bed.
There were clear defluidization tendencies for some materials in the batch reactor,
predominantly for oxygen carriers with high density, sintered at high temperatures.
Defluidization of the oxygen carriers always came about late in a reduction period or
early in a subsequent inert period, when the oxygen carriers were highly reduced, thus the
risk of defluidization could be decreased by terminating the reduction period before the
oxygen carriers were fully reduced. Kuusik et al. have found that defluidization for
NOV1T1450sd is caused by adhesion of particles by bridges containing pure Ni [82], a
result which is supported by the findings here. It should be pointed out that although
many oxygen carriers defluidized in these experiments, it does not necessarily mean they
will defluidize in a large-scale circulating chemical-looping combustion unit. The reason
for this is that the gas velocities are higher and the oxygen carrier reduction is never
complete in such a unit, since this would cause a major decrease in fuel reactor
temperature, as shown in Paper I.
5.2 Fe-Based Oxygen Carriers
Iron-based materials are highly promising for applications of chemical-looping
combustion with solid fuels. The main reasons are their low price, rich abundance and
low environmental impact.
For Fe-based oxygen carriers, H2 is converted to a higher degree than CO. This higher
reactivity with H2 at atmospheric pressure has also been observed in TGA experiments at
950°C for Fe-based oxygen carriers [104, 105] and for ilmenite [61].
All iron-based materials displayed an unstable gas conversion as a function of cycle.
Generally, the materials were gradually activated as the number of reductions and
oxidations increased. This activation is believed to be attributed to a changed surface
texture and an increased porosity of the oxygen carriers as they undergo reduction and
oxidation reactions. As determined from SEM-images, fresh Fe-based materials are
generally comparatively massive, with sharp-edged surfaces for unprocessed particles.
However, after reactivity experiments, cracks and a more porous and granular surface
structure is generally observed. This is believed to improve the gas-solid contact, and

66
hence increase the reaction surface. An increase in reactivity, in combination with a
change in surface texture, has been reported both for an iron ore [88] and for a natural
ilmenite [60]. Adánez et al. have shown that the number of cycles needed to reach stable
conversion of ilmenite clearly correlates with the degree of oxygen carrier conversion
[61]. With a higher oxygen carrier conversion, a lower number of cycles are needed to
activate ilmenite. This explains the higher gas conversion of ilmenite when tested at
longer reduction times, as shown in Figure 4-14, as compared to the conversion in Figure
4-13 where the mass-based conversion of ilmenite is significantly lower. The fact that
natural minerals and industrial iron-based by-products change in physical properties and
reactivity during testing is likely associated with the absence of a supporting material,
which is generally used in manufactured oxygen carriers. Therefore, these materials need
to be tested during longer times and under circulating conditions to investigate their
durability.
When comparing the synthetic ilmenites, it appears as if materials containing more Fe
are more capable of converting CO at lower degrees of oxygen carrier conversion.
However, the initial conversion seems to be independent of the Fe:Ti ratio. The
conversion with the natural Norwegian ilmenite is comparable with the synthetic
ilmenites with a similar Fe:Ti ratio. This fact motivates the use of Norwegian ilmenite for
further work in chemical-looping combustion utilizing solid fuels. However, ilmenite
displayed lower conversion than all unprocessed low-cost Fe-based oxygen carriers
which also motivates further efforts in investigating such materials. EDX-analysis
indicated that the amount of Fe was significantly higher than the amount of Ti on the
surface of the ilmenite particles after reactivity experiments. This phenomenon was
clearly seen by Adánez et al. who detected formation of an external shell of free hematite,
Fe2O3, on ilmenite particles during reactivity experiments and an internal core containing
mainly rutile, TiO2 [61]. Hence, the lower conversion of ilmenite, as compared to
materials containing mainly Fe2O3/Fe3O4, may be attributed to this separation of Fe2O3
and TiO2. The separation decreases the amount of active material as TiO2 is not
contributing to the fuel conversion.
In previous work, it has been shown that gasification of solid fuels with steam is
significantly faster in a bed of Fe-based oxygen carriers or ilmenite, as compared to a bed
of inert quartz [43]. This is believed to be a result of the fast reaction between the oxygen
carrier and the gasification products, mainly CO and H2. The presence of H2 during
gasification of solid fuels with steam is well known to inhibit the reaction rate [110, 111].
This inhibiting effect of H2 has also been shown to strongly affect the conversion of char
in a laboratory-scale fluidized bed reactor with the presence of oxygen carrier particles

67
fluidized by steam [112]. Here, the direct inhibiting effect of CO on steam gasification
was insignificant. The H2 inhibition is also believed to explain the faster conversion of
solid fuels with the oxide scale Sandvik 2, as compared to ilmenite. Since the conversion
of H2 was found to be higher with the oxide scale, the removal of hydrogen from the bed
was more efficient. Therefore, the hydrogen inhibition on the gasification process was
decreased and the overall fuel conversion increased.

68

69
6
CONCLUSIONS
In order for chemical-looping combustion to be viable for use in a power plant, the
oxygen-carrier raw materials need to be accessible at a reasonable cost and the oxygen
carriers need to be produced by a method suitable for large-scale production. Thus, one
important purpose of this work was to investigate the use of commercially available raw
materials and the use of a particle production methodology suitable for large-scale
production of Ni-based oxygen carriers. The following points summarize the main
findings of the investigation of the resulting Ni-based oxygen carriers:
Commercially available raw materials can be used to produce high performing
oxygen carriers for chemical-looping combustion of gaseous fuels.
Spray-drying, a method suitable for large-scale oxygen-carrier production, can be
used to produce the Ni-based oxygen carriers.
Up-scaling of the particle production should not present any difficulties.
To reduce the risk of fragmentation and attrition of the oxygen carriers, the strength
can be improved by an addition of Ca(OH)2 during preparation, by increasing the
sintering time or by extending the sintering time.
Using MgAl2O4 as supporting agent results in a considerably improved fuel
conversion for highly oxidized oxygen carriers when compared to using NiAl2O4.
However, oxygen carriers with MgAl2O4 in the support material display low
conversion to CO2 at low degrees of oxygen carrier oxidation.
Carbon formation is only detected when the oxygen carriers are highly reduced and
the fuel conversion is low. The implication of this is that carbon formation should not
be expected in a circulating system, where the fuel conversion is high and the
particles are recycled to the air reactor well before they are fully reduced.

70
Defluidization is most likely to occur for highly reduced particles, i.e., at conditions
not expected in a large-scale application.
The particles produced have high reactivity, and for an ideal reactor without gas
solid-phase mass transfer limitations, full conversion should be reached with a solids
inventory in the fuel reactor less than 10-20 kg/MW. In practice, however, much
higher inventories would be needed, highly dependent on the fluidization conditions.
When adapting chemical-looping combustion to convert solid fuels, the lifetime of the
oxygen carriers is expected to be shorter than with gaseous fuels. Fe-based oxygen
carriers are comparatively cheap, abundant and environmentally sound and therefore well
suited in solid fuel applications. For this reason a number of low cost ores and by-
products or waste materials from industry have been investigated. Moreover, to achieve a
better understanding of the low-cost ore ilmenite, FeTiO3, synthetic ilmenite with varying
Fe:Ti ratios was produced and studied. The following points summarize the main
findings of the study of these Fe-based oxygen carriers:
Several materials, including an iron-ore and oxide scales from the steel industry,
display a high conversion of syngas, the main intermediate when solid fuels are
gasified by steam, in combination with a high mechanical strength.
The syngas conversion with Norwegian ilmenite ore, FeTiO3 in its reduced form, is
almost as good as with synthetically produced ilmenite.
An increased Fe:Ti ratio in synthetically produced ilmenite generally improves the
total conversion of CO although the initial maximum conversion is practically
unchanged.
When compared with natural Norwegian ilmenite, all investigated low-cost Fe-based
materials display a higher CO conversion and generally also a higher particle
strength. Sandvik 2, an oxide scale from the steel industry, displays the highest
conversion.
The conversion rate of solid fuels is higher with Sandvik 2 than with the reference
sample, Norwegian ilmenite. A reason is likely the higher conversion of H2, which
reduces the inhibitory effect of H2 on char gasification.

71
7
ACKNOWLEDGEMENT
I wish to express my sincere gratitude to my supervisors, Professor Anders Lyngfelt
and Associate Professor Tobias Mattisson, for giving me the opportunity to work in a
highly interesting field and for all guidance, support and help with understanding and
solving both experimental and theoretical problems along the way.
I am very grateful to Professor Oliver Lindqvist for providing me with the opportunity
to perform my research at Environmental Inorganic Chemistry.
I am also deeply thankful to all past and present members of the ―CLC group‖, Henrik
Leion and Marcus Johansson for helping me out when this was all new to me and for all
valuable discussions and Carl Linderholm for excellent collaboration along the way.
A special thank you should also be directed to Muhammad Mufti Azis and all other
students choosing to complete their education with us, it has been truly inspiring.
I am also grateful to Roger Sagdahl, Esa Väänänen and Charlotte Bouveng for all help
concerning technical and administrative aspects around my research.
Furthermore, I would like to express gratitude to all colleagues at the Division of
Environmental Inorganic Chemistry and the Division of Energy Technology for creating
a friendly and inspiring working environment.
I would also like to thank the financers of this work, performed in the EU-project
―Chemical Looping Combustion CO2-Ready Gas Power‖, (CLC Gas Power, EU contract:
019800) and the ―Emission free Chemical-Looping Coal Combustion Process‖
(ECLAIR) project (contract RFCP-CT-2008-00008).
Finally, I wish to thank my family and friends for being there by my side!

72

73
8
REFERENCES
1 Hoffert, M.I., Caldeira, K. Climate Change and Energy, Overview. Encyclopedia of Energy,
2004, 1, 359-380.
2 IPCC. Historical Overview of Climate Change. The Physical Science Basis. Contribution of
Working Group I to the Fourth Assessment Report of the Intergovernmental Panel on Climate
Change. 2007.
3 Marriotte, E. Traite De la Nature des Couleurs. Ouvres de M. Mariotte, 2nd Ed., 1681, 2.
4 Fourier, J. Remarques Générales sur les Températures du Globe Terrestre et des Espaces
Planétaires. Annales de Chemie et de Physique, 1824, 27, 136-167.
5 Weart, S. The Discovery of Global Warming. Harvard University Press, Cambridge, MA, 240 pp,
2003.
6 Tyndall, J. On the Absorption and Radiation of Heat by Gases and Vapours, and on the Physical
Connection. Philos. Mag., 1861 22, 277–302.
7 Arrhenius, S. On the Influence of Carbonic Acid in the Air upon the Temperature on the Ground.
Philos. Mag., 1896, 41, 237-276.
8 IPCC. Climate Change. Cambridge University Press, 2007.
9 Kiehl, J.T., Trenberth, K.E. Earth’s Annual Global Mean Energy Budget. Bull. Am. Meteorol.
Soc., 1997, 78, 197–208.
10 IPCC. Summary for Policymakers. Mitigation. Contribution of Working Group III to the Fourth
Assessment Report of the Intergovernmental Panel on Climate Change. 2007.
11 Petit, J.R., Jouzel, J., Raynaud, D., Barkov, N.I., Barnola, J.M., Basile, I., Bender, M.,
Chappelaz, J., Davis, M., Delaygne, G., Delmotte, M., Kotlyakov, V.M., Legrand, M.,
Lipenkov, V.Y., Lorius, C., Pépin, L., Ritz, C., Saltzman, E., Stievenard, M. Climate and
Atmospheric History of the Past 420,000 Years from the Vostok Ice-Core Antarctica. Nature,
1999, 399(6735), 426-436.
12 IPCC. Changes in Atmospheric Constituents and in Radiative Forcing. Climate Change: The
Physical Science Basis. Contribution of Working Group I to the Fourth Assessment Report of the
Intergovernmental Panel on Climate Change. 2007.
13 U.S. Department of Commerce, National Oceanic and Atmospheric Administration, Earth
System Research Laboratory, Global Monitoring Division.
Available from: www.esrl.noaa.gov/gmd/infodata/faq_cat-3.html, 2008.
14 IEA. Key World Energy Statistics. 2006.
15 Rosenzweig, C., Karoly, D., Vicarelli, M., Neofotis, P., Wu, Q., Cassana, G., Menzel, A.,
Root, T.L., Estrella, N., Seguin, B., Tryjanowski, P., Liu, C., Rawlins, S., Imeson, A. Attributing Physical and Biological Impacts to Anthropogenic Climate Change. Nature, 2008,
453(15), 353-357.
16 Rodhe, R.A. from data compiled by The NASA Goddard Institute for Space Studies. Available
from: www.globalwarmingart.com/wiki/Temperature_Gallery. 2008.
17 IPCC. Special Report on Carbon Dioxide Capture and Storage. 2005.
18 Herzog, H.J., Eliasson, B., Kaarstad, O. Capturing Greenhouse Gases. Scientific American,
2000, 282 (2), 72–79.
19 Benson, S.M., Surles, T. Carbon Dioxide Capture and Storage: an Overview with Emphasis on
Capture and Storage in Deep Geological Formations. Proceedings of the IEEE, 2006, 94(10),
1795-1805.
20 Abu-Khader, M. Recent Progress in CO2 Capture/Sequestration: A Review. Energy Sources,
Part A: Recovery, Utilization and Environmental Effects, 2006, 28(14), 1261-1279.
21 IEA. Putting Carbon Back Into the Ground. International Energy Agency Greenhouse Gas R&D
Program, 2001.

74
22 Möllersten, K., Yan, J., Moreira, J.R. Promising Market Niches for Biomass Energy with CO2
Removal and Disposal - Opportunities for Energy Supply with Negative CO2 Emissions. Biomass
and Bioenergy, 2003, 25, 273–285.
23 Azar, C., Lindgren, K., Larson, E., Möllersten, K. Carbon Capture and Storage from Fossil
Fuels and Biomass - Costs and Potential Role in Stabilizing the Atmosphere. Climatic Change,
2006, 74(1-3), 47-79.
24 Herzog, H., Golomb, D. Carbon Capture and Storage from Fossil Fuel Use. Encyclopedia of
Energy, 2004, 277-287.
25 Lackner, K.S., Wendt, C.H., Butt, D.P., Joyce, E.L., Sharp, D.H. Carbon Dioxide Disposal in
Carbonate Minerals. Energy, 1995, 20(11), 1153-1170.
26 Smith, A.R., Klosek, J. A Review of Air Separation Technologies and their Integration with
Energy Conversion Processes. Fuel Process Technology, 2001, 70, 115–134.
27 Ishida, M., Jin, H. A Novel Chemical-Looping Combustor without NOx Formation. Industrial &
Engineering Chemistry Research, 1996, 35(7), 2469-2472.
28 Lewis, W.K., Gilliland, E.R. Production of Pure Carbon Dioxide. U.S. Patent no: 2665972, 1954.
29 Richter, H.J., Knoche, K.F. Reversibility of Combustion Processes, Efficiency and Costing,
Second Law Analysis of Processes. ACS Symposium Series 235, Washington DC, 1983, 71-85.
30 Ishida, M., Jin, H. A New Advanced Power-Generation System using Chemical-Looping
Combustion. Energy (Oxford, United Kingdom), 1994, 19(4), 415-422.
31 Lyngfelt, A., Leckner, B., Mattisson, T. A Fluidized-Bed Combustion Process with Inherent
CO2 Separation; Application of Chemical-Looping Combustion. Chemical Engineering Science,
2001, 56(10), 3101-3113.
32 Kunii, D., Levenspiel, O. Fluidization Engineering. Butterworth-Heinman, 1991.
33 Kolbitsch, P., Pröll, T., Bolhar-Nodenkampf, J., Hofbauer, H. Design of a Chemical Looping
Combustor using a Dual Circulating Fluidized Bed Reactor System. Chemical Engineering &
Technology, 2009, 32(3), 398-403.
34 Anheden, M. Analysis of Gas Turbine Systems for Sustainable Energy Conversion. PhD Thesis,
Royal Institute of Technology, Stockholm, Sweden, 2000.
35 Wolf, J. CO2 Mitigation in Advanced Power Cycles. PhD Thesis, Royal Institute of Technology,
Stockholm, Sweden, 2004.
36 Brandvoll, Ø. Chemical Looping Combustion: Fuel Conversion with Inherent Carbon Dioxide
Capture. PhD thesis, Norwegian University of Science and Technology, Trondheim, Norway,
2005.
37 Naqvi, R. Analysis of Natural Gas-fired Power Cycles with Chemical Looping Combustion for
CO2 Capture. PhD thesis, Norwegian University of Science and Technology, Trondheim, Norway,
2006.
38 IEA. Key World Energy Statistics. 2009.
39 Cao, Y., Cheng, Z., Meng, L., Riley, J.T., Pan, W.-P. Reduction of Solid Oxygen Carrier (CuO)
by Solid Fuel (Coal) in Chemical Looping Combustion. Preprints of Symposia - American
Chemical Society, Division of Fuel Chemistry, 2005, 50(1), 99-102.
40 Dennis, J.S., Scott, S. A., Hayhurst, A. N. In Situ Gasification of Coal using Steam with
Chemical Looping: A Technique for Isolating CO2 from Burning a Solid Fuel. Journal of the
Energy Institute, 2006, 79(3), 187-190.
41 Mattisson, T., Johansson, M., Lyngfelt, A. CO2 Capture from Coal Combustion using Chemical-
Looping Combustion - Reactivity investigation of Fe, Ni and Mn based Oxygen Carriers using
Syngas. Clearwater Coal Conference, Clearwater, FL, 2006.
42 Mattisson, T., Lyngfelt, A. Leion, H. Chemical-Looping with Oxygen Uncoupling for
Combustion of Solid Fuels. International Journal of Greenhouse Gas Control, 2009, 3(1), 11-19.
43 Leion, H., Mattisson, T. and Lyngfelt, A. Solid Fuels in Chemical-Looping Combustion.
International Journal of Greenhouse Gas Control, 2008, 2, 180-193.
44 Berguerand, N., Lyngfelt, A. The Use of Petroleum Coke as Fuel in a 10 kWth Chemical-
Looping Combustor. International Journal of Greenhouse Gas Control, 2008, 2(2), 169-179.
45 Lyngfelt, A., Johansson, M., Mattisson, T. Chemical-Looping Combustion - Status of
Development. 9th International Conference on Circulating Fluidized Beds May 13 -16, Hamburg,
Germany, 2008.
46 Mattisson, T., Lyngfelt, A. Capture of CO2 using Chemical-Looping Combustion. First Biennial
Meeting of The Scandinavian-Nordic Section of the Combustion Institute, Göteborg, April 18-20,
2001, 163-168
47 Adanez, J., de Diego, L.F., Garcia-Labiano, F., Gayan, P., Abad, A., Palacios, J.M. Selection
of Oxygen Carriers for Chemical-Looping Combustion. Energy & Fuels, 2004, 18(2), 371-377.

75
48 Ishida, M., Jin, H. A Novel Combustor Based on Chemical-Looping Reactions and its Reaction
Kinetics. Journal of Chemical Engineering of Japan, 1994, 27(3), 296-301.
49 Johansson, M. Screening of Oxygen-Carrier Particles based on Iron-, Manganese-, Copper- and
Nickel Oxides for use in Chemical-Looping Technologies. PhD Thesis, Dept. of Chemical and
Biological Engineering, Environmental Inorganic Chemistry, Chalmers University of Technology,
Göteborg, Sweden, 2007.
50 Johansson, E., Mattisson, T., Lyngfelt, A., Thunman, H. A 300 W Laboratory Reactor System
for Chemical-Looping Combustion with Particle Circulation. Fuel, 2006, 85(10-11), 1428-1438.
51 Lyngfelt, A., Thunman, H. Construction and 100 h of Operational Experience of a 10-kW
Chemical-Looping Combustor. Carbon Dioxide Capture for Storage in Deep Geologic
Formations-Results from the CO2 Capture Project. 2005, 1, 625-645.
52 de Diego, L.F., Garcia-Labiano, F., Gayan, P., Celaya, J., Palacios, J.M., Adanez, J. Operation of a 10 kWth Chemical-Looping Combustor during 200h with a CuO-Al2O3 Oxygen
Carrier. Fuel, 2007, 86(7-8), 1036-1045.
53 Ryu, H.-J., Jin, G.-T., Bae, D.-H., Yi, C.-K. Continuous Operation of a 50 kWth Chemical-
Looping Combustor: Long-Term Operation with Ni- and Co-Based Oxygen Carrier Particles.
Presented at the 5th China-Korea Joint Workshop on Clean Energy Technology, October 25-28,
Qingdao University, China, 2004, 221-230.
54 Kolbitsch, P., Pröll, T., Bolhar-Nordenkampf, J. and Hofbauer, H. Operating Experience with
Chemical Looping Combustion in a 120kW Dual Circulating Fluidized Bed (DCFB) Unit. Energy
Procedia, 2009, 1(1), 1465-1472.
55 Berguerand, N. and Lyngfelt, A. Design and Operation of a 10 kWth Chemical-Looping
Combustor for Solid Fuels – Testing with South African Coal. Fuel, 2008, 87(12), 2713-2726.
56 Shen, L., Wu, J., Xiao, J., Song, Q., Xiao, R. Chemical-Looping Combustion of Biomass in a 10
kWth Reactor with Iron Oxide as an Oxygen Carrier. Energy & Fuels, 2009, 23(5), 2498-2505.
57 Linderholm, C., Mattisson, T., Lyngfelt, A. Long-Term Integrity Testing of Spray-Dried
Particles in a 10 kW Chemical-Looping Combustor using Natural Gas as Fuel. Fuel, 2009, 88(11),
2083-2096.
58 Lyngfelt, A. Oxygen Carriers for Chemical-Looping Combustion – 4000 h of Operational
Experience. Submitted to Oil & Gas Science and Technology – Revue de l'IFP. To be published in
a Special Issue: 1st International Conference on Chemical Looping, 2010.
59 Song, Q., Xiao, R., Deng, Z., Zhang, H., Shen, L., Xiao, J., Zhang, M. Chemical-Looping
Combustion of Methane with CaSO4 Oxygen Carrier in a Fixed Bed Reactor. Energy Conversion
and Management, 2008, 49(11), 3178-3187.
60 Leion, H., Lyngfelt, A., Johansson, M., Jerndal, E. and Mattisson, T. The Use of Ilmenite as
an Oxygen Carrier in Chemical-Looping Combustion. Chemical Engineering Research and
Design, 2008, 86(9), 1017-1026.
61 Adanez, J., Cuadrat, A., Abad, A., Gayan, P., de Diego, L.F. Ilmenite Activation during
Consecutive Redox Cycles in Chemical-Looping Combustion. Energy & Fuels, 2010, 24(2),
1402-1413.
62 Leion, H., Larring, Y., Bakken, E., Bredesen, R., Mattisson, T., Lyngfelt A. Use of
CaMn0.875Ti0.125O3 as Oxygen Carrier in Chemical-Looping with Oxygen Uncoupling. Energy &
Fuels, 2009, 23(10), 5276-5283.
63 Rydén, M., Lyngfelt, A., Mattisson, T. CaMn0.875Ti0.125O3 as Oxygen Carrier for Chemical-
Looping Combustion with Oxygen Uncoupling (CLOU)—Experiments in a Continuously
Operating Fluidized-Bed Reactor System. International Journal of Greenhouse Gas Control, In
Press, Available online 31 August 2010.
64 Shulman, A., Cleverstam, E., Mattisson, T., Lyngfelt, A. Manganese/Iron, Manganese/Nickel
and Manganese/Silicon Oxides Used in Chemical-Looping With Oxygen Uncoupling (CLOU) for
Combustion of Methane. Energy & Fuels, 2009, 23(10), 5269-5275.
65 Cho, P., Mattisson, T., Lyngfelt, A. Comparison of Iron-, Nickel-, Copper- and Manganese-
Based Oxygen Carriers for Chemical-Looping Combustion. Fuel, 2004, 83(9), 1215-1225.
66 de Diego, L.F., Gayan, P., Garcia-Labiano, F., Celaya, J., Abad, A., Adanez, J. Impregnated
CuO/Al2O3 Oxygen Carriers for Chemical-Looping Combustion: Avoiding Fluidized Bed
Agglomeration. Energy & Fuels, 2005, 19(5), 1850-1856.
67 Adanez, J., Gayan, P., Celaya, J., de Diego, L.F., Garcia-Labiano, F., Abad, A. Chemical
Looping Combustion in a 10 kWth Prototype Using a CuO/Al2O3 Oxygen Carrier: Effect of
Operating Conditions on Methane Combustion. Industrial & Engineering Chemistry Research,
2006, 45(17), 6075-6080.

76
68 Hossain, M.M., de Lasa, H.I. Chemical-Looping Combustion (CLC) for Inherent CO2 separation
– A Review. Chemical Engineering Science, 2008, 63(18), 4433-4451.
69 Johansson, M., Mattisson, T. and Lyngfelt, A. Comparison of Oxygen Carriers for Chemical-
Looping Combustion. Thermal Science, 2006, 10(3), 93-107.
70 Garcia-Labiano, F., De Diego, L.F., Adanez, J., Abad, A. and Gayan, P. Reduction and
Oxidation Kinetics of a Copper-Based Oxygen Carrier Prepared by Impregnation for Chemical-
Looping Combustion. Industrial & Engineering Chemistry Research, 2004, 43(26), 8168-8177.
71 de Diego, L.F., Garcia-Labiano, F., Adanez, J., Gayan, P., Abad, A., Corbella, B.M. and
Palacios, J.M. Development of Cu-Based Oxygen Carriers for Chemical-Looping Combustion.
Fuel, 2004, 83(13), 1749-1757.
72 Villa, R., Cristiani, C., Groppi, G., Lietti, L., Forzatti, P., Cornaro, U. and Rossini, S. Ni
Based Mixed Oxide Materials for CH4 Oxidation under Redox Cycle Conditions. Journal Of
Molecular Catalysis A: Chemical, 2003, 204-205, 637-646.
73 Ishida, M., Yamamoto, M., Ohba, T. Experimental Results of Chemical-Looping Combustion
with NiO/NiAl2O4 Particle Circulation at 1200°C. Energy Conversion and Management, 2002,
43(9-12), 1469-1478.
74 Linderholm, C., Abad, A., Mattisson, T., Lyngfelt, A. 160 Hours of Chemical-Looping
Combustion in a 10 kW Reactor System with a NiO-Based Oxygen Carrier. International Journal
of Greenhouse Gas Control, 2008, 2(4), 520-530.
75 Johansson, M., Mattisson, T., Lyngfelt, A. Comparison of Oxygen Carriers for Chemical-
Looping Combustion of Methane-Rich Fuels. 19th FBC Conference, May 21-24, Vienna, 2006.
76 Abad, A., Adanez, J., Garcia-Labiano, F., de Diego, L.F., Gayan, P., Celaya, J. Mapping of
the Range of Operational Conditions for Cu-, Fe-, and Ni-Based Oxygen Carriers in Chemical-
Looping Combustion. Chemical Engineering Science, 2007, 62(1-2), 533-549.
77 Ishida, M., Jin, H., Okamoto, T. Kinetic Behavior of Solid Particle in Chemical-Looping
Combustion: Suppressing Carbon Deposition in Reduction. Energy & Fuels, 1998, 12(2), 223-
229.
78 Jin, H., Okamoto, T., Ishida, M. Development of a Novel Chemical-Looping Combustion:
Synthesis of a Solid Looping Material of NiO/NiAl2O4. Industrial & Engineering Chemistry
Research, 1999, 38(1), 126-132.
79 Readman, J.E., Olafsen, A., Smith, J.B., Blom, R. Chemical Looping Combustion Using
NiO/NiAl2O4: Mechanisms and Kinetics of Reduction-Oxidation (Red-Ox) Reactions from In Situ
Powder X-ray Diffraction and Thermogravimetry Experiments. Energy & Fuels, 2006, 20(4),
1382-1387.
80 Jin, H., Ishida, M. A New Type of Coal Gas Fueled Chemical-Looping Combustion. Fuel, 2004,
83(17-18), 2411-2417.
81 Johansson, M., Mattisson, T., Lyngfelt, A. Use of NiO/NiAl2O4 Particles in a 10 kW Chemical-
Looping Combustor. Industrial & Engineering Chemistry Research, 2006, 45(17), 5911-5919.
82 Kuusik, R., Trikkel, A., Lyngfelt, A., Mattisson, T. High Temperature Behavior of NiO-Based
Oxygen Carriers for Chemical Looping Combustion. 9th International Conference on Greenhouse
Gas Control Technologies, Washington D.C., November 16-20, 2008.
83 Gayan, P., de Diego, L.F., Garcia-Labiano F., Adanez, J., Abad, A., Dueso C. Effect of
Support on Reactivity and Selectivity of Ni-based Oxygen Carriers for Chemical-Looping
Combustion. Fuel, 2008, 87(12), 2641-2650.
84 Mattisson, T., Johansson, M., Jerndal, E., Lyngfelt, A. The Reaction of NiO/NiAl2O4 Particles
with Alternating Methane and Oxygen. Canadian Journal of Chemical Engineering, 2008, 86(4),
756-767.
85 Johansson, M., Mattisson, T., Lyngfelt, A., Abad, A. Using Continuous and Pulse Experiments
to Compare two Promising Nickel-Based Oxygen Carriers for use in Chemical-Looping
Technologies. Fuel, 2008, 87(6), 988-1001.
86 Rydén, M., Lyngfelt, A., Mattisson, T. Synthesis Gas Generation by Chemical-Looping
Reforming in a Continuously Operating Laboratory Reactor. Fuel, 2006, 85(12-13), 1631-1641.
87 Johansson, E., Mattisson, T., Lyngfelt, A., Thunman, H. Combustion of Syngas and Natural
Gas in a 300 W Chemical-Looping Combustor. Chemical Engineering Research and Design,
2006, 84(A9), 819-827.
88 Mattisson, T., Lyngfelt, A. and Cho, P. The Use of Iron Oxide as an Oxygen Carrier in
Chemical-Looping Combustion of Methane with Inherent Separation of CO2. Fuel, 2001, 80(13),
1953-1962.

77
89 Xiao, R., Song, Q., Zhang, S., Zheng, W., Yang, Y. Pressurized Chemical-Looping Combustion
of Chinese Bituminous Coal: Cyclic Performance and Characterization of Iron Ore-Based Oxygen
Carrier. Energy & Fuels, 2010, 24(2), 1449-1463.
90 Abad, A., Mattisson, T., Lyngfelt, A., Johansson, M. The Use of Iron Oxide as Oxygen Carrier
in a Chemical-Looping Reactor. Fuel, 2007, 86(7-8), 1021-1035.
91 Leion, H., Mattisson, T. and Lyngfelt, A. Use of Ores and Industrial Products As Oxygen
Carriers in Chemical-Looping Combustion. Energy & Fuels, 2009, 23(4), 2307-2315.
92 He, F., Wang, H., Dai, Y. Application of Fe2O3/Al2O3 Composite Particles as Oxygen Carrier of
Chemical Looping Combustion. Journal of Natural Gas Chemistry, 2007, 16(2), 155-161.
93 Xiao, R., Song, Q., Song, M., Lu, Z., Zhang, S., Shen, L. Pressurized Chemical-Looping
Combustion of Coal with an Iron Ore-Based Oxygen Carrier. Combustion and Flame, 2010,
157(6), 1140-1153.
94 Leion, H., Jerndal, E., Steenari, B.-M., Hermansson, S., Israelsson, M., Jansson, E.,
Johnsson, M., Thunberg, R., Vadenbo, A., Mattisson, T. and Lyngfelt, A. Solid Fuels in
Chemical-Looping Combustion using Oxide Scale and Unprocessed Iron Ore as Oxygen Carriers.
Fuel, 2009, 88(10), 1945-1954.
95 Moldenhauer, P. Testing of Minerals and Industrial By-Products as Oxygen Carriers for
Chemical-Looping Combustion in a 300 W Test Reactor. MSc Thesis, Chalmers University of
Technology, T2009-325, 2009.
96 Cho, P., Mattisson, T., Lyngfelt, A. Carbon Formation on Nickel and Iron Oxide-Containing
Oxygen Carriers for Chemical-Looping Combustion. Industrial & Engineering Chemistry
Research, 2005, 44(4), 668-676.
97 Vehring, R., Foss, W.R., Lechuga-Ballesteros, D. Particle Formation in Spray Drying. Journal
of Aerosol Science, 2007, 38(7), 728-746.
98 Bemrose, C.R., Bridgwater, J. A Review of Attrition and Attrition Test Methods. Powder
Technology, 1987, 49(2), 97-126.
99 Levenspiel, O. Chemical Reaction Engineering. (New York: John Willey and Sons, 1981).
100 Cho, P. Development and Characterisation of Oxygen-Carrier Materials for Chemical-Looping
Combustion. PhD Thesis, Dept. of Chemical and Biological Engineering, Environmental
Inorganic Chemistry, Chalmers University of Technology, Göteborg, Sweden, 2005.
101 Mattisson, T., Johansson, M., Lyngfelt, A. Multicycle Reduction and Oxidation of Different
Types of Iron Oxide Particles-Application to Chemical-Looping Combustion. Energy & Fuels,
2004, 18(3), 628-637.
102 Mattisson, T., Johansson, M., Lyngfelt, A. The Use of NiO as an Oxygen Carrier in Chemical-
Looping Combustion. Fuel, 2006, 85(5-6), 736-747.
103 Qiu, Y.-J., Chen, J.-X., Zhang, J.-Y. Effects of MgO Promoter on Properties of Ni/Al2O3
Catalysts for Partial Oxidation of Methane to Syngas. Journal of Fuel Chemistry and Technology,
2006, 34(4), 450-455.
104 Mattisson, T., García-Labiano, F., Kronberger, B., Lyngfelt, A., Adánez, J., Hofbauer, H. Chemical-Looping Combustion using Syngas as Fuel. International Journal of Greenhouse Gas
Control, 2007, 1(2), 158-169.
105 Abad, A., Garcia-Labiano, F., de Diego, L. F., Gayan, P., Adanez, J. Reduction Kinetics of
Cu-, Ni-, and Fe-Based Oxygen Carriers Using Syngas (CO + H2) for Chemical-Looping
Combustion. Energy & Fuels, 2007, 21(4), 1853-2843.
106 Linderholm, C., Jerndal E., Mattisson, T., Lyngfelt, A. Investigation of Ni-Based Mixed
Oxides in a 300 W Chemical-Looping Combustor. Chemical Engineering Research and Design,
2010, 88(5-6), 661-672.
107 Leion, H., Mattisson, T., Lyngfelt, A. CO2 Capture from Direct Combustion of Solid Fuels with
Chemical-Looping Combustion. Proceedings of the 33rd International Technical Conference on
Coal Utilization & Fuel Systems, 2008, 1, 221-232.
108 Azimi, G. Experimental Evaluation and Modelling of Steam Gasification and Hydrogen Inhibition
in CLC with Solid Fuel. MSc Thesis, Chalmers University of Technology, 2010.
109 Shulman, A., Linderholm, C., Mattisson, T., Lyngfelt, A. High Reactivity and Mechanical
Durability of NiO/NiAl2O4 and NiO/NiAl2O4/MgAl2O4 Oxygen Carrier Particles Used for more
than 1000 h in a 10 kW CLC Reactor. Industrial & Engineering Chemistry Research, 2009,
48(15), 7400-7405.
110 Lussier, M.G., Zhang, Z., Miller, D.J. Characterizing Rate Inhibition in Steam/Hydrogen
Gasification via Analysis of Adsorbed Hydrogen. Carbon, 1998, 36(9), 1361-1369.

78
111 Huang, Z., Zhang, J., Zhao, Y., Zhang, H., Yue, G., Suda, T., Narukawa, M. Kinetic Studies
of Char Gasification by Steam and CO2 in the Presence of H2 and CO. Fuel Processing
Technology, 2010, 91(8), 843-847.
112 Keller, M., Leion, H., Mattisson, T., Lyngfelt A. Gasification Inhibition in Chemical Looping
Combustion with Solid Fuels. submitted for publication, 2010.