1 initial observations on lmp in other jurisdictions andrew pietrewicz october 30, 2003 draft - for...
TRANSCRIPT
1
Initial Observations on LMP in Other Jurisdictions
Andrew Pietrewicz
October 30, 2003
DRAFT - For Discussion Purposes Only
- Market Evolution Program -
Day-Ahead Market Working Group

2
Purpose and Overview• Share initial research and observations on the experiences of other jurisdictions with LMP:
• Extract observations made in other markets regarding LMP:
• Why go to LMP?• How was stakeholder risk addressed?• What is (and is not) the role of LMP?
• Briefly profile the LMP systems of ISO-NE, NYISO, and PJM:
• Context for implementing LMP
• LMP trends
• FTRs and ARRs– how they are allocated/auctioned, – FTR and ARR results/trends
• Investment trends
3
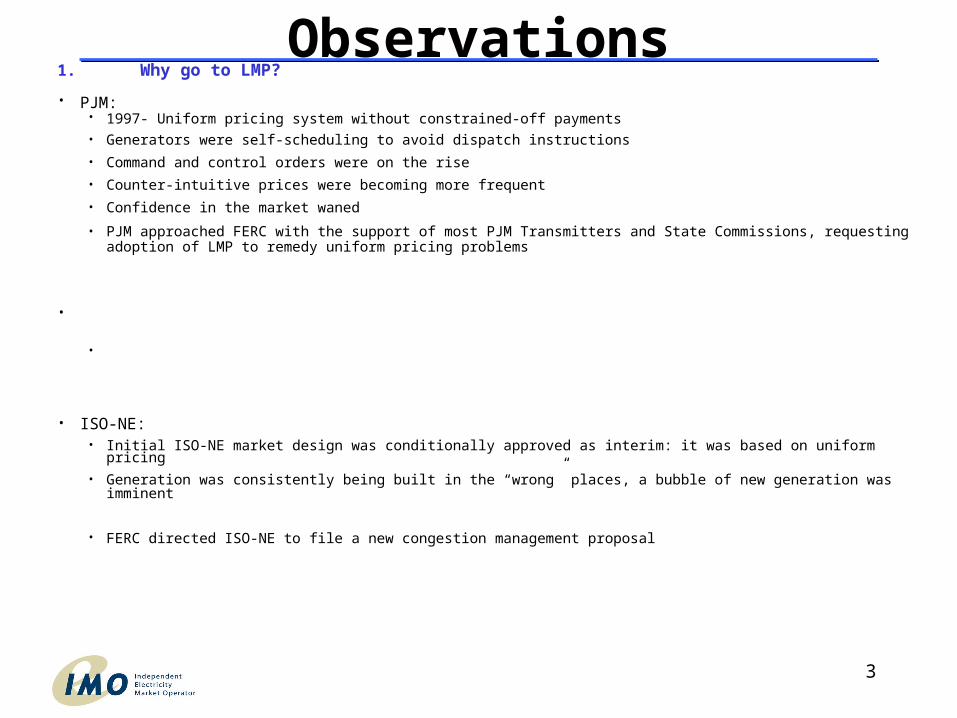
Observations1. Why go to LMP?
• PJM: • 1997- Uniform pricing system without constrained-off payments• Generators were self-scheduling to avoid dispatch instructions
• Command and control orders were on the rise
• Counter-intuitive prices were becoming more frequent
• Confidence in the market waned
• PJM approached FERC with the support of most PJM Transmitters and State Commissions, requesting adoption of LMP to remedy uniform pricing problems
•
NYPOOL:
•
Generators were self-scheduling to avoid “Split Savings” arrangement
• ISO-NE: • Initial ISO-NE market design was conditionally approved as interim: it was based on uniform pricing
• Generation was consistently being built in the “wrong” places, a bubble of new generation was imminent
• FERC directed ISO-NE to file a new congestion management proposal
4
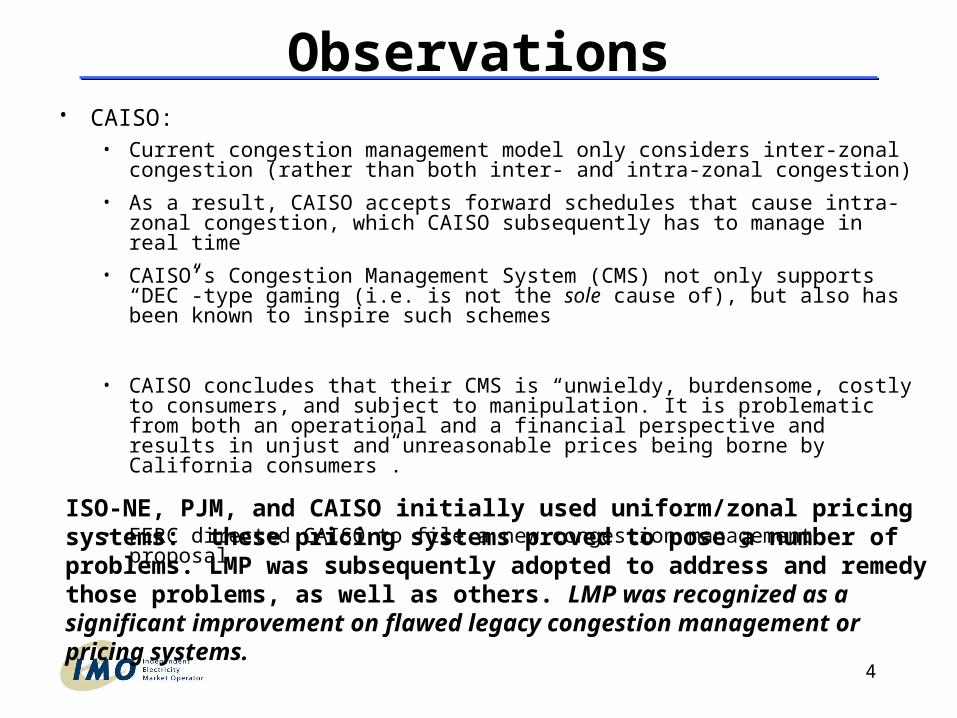
Observations• CAISO:
• Current congestion management model only considers inter-zonal congestion (rather than both inter- and intra-zonal congestion)
• As a result, CAISO accepts forward schedules that cause intra-zonal congestion, which CAISO subsequently has to manage in real time
• CAISO’s Congestion Management System (CMS) not only supports “DEC”-type gaming (i.e. is not the sole cause of), but also has been known to inspire such schemes
• CAISO concludes that their CMS is “unwieldy, burdensome, costly to consumers, and subject to manipulation. It is problematic from both an operational and a financial perspective and results in unjust and unreasonable prices being borne by California consumers”.
• FERC directed CAISO to file a new congestion management proposalISO-NE, PJM, and CAISO initially used uniform/zonal pricing systems: these pricing systems proved to pose a number of problems. LMP was subsequently adopted to address and remedy those problems, as well as others. LMP was recognized as a significant improvement on flawed legacy congestion management or pricing systems.

5
Observations2. Managing the transition to LMP:
• A variety of mechanisms were /will be/ employed in parallel with LMP to moderate potential price impacts:
a) Impact studies and market trials were performed.
• e.g., ISO-NE and CAISO:
- produced white papers
- published indicative LMPs,
- published analyses of regional congestion patterns,
- performed /will perform/ market trials,
- maintained extensive stakeholdering and information sharing
Jurisdictions adopting LMP recognized and addressed the importance of sharing accurate information with stakeholders and establishing realistic expectations as early and as frequently as possible

6
Observations2. Managing the transition to LMP (continued):
b) Load-weighted average zonal settlement for load (a.k.a. load aggregation)**:
• ISO-NE settles load at 8 different zones
• NYISO settles load at 11 different zones
• CAISO will settle load at 3 different zones
Aggregating load into zones moderates price impacts on consumers in congested areas.
– As pointed out by CAISO, this is particularly important since such impacts “would
be the result of constraints in transmission systems designed and constructed under regimes that did not employ competitive generation markets or nodal pricing”.
** Load aggregation is also driven by the absence of sufficient metering needed to “map” loads toindividual nodes on a dynamic basis needed for hourly settlements.

7
Observations2. Managing the transition to LMP (continued):
c) Allocation of FTRs or ARRs to load (via Transmission Owners or LSEs)
• ISO-NE allocates most ARRs to Load via LSEs
• NYISO allocates ARRs to load via Transmission Owners
• PJM allocates ARRs to load via Transmission Owners (initially allocated FTRs also)
• CAISO proposes to allocate FTRs to load via LSEs
Allocating FTRs or ARRs to load assists load to recover the costs of congestion.
8
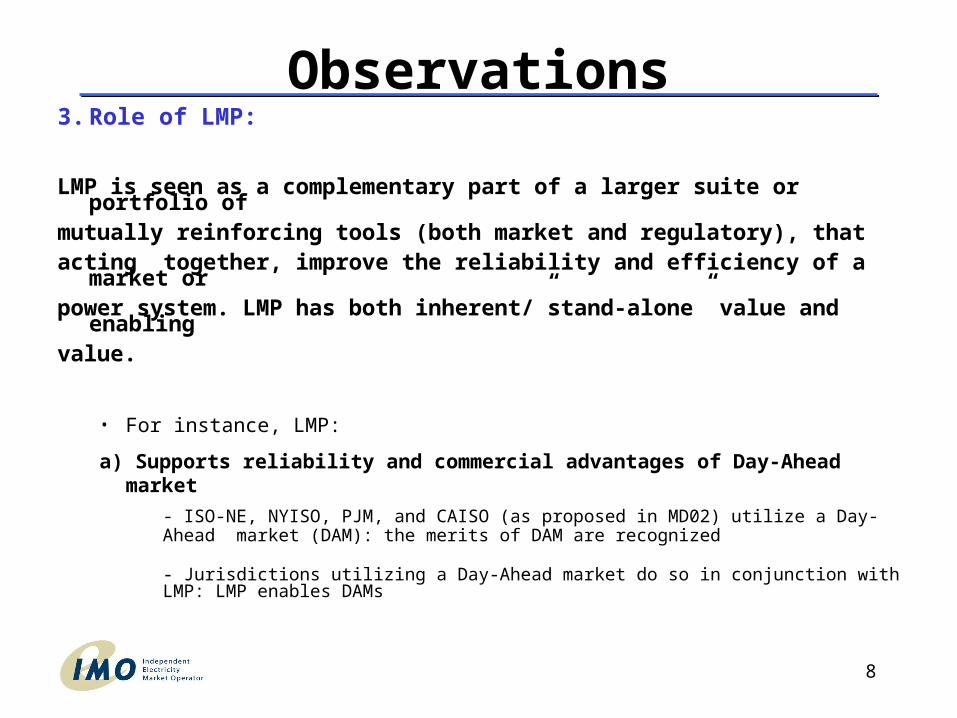
Observations3. Role of LMP:
LMP is seen as a complementary part of a larger suite or portfolio of mutually reinforcing tools (both market and regulatory), that acting together, improve the reliability and efficiency of a market or power system. LMP has both inherent/”stand-alone” value and enabling value.
• For instance, LMP:
a) Supports reliability and commercial advantages of Day-Ahead market
- ISO-NE, NYISO, PJM, and CAISO (as proposed in MD02) utilize a Day-Ahead market (DAM): the merits of DAM are recognized
- Jurisdictions utilizing a Day-Ahead market do so in conjunction with LMP: LMP enables DAMs

9
Observations3. Role of LMP (continued):
b) Enhances the informational basis available for investment decisions
- identifies congested areas
- produces transparent prices which assist investment analysis
- helps account for the value of upgrades to the system
- assists in comparing value of “competing” investment options
c) Supports efficient regional planning
- enhances available information, for same reasons as listed above
- PJM: LMPs are used to help identify desirable expansions from both a reliability and efficiency point of view
- PJM analyzes LMPs to determine whether congestion at a given location is unhedgeable: these determinations can form the basis for transmission expansion initiatives (whether market-led or regulatory backstop-based)
- creates and helps evaluate financial incentives for qualified upgrade investments

10
Observations3. Role of LMP (continued):
• LMP alone does not solve all investment problems - barriers to investment persist for a number of reasons:
• Siting considerations and restrictions, lack of appropriate cost allocation arrangements, lack of financing, undeveloped long-term FTR markets, etc.
• LMP jurisdictions do not over-sell the logic that “signals necessarily lead to investment”: prices are not only about LMP/LMP is not only about prices
• LMP is realistically seen in other jurisdictions as a necessary but not sufficient system feature
• Notwithstanding, the desirability of LMP as a prudent congestion pricing policy is not negated by persistent and widespread investment barriers - there are numerous good reasons to adopt LMP:
• LMP is seen to have inherent value (i.e. information) as well as enabling value (i.e. complements, supports, enhances other power system/market aspects)
• The sense is that LMP is forward thinking, responsible public policy
• A uniform pricing system with constraint side-payments does not have the same stand alone or enabling value as LMP

11
ISO-NE: Background• June 1997: ISO-NE conditionally commenced operation under an interim market design featuring uniform pricing and a single settlement system
• In 2000, further to its conditional approval of the ISO-NE interim market design, FERC directed that a proposal be filed for the development of a New England Congestion Management and Multiple Settlement System (CMS/MSS)
• In its 2000 directive, FERC expressed concern over the prevalence of ill-sited new generation developments under the interim uniform pricing system, and expressed a desire to remedy this for an oncoming surge of new generation developments
• July 2001: NEPOOL and ISO-NE jointly proposed to replace interim ISO-NE market with a New England Standard Market Design (NE-SMD), featuring provisions for LMP and a Day-Ahead Market
• September 2002: FERC issued an order accepting NE-SMD
• March 2003: NE-SMD implemented.

12
ISO-NE: LMPs• Prices have declined since implementation of NE-SMD, though it is
too early to make profound price-related conclusions
– Caveat: FTR and ARR payments lower the price paid by loads. Looking at nodal prices alone without considering the net effects of FTRs/ARR can be misleading. Further, comparing LMPs against legacy uniform prices can be misleading: all prices offered in this presentation are for reference purposes only, and have not been normalized.
ISO-NE Averge Monthly ECP May 01 1999 - December 31 2002, with Average Monthly LMP March 01 2003 - August 31 2003
(Not Fuel Adjusted or Load Weighted)
$23.00
$33.00
$43.00
$53.00
$63.00
$73.00
05
-99
07
-99
09
-99
11-9
9
01
-00
03
-00
05
-00
07
-00
09
-00
11-0
0
01
-01
03
-01
05
-01
07
-01
09
-01
11-0
1
01
-02
03
-02
05
-02
07
-02
09
-02
11-0
2
01
-03
03
-03
05
-03
07
-03
13
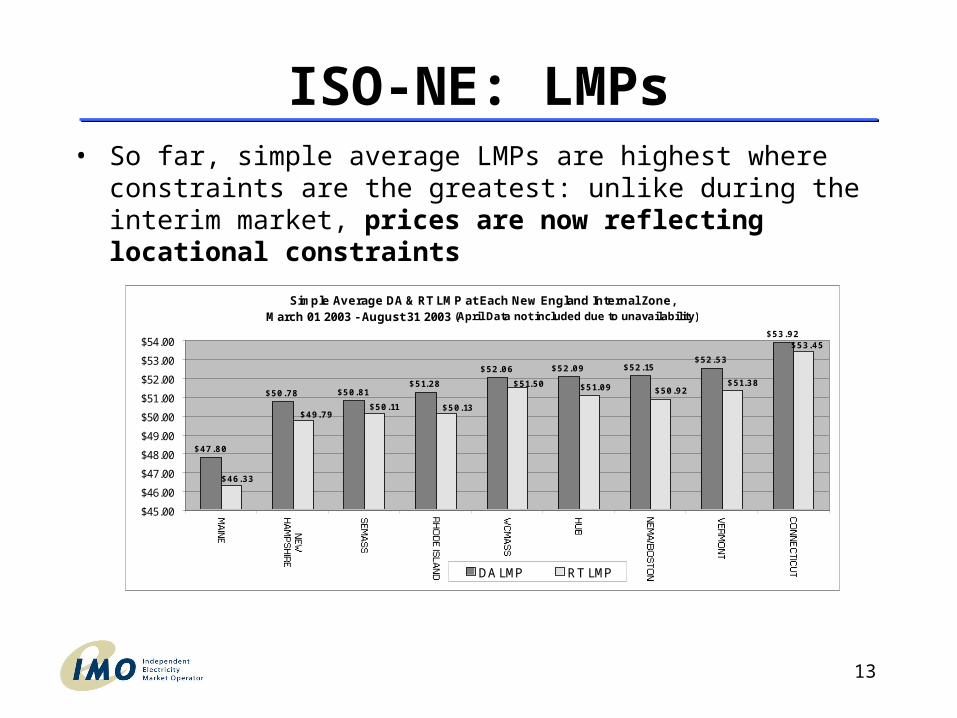
ISO-NE: LMPs• So far, simple average LMPs are highest where constraints are the
greatest: unlike during the interim market, prices are now reflecting locational constraints
Simple Average DA & RT LMP at Each New England Internal Zone, March 01 2003 - August 31 2003 (April Data not included due to unavailability)
$47.80
$50.78 $50.81$51.28
$52.06 $52.09 $52.15$52.53
$53.92
$46.33
$49.79$50.11 $50.13
$51.50 $51.09 $50.92$51.38
$53.45
$45.00
$46.00
$47.00
$48.00
$49.00
$50.00
$51.00
$52.00
$53.00
$54.00
DA LMP RT LMP

14
Definitions: FTRs and ARRs
• A Financial Transmission Right (FTR) is defined by a specific MW value in one direction between a source point and a sink point.
• Congestion revenues arise because the sum of load payments exceeds the sum of generator receipts when there is congestion. The difference between these two sums is the “congestion rent” or “settlement surplus”, and is used to fund FTRs.
• FTR holders are entitled to receive congestion revenues (or to pay congestion charges, depending on the type of FTR) up to an amount equal to the MW value of the FTR times the difference in the Locational Marginal Prices for the points defined in the FTR.
• FTRs may typically be obtained by allocation, through a centralized FTR auction, or through Secondary Markets.
• Auction Revenue Right (ARRs) represent shares of the revenues generated by the sale of FTRs in a specific auction. Like, FTRs, they are expressed in terms of MW quantity, source point, and sink point.

15
ISO-NE: FTRs and ARRs• ISO-NE currently holds periodic auctions for monthly FTRs.
• Auctions for 3-month FTRs will commence sometime this October, while 6-month and annual FTR auctions will likely begin in 2004.
• ISO-NE FTRs are currently offered on an Obligation basis, though Option
FTRs are contemplated for the future.
• FTR auction revenues (ARRs) are allocated to:
A) Entities paying for transmission upgrades that increase transfer capability on the NEPOOL transmission system
B) Loads via LSEs
16
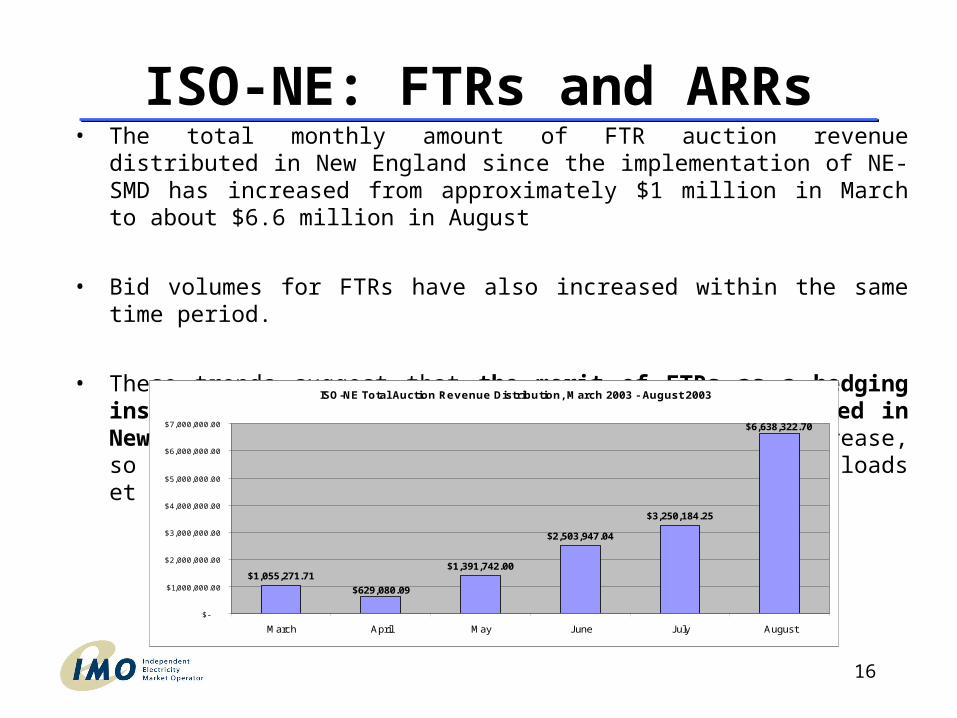
ISO-NE: FTRs and ARRs• The total monthly amount of FTR auction revenue distributed in New England
since the implementation of NE-SMD has increased from approximately $1 million in March to about $6.6 million in August
• Bid volumes for FTRs have also increased within the same time period.
• These trends suggest that the merit of FTRs as a hedging instrument is increasingly being recognized and valued in New England. In conjunction, as auction revenues increase, so too does the amount available to be refunded to loads et al. as ARRsISO-NE Total Auction Revenue Distribution, March 2003 - August 2003
$1,055,271.71$1,391,742.00
$2,503,947.04
$3,250,184.25
$6,638,322.70
$629,080.09
$-
$1,000,000.00
$2,000,000.00
$3,000,000.00
$4,000,000.00
$5,000,000.00
$6,000,000.00
$7,000,000.00
March April May June July August

17
ISO-NE: FTRs and ARRs• ~99% of ARRs have been allocated to load so far: ARRs are assisting
load to recover the costs of congestion
• The greatest share of ARRs has been allocated to those zones paying the highest congestion costs: NEMA/Boston, Connecticut, and SEMASS
– Qualified Upgrade Awards represent ~1% of the total $15 million in ARRs allocated between March and August. “QUAs” are provided to those who have paid to upgrade the Transmission System
ISO-NE ARR Distributions by Zone, March 2003 - August 2003
$3,321,733
$565,400
$6,679,338
$1,455,385
$66,120$541,313
$420,027 $228,180$-
$1,000,000
$2,000,000
$3,000,000
$4,000,000
$5,000,000
$6,000,000
$7,000,000
$8,000,000
18
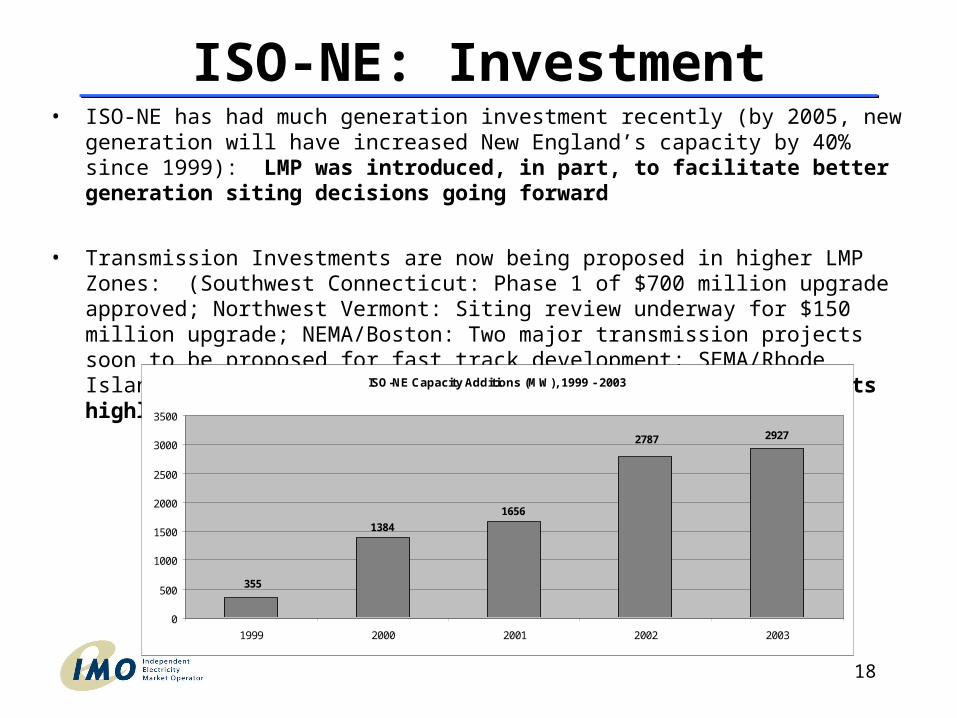
ISO-NE: Investment• ISO-NE has had much generation investment recently (by 2005, new generation will
have increased New England’s capacity by 40% since 1999): LMP was introduced, in part, to facilitate better generation siting decisions going forward
• Transmission Investments are now being proposed in higher LMP Zones: (Southwest Connecticut: Phase 1 of $700 million upgrade approved; Northwest Vermont: Siting review underway for $150 million upgrade; NEMA/Boston: Two major transmission projects soon to be proposed for fast track development; SEMA/Rhode Island: Transmission studies underway): Constraints and costs highlighted by LMPs are being recognized and addressed
ISO-NE Capacity Additions (MW), 1999 - 2003
1384
1656
2787
355
2927
0
500
1000
1500
2000
2500
3000
3500
1999 2000 2001 2002 2003
19
NYISO: Background• NYISO assumed responsibility for the operation of New York
State’s electric power system on December 01, 1999.
• New York’s electric wholesale markets and LMP congestion
pricing system were initiated coincident with the establishment
on the NYISO
20
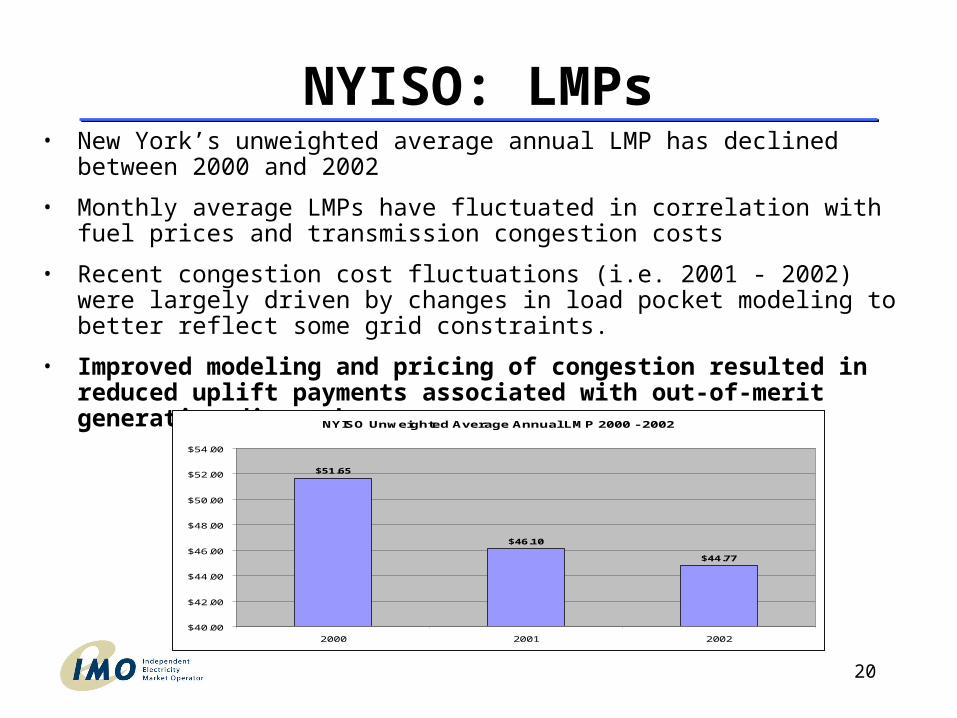
NYISO: LMPs• New York’s unweighted average annual LMP has declined between 2000 and
2002
• Monthly average LMPs have fluctuated in correlation with fuel prices and transmission congestion costs
• Recent congestion cost fluctuations (i.e. 2001 - 2002) were largely driven by changes in load pocket modeling to better reflect some grid constraints.
• Improved modeling and pricing of congestion resulted in reduced uplift payments associated with out-of-merit generation dispatch
NYISO Unweighted Average Annual LMP 2000 - 2002
$51.65
$46.10
$44.77
$40.00
$42.00
$44.00
$46.00
$48.00
$50.00
$52.00
$54.00
2000 2001 2002
21
NYISO: FTRs (TCCs) and ARRs• NYISO is currently in the midst of an “interim” FTR market design:
• Grandfathered rights (physical, Point To Point, use it or lose it),• Grandfathered rights converted into FTRs,• FTRs offered to Transmission Owners.
• FTRs can be “sold directly” or offered into auction
• Auctions are held for single-round monthly “reconfiguration” FTRs as well as for multi-round 6-month, 1-year, 2-year, and 5-year FTRs (Obligations).
• Auction revenues are allocated to Transmission Owners and applied to embedded costs of transmission system (to reduce the Transmission Service Charge paid by loads)
22
NYISO: Investment• New York recently experienced a “boom” in generation investment (~2,500 - 3,500MW).
• However, NYISO notes that some of the new supply is being offset by retirements of
existing facilities, and that barriers to optimal siting persist: “onerous” siting restrictions,
lack of an effective regional planning process, paucity of investment financing.
• Transmission investment is less forthcoming, though interest is apparent (i.e Cross-Sound Cable, Neptune)
• NYISO cites the lack of “appropriate cost allocation formulas and cost recovery mechanisms” and lack of a regional transmission expansion plan as major barriers to transmission investment.
23
PJM: Background• Became the first FERC-approved ISO in the USA in late 1997
• Implemented market rates in early 1998, based on uniform pricing
• Replaced uniform pricing with an LMP congestion pricing and
management system in April 1998
• Introduction of LMP driven primarily by threat of loss of dispatch
control as a result of incentives to self-schedule - driven by use of
uniform pricing without constrained-off payments
24
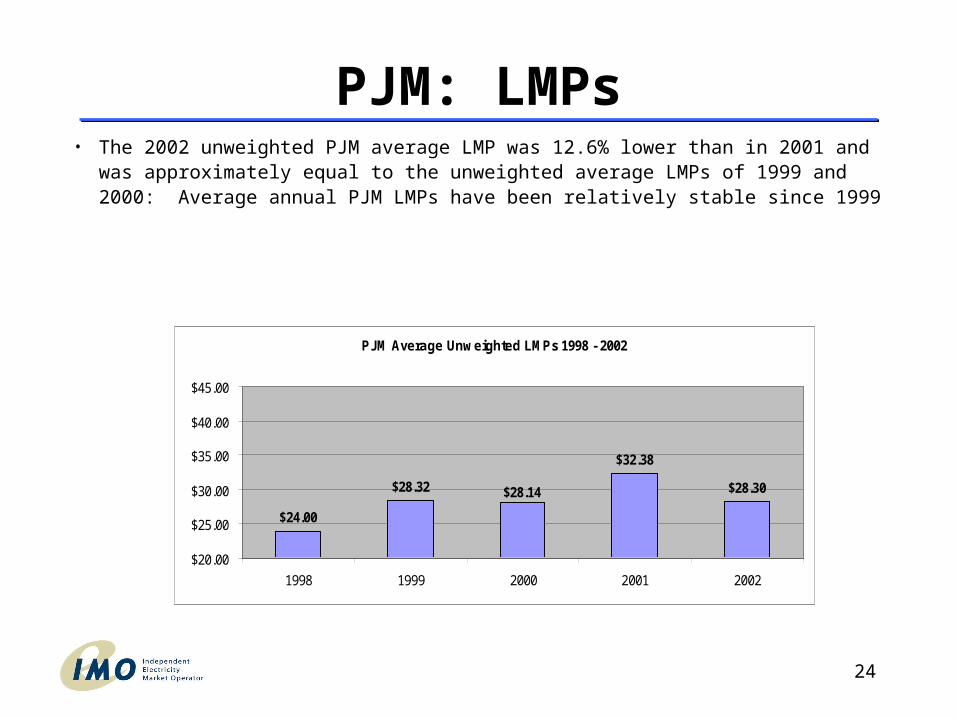
PJM: LMPs• The 2002 unweighted PJM average LMP was 12.6% lower than in 2001 and was
approximately equal to the unweighted average LMPs of 1999 and 2000: Average annual PJM LMPs have been relatively stable since 1999
PJM Average Unweighted LMPs 1998 - 2002
$24.00
$28.32
$32.38
$28.30$28.14
$20.00
$25.00
$30.00
$35.00
$40.00
$45.00
1998 1999 2000 2001 2002
25
PJM: LMPs• Temporary fluctuations in monthly average LMPs have been correlated with fluctuations in fuel prices and temporary congestion costs:
• Increased congestion costs were said to be due “in significant part” to:
• The addition of PJM-West facilities in 2002; and
• Forced transmission outages, outages for planned transmission maintenance, and outages to enable construction of new transmission facilities in the Delmarva Peninsula Zone (beginning around the year 2000).
• LMPs in Delmarva Zone were noted to re-converge with Western Hub following the completion of initial Delmarva facility upgrades (beginning around 2002)
26
PJM: FTRs• Initially, all FTRs were allocated to load (i.e. without an auction
mechanism)
• Later, PJM auctioned unallocated FTRs as Obligations
• Currently, PJM auctions all FTRs on a monthly and multi-round
annual basis
• Annual FTRs and FTR Options were introduced in 2003
• ARRs are allocated to load via Transmission Owners, assisting load to
rebate congestion costs
• Where applicable, ARRs are reassigned as load switches among LSEs

27
PJM: FTR Revenues and ARRs• Average monthly auction revenues have been on the increase since 1999
• Since 1999, bid volume for FTRs has exceeded offer volume by a ratio of ~10:1
PJM Average Monthly FTR Auction Revenues 1999 - 2002
$30,000
$350,000
$600,000
$1,200,000
$-
$200,000
$400,000
$600,000
$800,000
$1,000,000
$1,200,000
$1,400,000
1999 2000 2001 2002
28
PJM: Investment• 6,750MW of new generation has been placed in service since
1999
• Since 1999, PJM has received ~380 requests for new connection of generation (totaling approximately 120,000MW of proposed capacity).
• As of January 2003, projects representing ~27,500MW of new capacity remained in PJM’s interconnection queues
• Demand response programs have grown to currently represent 1,383 MW of reducible load — or approximately 2% of the all-time peak of PJM.
• Siting investment in the most appropriate locations remains a challenge for reasons similar to those cited in the NYISO context
29
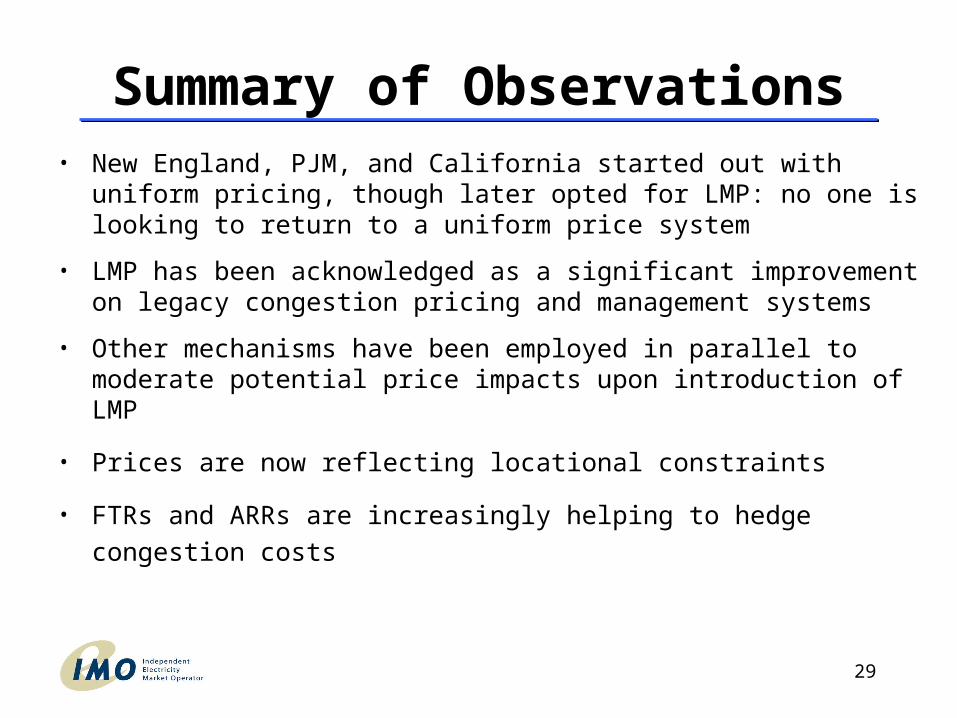
Summary of Observations• New England, PJM, and California started out with uniform pricing,
though later opted for LMP: no one is looking to return to a uniform price system
• LMP has been acknowledged as a significant improvement on legacy congestion pricing and management systems
• Other mechanisms have been employed in parallel to moderate potential price impacts upon introduction of LMP
• Prices are now reflecting locational constraints
• FTRs and ARRs are increasingly helping to hedge congestion costs

30
Summary of Observations• LMP is seen as complementary, supportive, enabling, and enhancing
of reliable and efficient power systems and markets: LMP has inherent/stand alone value as well as enabling value
• LMP alone does not account for price or investment trends
• Barriers to investment persist: LMP is necessary but not sufficient
• Overall, LMP is seen as forward thinking, responsible public policy
31
THANK YOUTHANK YOU
Andrew Pietrewicz
- Market Evolution Program -
Day-Ahead Market Working Group