1 hologic, inc. first quarter fiscal 2010 performance december 26, 2009 financial results company...
TRANSCRIPT

1
Hologic, Inc.
First Quarter Fiscal 2010 Performance
December 26, 2009
• Financial results
• Company highlights
• Second quarter and fiscal year 2010 outlookProvided February 1, 2010 as part of an oral presentation and is qualified by such, contains forward-looking statements, actual results may vary materially from any forward-looking information provided– Hologic
disclaims any duty to update.
2
Safe Harbor StatementSafe Harbor Statement Safe Harbor StatementSafe Harbor Statement This presentation contains forward-looking information that involves risks and uncertainties, including statements regarding the Company’s plans, objectives, expectations and intentions. Such statements include, without limitation, statements regarding: the expected continued market challenges; the Company’s backlog and any implication that the Company’s backlog may be indicative of future sales; the Company’s growth objectives and focus; market trends; and the Company’s outlook and financial and other guidance. These forward-looking statements are based upon assumptions made by the Company as of the date hereof and are subject to known and unknown risks and uncertainties that could cause actual results to differ materially from those anticipated.
The Company’s backlog consists of purchase orders for which delivery is scheduled within the next twelve months, as specified by the customer. In certain circumstances, orders included in backlog may be canceled or rescheduled by customers without significant penalty. Therefore, backlog as of any particular date should not be relied upon as indicative of the Company’s revenues for any future period.
Other risks and uncertainties that could adversely affect the Company’s business and prospects, and otherwise cause actual results to differ materially from those anticipated, include without limitation: U.S. and general worldwide economic conditions and related uncertainties; the Company’s reliance on third party reimbursement policies to support the sales and market acceptance of its products, including the possible adverse impact of government regulation and changes in the availability and amount of reimbursement; uncertainties regarding proposed healthcare reform and associated tax proposals; changes in guidelines, recommendations and studies published by various organizations that could affect the use of the Company’s products; the Company’s ability to integrate its acquisitions and business combinations effectively; uncertainties inherent in the development of new products and the enhancement of existing products, including FDA approval and/or clearance and other regulatory risks, technical risks, cost overruns and delays; the risk that newly introduced products may contain undetected errors or defects or otherwise not perform as anticipated; manufacturing risks, including the Company’s reliance on a single or limited source of supply for key components, and the need to comply with especially high standards for the manufacture of many of its products; the Company’s ability to predict accurately the demand for its products, and products under development, and to develop strategies to address its markets successfully; the early stage of market development for certain of the Company’s products; the risk of adverse events and product liability claims; risks related to the use and protection of intellectual property; expenses and uncertainties relating to litigation; technical innovations that could render products marketed or under development by the Company obsolete; competition; the risks of conducting business internationally, including the effect of exchange rate fluctuations on those operations; financing risks, including the Company’s obligation to meet financial covenants and payment obligations under the Company’s financing arrangements and leases; and the Company’s ability to attract and retain qualified personnel.
The risks and uncertainties included above are not exhaustive. Other factors that could adversely affect the Company’s business and prospects are described in the Company’s filings with the Securities and Exchange Commission. The Company expressly disclaims any obligation or undertaking to release publicly any updates or revisions to any such statements to reflect any change in the Company’s expectations or any change in events, conditions or circumstances on which any such statement is based.
Hologic, Adiana, AEG, Cervista, Gestiva, MammoSite, NovaSure, Rapid fFN, Selenia, ThinPrep and Third Wave and associated logos are trademarks and/or registered trademarks of Hologic, Inc. and/or its subsidiaries in the United States and/or other countries.
Provided February 1, 2010 as part of an oral presentation and is qualified by such, contains forward-looking statements, actual results may vary materially from any forward-looking information provided– Hologic
disclaims any duty to update.
3
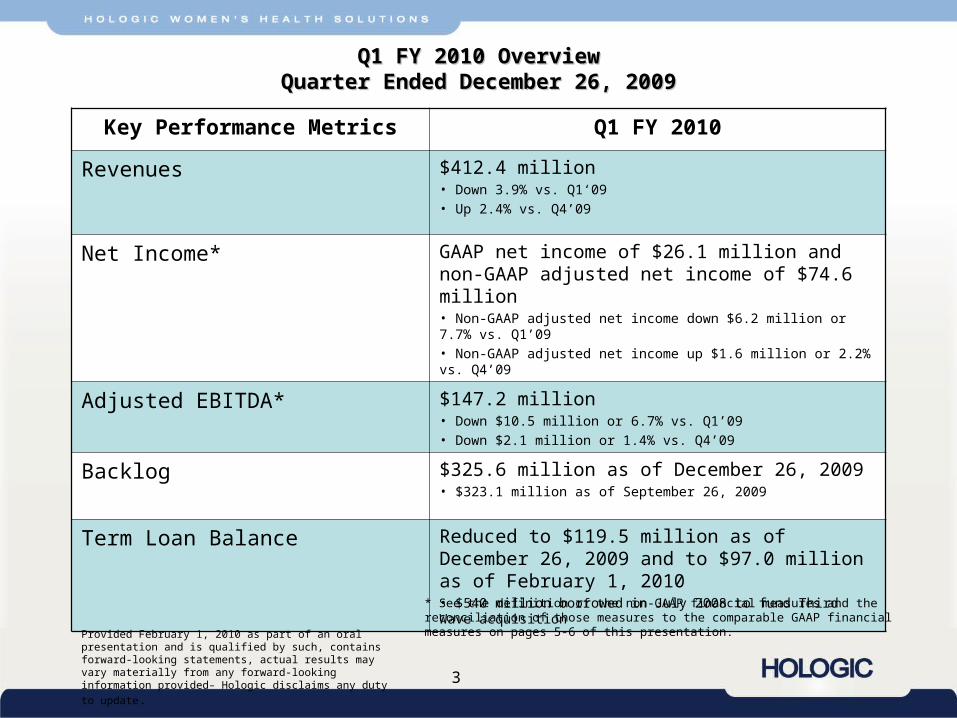
Q1 FY 2010 OverviewQ1 FY 2010 OverviewQuarter Ended December 26, 2009Quarter Ended December 26, 2009
Key Performance Metrics Q1 FY 2010
Revenues $412.4 million• Down 3.9% vs. Q1‘09• Up 2.4% vs. Q4’09
Net Income* GAAP net income of $26.1 million and non-GAAP adjusted net income of $74.6 million• Non-GAAP adjusted net income down $6.2 million or 7.7% vs. Q1’09• Non-GAAP adjusted net income up $1.6 million or 2.2% vs. Q4’09
Adjusted EBITDA* $147.2 million• Down $10.5 million or 6.7% vs. Q1’09• Down $2.1 million or 1.4% vs. Q4’09
Backlog $325.6 million as of December 26, 2009• $323.1 million as of September 26, 2009
Term Loan Balance Reduced to $119.5 million as of December 26, 2009 and to $97.0 million as of February 1, 2010• $540 million borrowed in July 2008 to fund Third Wave acquisition
* See the definition of the non-GAAP financial measures and the reconciliation of those measures to the comparable GAAP financial measures on pages 5-6 of this presentation.
Provided February 1, 2010 as part of an oral presentation and is qualified by such, contains forward-looking statements, actual results may vary materially from any forward-looking information provided– Hologic
disclaims any duty to update.

4
Q1 FY 2010 Financial PerformanceQ1 FY 2010 Financial PerformanceQuarter Ended December 26, 2009Quarter Ended December 26, 2009
(unaudited)(unaudited)
($s in millions, except EPS)
GAAP costs and expenses include:• Amortization of intangibles- $57.1M, $50.4M and $52.1M in Q1’10, Q1’09 and Q4’09, respectively*• Non-cash Interest expense related to the adoption of a new accounting standard- $17.8M, $16.5M and $17.3M in Q1’10, Q1’09 and Q4’09, respectively*• Stock-based compensation- $8.1M, $7.4M and $8.6M in Q1’10, Q1’09 and Q4’09, respectively• Closure costs of $0.5, $0 and $2.0M in Q1’10, Q1’09 and Q4’09, respectively*• Expenses relating to the write-up of acquired inventory to FMV- $0M, $0.6M and $0.1M in Q1’10, Q1’09 and Q4’09, respectively*
Q4-08Non-GAAP*
Q1 '10 Q1 '09 change Q1 '10 Q1 '09 change Q4 '09 change
Revenues $412.4 $429.2 (3.9%) $412.4 $429.2 (3.9%) $402.8 2.4%
Gross margin 63.0% 62.5% 0.5 52.5% 53.6% (1.1) 51.3% 1.2
Operating Expenses $130.4 $123.6 5.5% $144.5 $136.2 6.0% $131.1 10.2%
Pre-Tax Income $116.5 $124.2 (6.2%) $41.1 $56.7 (27.6%) $43.5 (5.4%)
Net Income $74.6 $80.7 (7.7%) $26.1 $38.2 (31.6%) $24.6 6.2%
Diluted EPS $0.29 $0.31 (6.5%) $0.10 $0.15 (33.3%) $0.09 11.1%
GAAP**
* See the definition of the non-GAAP financial measures and the reconciliation of those measures to the comparable GAAP financial measures on pages 5-6 of this presentation.
** GAAP numbers for Q1’09 and Q4’09 have been adjusted for the retrospective adoption of a new standard under GAAP that changed the accounting for convertible debt instruments with cash settlement features.
Provided February 1, 2010 as part of an oral presentation and is qualified by such, contains forward-looking statements, actual results may vary materially from any forward-looking information provided– Hologic
disclaims any duty to update.

5
Reconciliation of GAAP EPS and Net Income to Non-GAAP Adjusted EPS, Net Income and EBITDA Reconciliation of GAAP EPS and Net Income to Non-GAAP Adjusted EPS, Net Income and EBITDA (unaudited - in thousands, except EPS)
EARNINGS PER SHAREGAAP earnings per share- Diluted $ 0.10 $ 0.15 (1)Adjustments to net income (as detailed below) 0.19 0.16 Non-GAAP adjusted earnings per share- Diluted $ 0.29 (2) $ 0.31 (2)
NET INCOMEGAAP net income $ 26,095 $ 38,158 (1)
Adjustments:Fair value write-up of acquired Third Wave inventory sold in 2009 - 584 Amortization of intangible assets 57,099 50,384 Non-cash interest expense relating to recently-issued accounting guidance for convertible debt 17,810 16,509 Operating charges relating to the closure of the Company's organic photoconductor drum coatings manufacturing operations in Shanghai 487 -Income tax effect primarily related to reconciling items (26,938) (3) (24,891) (4)
Non-GAAP adjusted net income 74,553$ 80,744$
EBITDANon-GAAP adjusted net income 74,553$ 80,744$
Interest expense- not adjusted above 13,809 17,387 Provision for income taxes 41,936 43,477 Depreciation and amortization not adjusted above 16,892 16,068
Adjusted EBITDA 147,190$ 157,676$
EXPLANATORY NOTES:(1) Adjusted for retrospective adoption of a new standard under GAAP that changed the accounting for convertible debt instruments with cash settlement features. (2) Non-GAAP adjusted earnings per share was calculated based on 260,804 and 258,433 weighted average diluted shares outstanding.(3) To reflect an estimated annual effective tax rate of 36.0% on a non-GAAP basis.(4) To reflect an estimated annual effective tax rate of 35.0% on a non-GAAP basis.
Three Months Ended Three Months EndedDecember 26, 2009 December 27, 2008
Provided February 1, 2010 as part of an oral presentation and is qualified by such, contains forward-looking statements, actual results may vary materially from any forward-looking information provided– Hologic
disclaims any duty to update.
6
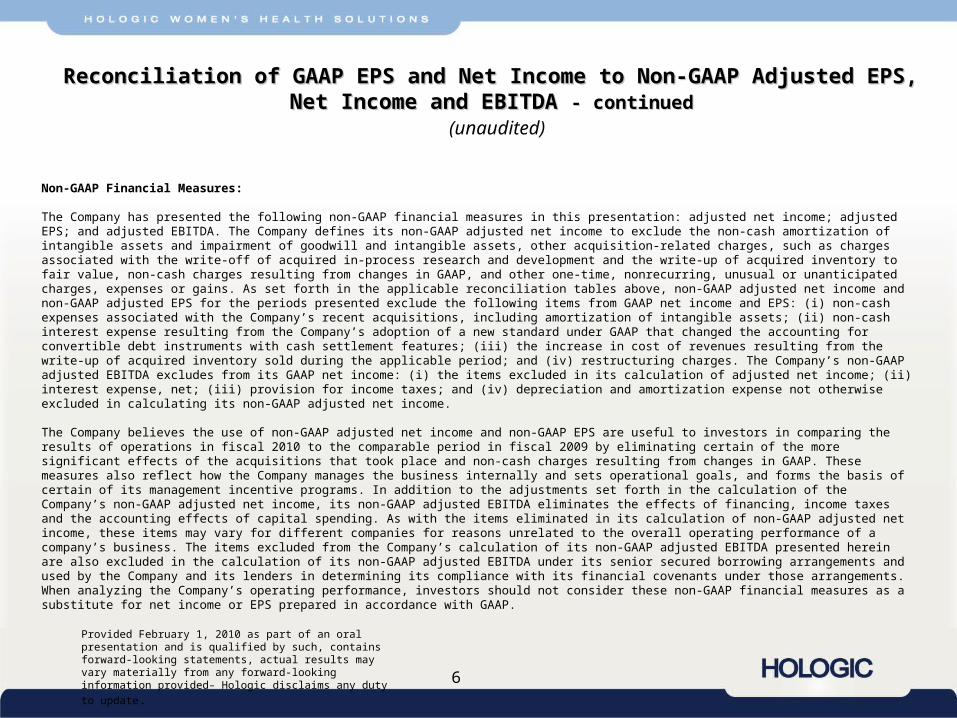
Reconciliation of GAAP EPS and Net Income to Non-GAAP Adjusted EPS,Reconciliation of GAAP EPS and Net Income to Non-GAAP Adjusted EPS, Net Income and EBITDA Net Income and EBITDA - continued - continued
(unaudited)
Non-GAAP Financial Measures:
The Company has presented the following non-GAAP financial measures in this presentation: adjusted net income; adjusted EPS; and adjusted EBITDA. The Company defines its non-GAAP adjusted net income to exclude the non-cash amortization of intangible assets and impairment of goodwill and intangible assets, other acquisition-related charges, such as charges associated with the write-off of acquired in-process research and development and the write-up of acquired inventory to fair value, non-cash charges resulting from changes in GAAP, and other one-time, nonrecurring, unusual or unanticipated charges, expenses or gains. As set forth in the applicable reconciliation tables above, non-GAAP adjusted net income and non-GAAP adjusted EPS for the periods presented exclude the following items from GAAP net income and EPS: (i) non-cash expenses associated with the Company’s recent acquisitions, including amortization of intangible assets; (ii) non-cash interest expense resulting from the Company’s adoption of a new standard under GAAP that changed the accounting for convertible debt instruments with cash settlement features; (iii) the increase in cost of revenues resulting from the write-up of acquired inventory sold during the applicable period; and (iv) restructuring charges. The Company’s non-GAAP adjusted EBITDA excludes from its GAAP net income: (i) the items excluded in its calculation of adjusted net income; (ii) interest expense, net; (iii) provision for income taxes; and (iv) depreciation and amortization expense not otherwise excluded in calculating its non-GAAP adjusted net income. The Company believes the use of non-GAAP adjusted net income and non-GAAP EPS are useful to investors in comparing the results of operations in fiscal 2010 to the comparable period in fiscal 2009 by eliminating certain of the more significant effects of the acquisitions that took place and non-cash charges resulting from changes in GAAP. These measures also reflect how the Company manages the business internally and sets operational goals, and forms the basis of certain of its management incentive programs. In addition to the adjustments set forth in the calculation of the Company’s non-GAAP adjusted net income, its non-GAAP adjusted EBITDA eliminates the effects of financing, income taxes and the accounting effects of capital spending. As with the items eliminated in its calculation of non-GAAP adjusted net income, these items may vary for different companies for reasons unrelated to the overall operating performance of a company’s business. The items excluded from the Company’s calculation of its non-GAAP adjusted EBITDA presented herein are also excluded in the calculation of its non-GAAP adjusted EBITDA under its senior secured borrowing arrangements and used by the Company and its lenders in determining its compliance with its financial covenants under those arrangements. When analyzing the Company’s operating performance, investors should not consider these non-GAAP financial measures as a substitute for net income or EPS prepared in accordance with GAAP.
Provided February 1, 2010 as part of an oral presentation and is qualified by such, contains forward-looking statements, actual results may vary materially from any forward-looking information provided– Hologic
disclaims any duty to update.
7
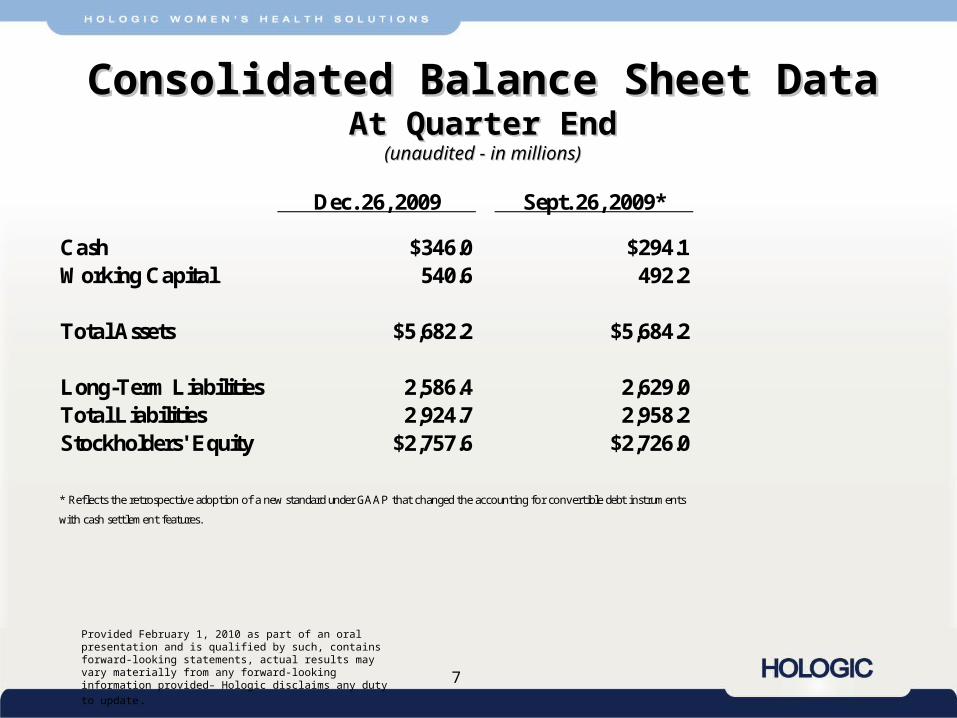
Consolidated Balance Sheet DataConsolidated Balance Sheet DataAt Quarter EndAt Quarter End
(unaudited - in millions)(unaudited - in millions)
Dec. 26, 2009 Sept. 26, 2009*
Cash $346.0 $294.1Working Capital 540.6 492.2
Total Assets $5,682.2 $5,684.2
Long-Term Liabilities 2,586.4 2,629.0Total Liabilities 2,924.7 2,958.2Stockholders' Equity $2,757.6 $2,726.0
* Reflects the retrospective adoption of a new standard under GAAP that changed the accounting for convertible debt instruments
with cash settlement features.
Provided February 1, 2010 as part of an oral presentation and is qualified by such, contains forward-looking statements, actual results may vary materially from any forward-looking information provided– Hologic
disclaims any duty to update.

8
Four Focused Business SegmentsFour Focused Business SegmentsBreakdown of Q1 2010 Revenues of $412.4M
$179.1M
$140.4M
$21.5M
$71.4M
$252.4M
$61.0M
$99.0M
44%BreastHealth
5%Skeletal Health
17%GYN Surgical
34%Diagnostics
61% Disposables
15% Service
24% Cap Equip
Disposables/Service ~ 76%Capital Equipment ~ 24%Disposables/Service ~ 76%Capital Equipment ~ 24%
Provided February 1, 2010 as part of an oral presentation and is qualified by such, contains forward-looking statements, actual results may vary materially from any forward-looking information provided– Hologic
disclaims any duty to update.

9
Q1 FY 2010 Segment Highlights Q1 FY 2010 Segment Highlights Total Breast HealthTotal Breast Health
(Includes Mammography, CAD, Breast Biopsy, MammoSite, and AEG products)(Includes Mammography, CAD, Breast Biopsy, MammoSite, and AEG products)(unaudited)(unaudited)
($s in millions)
1st quarter highlights:• BH revenues represent 44% of total revenues
• BH product revenues represent 36% of total product revenues• Includes $9.8M of amortization of intangibles (vs. $8.0M and $9.8M in Q1’09 and Q4’09, respectively)
• In Q1’10, $7.4M was in COGS and $2.4M in OpEx• In Q1’09, $5.6M was in COGS and $2.4M was in OpEx• In Q4’09, $7.2M was in COGS and $2.6M in OpEx
• Includes $3.7M of stock-based compensation (vs. $2.7M and $3.8M in Q1’09 and Q4’09, respectively)• Includes $0.5M of closure charges ($0M and $2.0M in Q1’09 and Q4’09, respectively)
Q1'10 Q1'09 change Q4'09 change
Revenues $179.1 $199.1 (10.1%) $174.8 2.4%
Gross margin 48.7% 48.9% (0.2) 45.2% 3.5
Operating income $27.8 $45.0 (38.3%) $29.7 (6.5%)
Provided February 1, 2010 as part of an oral presentation and is qualified by such, contains forward-looking statements, actual results may vary materially from any forward-looking information provided– Hologic
disclaims any duty to update.
10
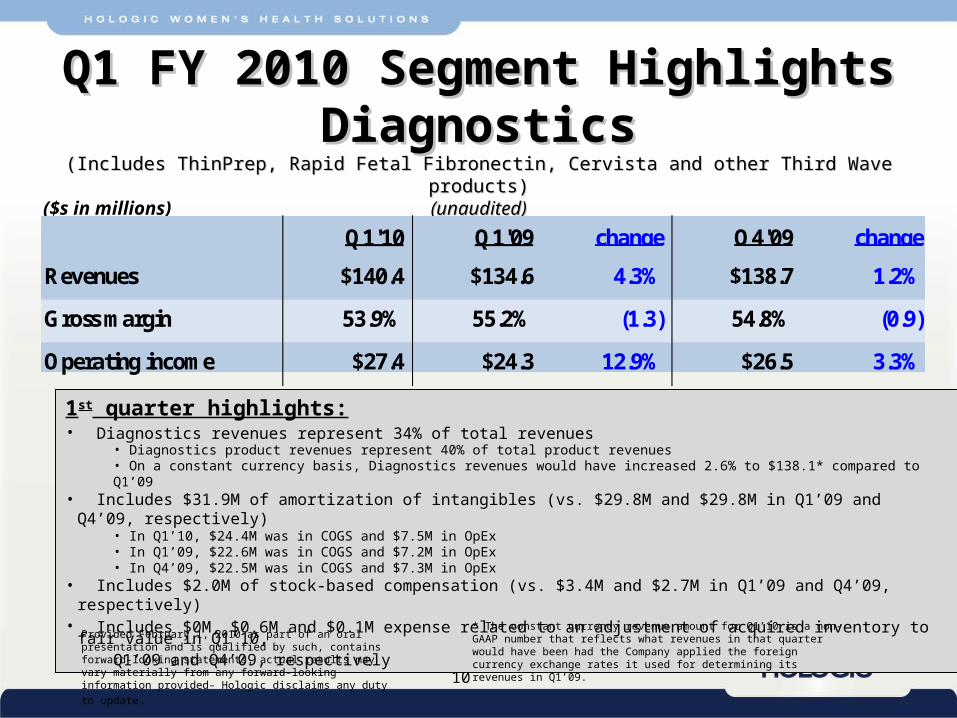
Q1 FY 2010 Segment HighlightsQ1 FY 2010 Segment HighlightsDiagnosticsDiagnostics
(Includes ThinPrep, Rapid Fetal Fibronectin, Cervista and other Third Wave products)(Includes ThinPrep, Rapid Fetal Fibronectin, Cervista and other Third Wave products)(unaudited)(unaudited)
($s in millions)
1st quarter highlights:• Diagnostics revenues represent 34% of total revenues
• Diagnostics product revenues represent 40% of total product revenues• On a constant currency basis, Diagnostics revenues would have increased 2.6% to $138.1* compared to Q1’09
• Includes $31.9M of amortization of intangibles (vs. $29.8M and $29.8M in Q1’09 and Q4’09, respectively)• In Q1’10, $24.4M was in COGS and $7.5M in OpEx• In Q1’09, $22.6M was in COGS and $7.2M in OpEx• In Q4’09, $22.5M was in COGS and $7.3M in OpEx
• Includes $2.0M of stock-based compensation (vs. $3.4M and $2.7M in Q1’09 and Q4’09, respectively)• Includes $0M, $0.6M and $0.1M expense related to an adjustment of acquired inventory to fair value in Q1’10, Q1’09 and Q4’09, respectively
Q1'10 Q1'09 change Q4'09 change
Revenues $140.4 $134.6 4.3% $138.7 1.2%
Gross margin 53.9% 55.2% (1.3) 54.8% (0.9)
Operating income $27.4 $24.3 12.9% $26.5 3.3%
Provided February 1, 2010 as part of an oral presentation and is qualified by such, contains forward-looking statements, actual results may vary materially from any forward-looking information provided– Hologic
disclaims any duty to update.
* The constant currency revenue amount for Q1’10 is a non-GAAP number that reflects what revenues in that quarter would have been had the Company applied the foreign currency exchange rates it used for determining its revenues in Q1’09.
11
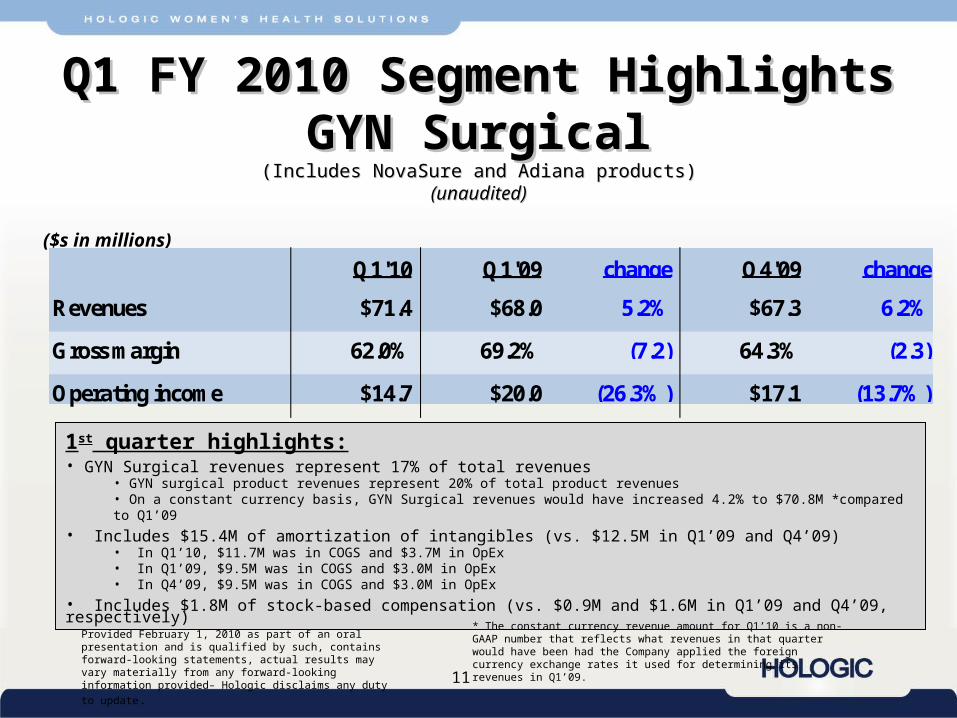
Q1 FY 2010 Segment HighlightsQ1 FY 2010 Segment HighlightsGYN SurgicalGYN Surgical
(Includes NovaSure and Adiana products)(Includes NovaSure and Adiana products)(unaudited)(unaudited)
($s in millions)
1st quarter highlights:• GYN Surgical revenues represent 17% of total revenues
• GYN surgical product revenues represent 20% of total product revenues• On a constant currency basis, GYN Surgical revenues would have increased 4.2% to $70.8M *compared to Q1’09
• Includes $15.4M of amortization of intangibles (vs. $12.5M in Q1’09 and Q4’09)• In Q1’10, $11.7M was in COGS and $3.7M in OpEx• In Q1’09, $9.5M was in COGS and $3.0M in OpEx• In Q4’09, $9.5M was in COGS and $3.0M in OpEx
• Includes $1.8M of stock-based compensation (vs. $0.9M and $1.6M in Q1’09 and Q4’09, respectively)
Q1'10 Q1'09 change Q4'09 change
Revenues $71.4 $68.0 5.2% $67.3 6.2%
Gross margin 62.0% 69.2% (7.2) 64.3% (2.3)
Operating income $14.7 $20.0 (26.3%) $17.1 (13.7%)
Provided February 1, 2010 as part of an oral presentation and is qualified by such, contains forward-looking statements, actual results may vary materially from any forward-looking information provided– Hologic
disclaims any duty to update.
* The constant currency revenue amount for Q1’10 is a non-GAAP number that reflects what revenues in that quarter would have been had the Company applied the foreign currency exchange rates it used for determining its revenues in Q1’09.
12
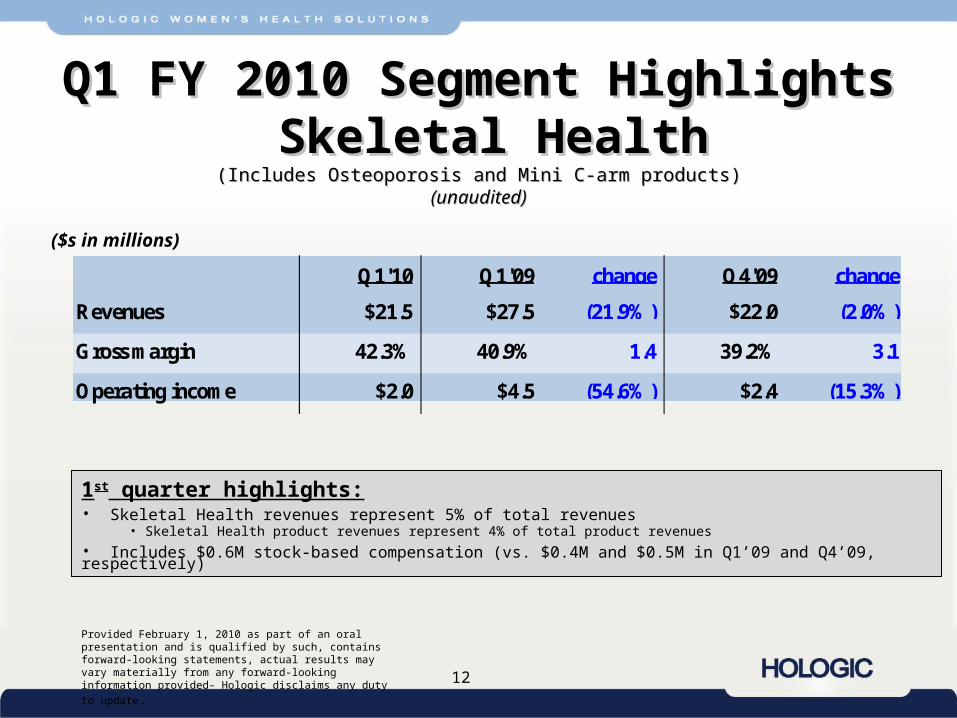
Q1 FY 2010 Segment HighlightsQ1 FY 2010 Segment Highlights Skeletal HealthSkeletal Health
(Includes Osteoporosis and Mini C-arm products)(Includes Osteoporosis and Mini C-arm products)(unaudited)(unaudited)
($s in millions)
1st quarter highlights:• Skeletal Health revenues represent 5% of total revenues
• Skeletal Health product revenues represent 4% of total product revenues
• Includes $0.6M stock-based compensation (vs. $0.4M and $0.5M in Q1’09 and Q4’09, respectively)
Q1'10 Q1'09 change Q4'09 change
Revenues $21.5 $27.5 (21.9%) $22.0 (2.0%)
Gross margin 42.3% 40.9% 1.4 39.2% 3.1
Operating income $2.0 $4.5 (54.6%) $2.4 (15.3%)
Provided February 1, 2010 as part of an oral presentation and is qualified by such, contains forward-looking statements, actual results may vary materially from any forward-looking information provided– Hologic
disclaims any duty to update.

13
Guidance for Q2 FY 2010 (Quarter ending March 27, 2010)Guidance for Q2 FY 2010 (Quarter ending March 27, 2010)
($s in millions, except EPS)
Q2 2009
Actual
Q1 2010
Actual
Q2 2010
Guidance Commentary
Revenues $402.0 $412.4 $410 – $415 Includes modest sales of recently FDA approved Cervista HPV tests and the Adiana permanent contraception system. We expect Q2 revenues to be comparable with Q1 revenues. Note we phased out products accounting for revenues of $6.5M in Q2’09. No contribution from PMA products awaiting FDA approval.
Gross margins 52.1% 52.5% 51% - 52% Expected gross margins for Q2’10 include amortization of intangibles of $44M. Without this expense, we expect gross margins to be approximately 61%-62% on a non-GAAP basis.
Operating expenses
$2,474.4 $144.5 $141 – $144 Expecting a decrease from Q1’10 primarily due to higher sales and marketing expenses in Q1’10 related to RSNA, National Sales Meeting, new product launches and R&D programs, partially offset by increased expenses relating to recently-approved products, clinical trials and other R&D. Expected operating expenses in Q2’10 include amortization of intangibles of approximately $13M. Without this expense, we expect operating expenses to be $128M to $131M on a non-GAAP basis.
Interest expense*
$33.2 $31.8 $32.5 Interest on $1.725B convertible notes and the outstanding term loans ($119.5M outstanding as of Dec. 26, 2009) is expected to be approximately $14.5M, including approximately $4M for amortization of deferred financing costs in Q2’10. In addition, we expect additional non-cash interest expense of approximately $18M related to our adoption of a new accounting standard for the accounting of our convertible notes.
GAAP EPS* ($9.01) $0.10 $0.10 - $0.11 Q2’10 EPS includes approximately $57M for the amortization of intangibles. Non-GAAP adjusted EPS for Q2’10 is expected to be approximately $0.29. See reconciliation of GAAP to non-GAAP expected EPS for Q2’10 on page 15 of this presentation.
* GAAP numbers for Q1’09 and Q2’09 have been adjusted for the retrospective adoption of a new standard under GAAP that changed the accounting for convertible debt instruments with cash settlement features.
Provided February 1, 2010 as part of an oral presentation and is qualified by such, contains forward-looking statements, actual results may vary materially from any forward-looking information provided– Hologic
disclaims any duty to update.

14
Guidance for FY 2010 (Fiscal Year ending September 25, 2010)Guidance for FY 2010 (Fiscal Year ending September 25, 2010)
($s in millions, except EPS)
Fiscal 2009 Actual
Fiscal 2010 Guidance Commentary
Revenues $1,637.1 $1,640 – $1,665 Fiscal 2010 revenues are expected to be slightly above the prior year, driven primarily by an increase in revenues in the GYN Surgical and Diagnostics segments, as well as from Service. Partially offsetting these increases is softness in the Breast Health segment as compared to FY’09, primarily related to the mammography product line revenues as we did not feel the full impact of economic environment until Q2’09, as well as a decrease of $21.0M related to phased-out products.
Gross margins
52.4% 52% – 53% Expecting gross margins to hold relatively flat. Expected gross margins for fiscal 2010 include amortization of intangibles of approximately $174M. Without this expense, we expect gross margins to be approximately 62%-63% on non-GAAP basis.
Operating expenses
$2,874.2 $544 – $554 Fiscal 2009 operating expenses include $2.34B for the impairment of goodwill and write off of certain intangible assets. Expected operating expenses in fiscal 2010 include amortization of intangibles of approximately $54M. Without this expense, we expect operating expenses to be $490M to $500M on a non-GAAP basis for fiscal 2010.
Interest expense
$135.0 $125.0 Interest on $1.725B convertible notes and the outstanding term loans ($119.5M outstanding as of Dec. 26, 2009) is expected to be approximately $52M, including approximately $13.5M for amortization of deferred financing costs. In addition, we expect an additional non-cash interest expense of $73M related to our adoption of a new standard for the accounting of our convertible notes.
GAAP EPS ($8.64) $0.42 – $0.46 Fiscal 2010 EPS includes approximately $228M for the amortization of intangibles. Fiscal 2009 EPS includes approximately $2.34B for the impairment of goodwill and write off of certain intangible assets. Non-GAAP adjusted EPS for fiscal 2010 is expected to be approximately $1.16 to $1.20. See reconciliation of GAAP to non-GAAP expected EPS for fiscal 2010 on page 15 of this presentation.
*GAAP numbers for FY’09 have been adjusted for the retrospective adoption of a new standard under GAAP that changed the accounting for convertible debt instruments with cash settlement features. Provided February 1, 2010 as part of an oral presentation and is qualified
by such, contains forward-looking statements, actual results may vary materially from any forward-looking information provided– Hologic
disclaims any duty to update.
15
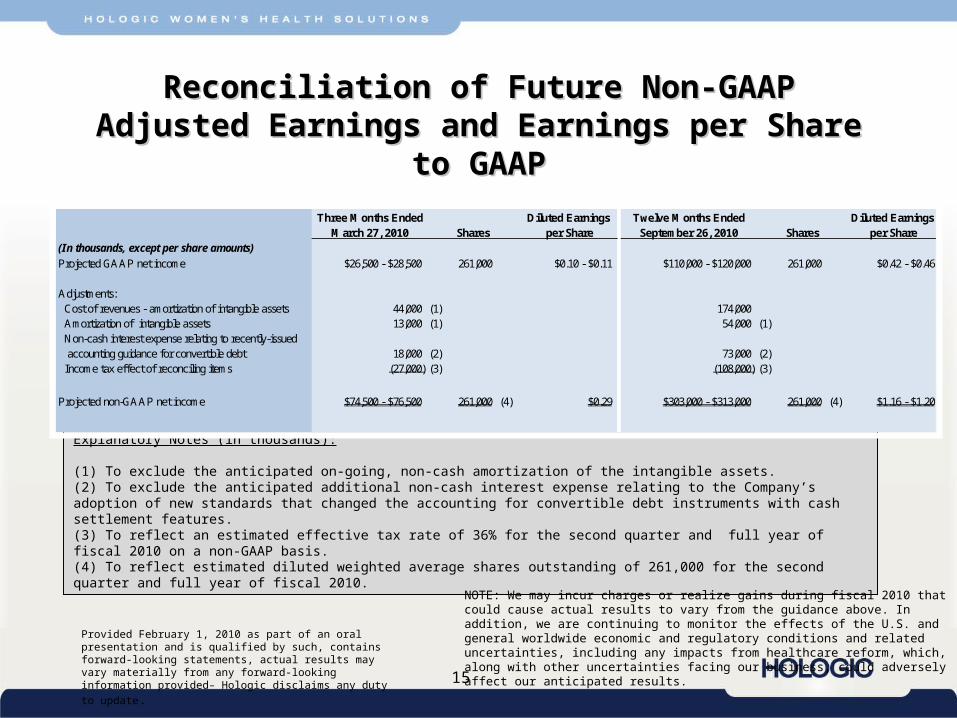
Reconciliation of Future Non-GAAP Adjusted Earnings Reconciliation of Future Non-GAAP Adjusted Earnings and Earnings per Share to GAAPand Earnings per Share to GAAP
Explanatory Notes (in thousands):
(1) To exclude the anticipated on-going, non-cash amortization of the intangible assets.(2) To exclude the anticipated additional non-cash interest expense relating to the Company’s adoption of new standards that changed the accounting for convertible debt instruments with cash settlement features. (3) To reflect an estimated effective tax rate of 36% for the second quarter and full year of fiscal 2010 on a non-GAAP basis.(4) To reflect estimated diluted weighted average shares outstanding of 261,000 for the second quarter and full year of fiscal 2010.
NOTE: We may incur charges or realize gains during fiscal 2010 that could cause actual results to vary from the guidance above. In addition, we are continuing to monitor the effects of the U.S. and general worldwide economic and regulatory conditions and related uncertainties, including any impacts from healthcare reform, which, along with other uncertainties facing our business, could adversely affect our anticipated results.
Three Months Ended Diluted Earnings Twelve Months Ended Diluted EarningsMarch 27, 2010 Shares per Share September 26, 2010 Shares per Share
(In thousands, except per share amounts)
Projected GAAP net income $26,500 - $28,500 261,000 $0.10 - $0.11 $110,000 - $120,000 261,000 $0.42 - $0.46
Adjustments: Cost of revenues - amortization of intangible assets 44,000 (1) 174,000 Amortization of intangible assets 13,000 (1) 54,000 (1) Non-cash interest expense relating to recently-issued accounting guidance for convertible debt 18,000 (2) 73,000 (2) Income tax effect of reconciling items (27,000) (3) (108,000) (3)
Projected non-GAAP net income $74,500 - $76,500 261,000 (4) $0.29 $303,000 - $313,000 261,000 (4) $1.16 - $1.20
Provided February 1, 2010 as part of an oral presentation and is qualified by such, contains forward-looking statements, actual results may vary materially from any forward-looking information provided– Hologic
disclaims any duty to update.

16
Q1 FY 2010 Summary
#1 U.S. market share for digital mammography placements in the U.S.
Strong demand for biopsy tools with sustained growth in sales and market share
Growing recurring revenue stream from service contracts
#1 U.S. market share for digital mammography placements in the U.S.
Strong demand for biopsy tools with sustained growth in sales and market share
Growing recurring revenue stream from service contracts
BREAST HEALTH
Solid progress in new contracts for Cervista HPV
Steady worldwide Pap volume
Stable and continued #1 ThinPrep market share in U.S.
Increased Imager adoption - record quarter
Solid progress in new contracts for Cervista HPV
Steady worldwide Pap volume
Stable and continued #1 ThinPrep market share in U.S.
Increased Imager adoption - record quarter
DIAGNOSTICS
Strong demand for NovaSure systems- record quarter
Growth in monthly standing orders
Adiana limited launch expands
Strong demand for NovaSure systems- record quarter
Growth in monthly standing orders
Adiana limited launch expands
GYN SURGICAL
Revenues and earnings exceeded guidance
Very solid cash flows from operations
Term loan paid down to $119.5 million as of December 26, 2009 ($540M term loan in July 2008 to fund Third Wave acquisition) and $97.0 million as of February 1, 2010
Cash received of $70 million in January 2010 from KV Pharmaceutical relating to the pending sale of our Gestiva assets
FINANCIAL RESULTS
Provided February 1, 2010 as part of an oral presentation and is qualified by such, contains forward-looking statements, actual results may vary materially from any forward-looking information provided– Hologic
disclaims any duty to update.