1 highlights - sonae · investment management division is improving its position in the software...
TRANSCRIPT


Page 2 of 20 11.03.2015
1 HIGHLIGHTS
Sonae successfully reached the retail targets set for 2014, recovering profitability in non-food, and growing market share and maintaining benchmark profitability in food, despite the highly competitive market and deflationary pressures. Our main partnerships, Sierra and NOS, posted strong operating figures and grew total net results
Sonae MC:
• delivered an underlying EBITDA margin of 7.0% in 2014 and 7.5% in 4Q14
• reinforced its market leadership
Sonae SR:
• presented a strong consolidation of sales productivity, showing an increase in sales per
square meter in all business, averaging 10.4%
• grew its underlying EBITDA to 15 M€ in 2014
Investment Management posted a turnover increase of 13.1% and reinforced profitability by 28.1%
Sonae Sierra grew occupancy rates (to 95.5%) and net operating income of its Centres which, together with improving yields, boosted asset valuation
NOS continued its strong performance reaching record operational figures
Strong balance sheet with a gearing of 0.6x and debt with improved spreads and maturities
Page 3 of 20 11.03.2015
2 CEO MESSAGE
“Sonae MC increased its leading market position in Portugal, while continued keeping benchmark levels of profitability. Continente possesses the best value proposition in the Portuguese food retail market as it not only has an unbeatable advantage in terms of pricing, anchored in its loyalty card, but it also presents the widest range of products, which allow us address all consumer patterns. Despite the very intense competitive environment, Sonae MC structural advantages in terms of efficiency enabled us to achieve an EBITDA margin of 7.0% in 2014. At Sonae SR, the main performance indicators kept on posting a positive trend and the team continued to be very committed to the challenging targets set, both in Portugal and Internationally. The store concepts were renewed and results proved to be successful. Worten was able to increase market share in Portugal and kept investing in the turnaround of its Spanish operation. Sport Zone, besides presenting positive Like for Like (LfL) sales, increased turnover by 3.9%. Zippy, our most international brand, ended 2014 with presence in 17 different countries under franchising agreements. In 2014, Sonae RP division completed four small sale and leaseback transactions. Going forward, we will look to move faster to monetise our real estate assets, whilst continuing to pursue the yields the quality of our assets deserves.
Investment Management division is improving its position in the Software and Systems Information (SSI) industry, with WeDo Technologies maintaining global market leadership in the Business Assurance market. In 2014, two material operations were closed: the acquisition of a 60% participation at S21Sec, a company specialised in cyber security services, and the sale of Mainroad to NOS. NOS continued to give solid steps in the pursuit of its strategy. The very strong operational trends are driving market share gains. RGUs growth continues registering record levels with convergent RGUs representing more than 29% of fixed customer base. Synergies from the merger operation are on track with the initial plan. The global occupancy rates of Sonae Sierra assets remained very high and the tenant sales increased significantly on a LfL basis due to the quality of the company’s assets, the good operating performance and the recovery of discretionary consumption in Iberia. Throughout the year, Sonae Sierra continued to implement its strategy of recycling capital and of providing services to third parties, ending 2014 with presence in 4 continents and 14 countries. In 2014, asset valuation increased strongly (+ 89 M€) driven by the yields compression in Iberia, and by the positive evolution of operational performance. In 2014, we further strengthened our capital structure. Excluding the effect of the payment to France Telecom (FT) regarding the 2013 acquisition of their stake in Sonaecom, net debt was reduced by 73 M€. Our board will propose in 2015’s annual general meeting a dividend payment of 3.65 cents per share. In Portugal, the latest economic sentiment and confidence indicators have stabilised suggesting that the recovery in domestic demand, although modest, should continue. In Spain, after three years of recession, the economy began to grow again in 2014. Although watchful, we face 2015 with confidence, believing that our results will benefit with the macroeconomic outlook.”
Paulo Azevedo, CEO Sonae

Page 4 of 20 11.03.2015
Following the merger between Zon and Optimus and its report using the equity method, we decided to change the way we report our results to the market by separating each business, in order to obtain more transparency between the segments: 1) Sonae Retail: Sonae MC, SR and RP; 2) Investment Management, including Software and Systems Information, and Público businesses from Sonaecom; 3) Sonae Sierra and 4) NOS. Moreover, Sonae adjusted the 2013 profit and loss statements on a pro forma basis (2013 PF), assuming that the merger between Zon and Optimus occurred on January 1st 2013, with some consolidation effects in our co-controlled vehicle company. This criterion, besides assuring an easier and fairer comparability between 2013 and 2014 results, is in line with the current reporting pro forma method adopted by Sonaecom, NOS and market expectations.
The 2013 PF financial information contained in this report was not subject to audit procedures

Page 5 of 20 11.03.2015
3 SONAE RETAIL RESULTS
Sonae MC Turnover and underlying EBITDA - yearly performance
Turnover and underlying EBITDA - quarterly performance
In 2014 Sonae MC turnover amounted to 3,461 M€,
growing 1.3% and 45 M€ y.o.y.. The turnover increase was
driven by the sales area expansion in which we would like to
highlight the opening of 3 Continente Modelo and 5
Continente Bom Dia stores.
During this year, Sonae MC strengthened its leading market
share in the Portuguese food retail sector1 supported by:
- an important investment on prices for the benefit of our
customers, continuing to guarantee the lowest prices in
the Portuguese market;
- continuous improvements in the quality of the products
offered. In 2014, Continente was voted for the 12th
consecutive year as a Brand of Trust by Reader’s Digest,
proving consumers continuous recognition of Sonae’s
high quality products;
- largest variety of private label references and other
supplier brands, giving us the ability to rapidly respond
to changes in consumer habits (Continente’s private
label portfolio continued to represent approximately
30% of the turnover of FMCG categories in 2014);
- selective opening of stores and the positive contribution
of franchising opportunities;
- 10% growth of online sales, supported by the renewed
e-commerce platform; and,
- a very good performance of the Well’s format.
Sonae MC underlying EBITDA totalled 241 M€ in 2014,
corresponding to an underlying EBITDA margin of 7.0%. On
a quarterly basis, the underlying EBITDA reached 70 M€,
which results in an underlying EBITDA margin of 7.5%.
When compared to 2013, the lower underlying EBITDA was
impacted by the highly competitive environment
experienced for another year in Portugal, with a strong
promotional effort leading to an internal deflation of 1.9%
(0.4% in the 4Q14).
Nevertheless, Sonae MC was able to maintain the
benchmark profitability, as a result of logistical and
operational efficiencies, as well as the targeted promotional
activity supported by the Continente Loyalty Card (which
represented more than 90% of sales in 2014).
1 For example, A.C.Nielsen’s Homescan 2014 YTD evolution until December 28th estimated market share gain of 0.9 p.p. for Continente.
2012 2013 2014
LfL (%) -2.0% 1.4% -2.1%
Turnover % Growth -1.4% 4.1% 1.3%
3,281 3,415 3,461
7.6% 7.6%7.0%
2012 2013 2014
Turnover Underlying EBITDA margin
+ 4.1% + 1.3%
1Q14 2Q14 3Q14 4Q14
LfL (%) -2.3% -0.3% -2.9% -2.8%
Turnover % Growth 1.7% 3.5% 0.4% 0.0%
787 839
911 924
4.4%
7.7% 7.8% 7.5%
1Q 2Q 3Q 4Q
Turnover Underlying EBITDA margin

Page 6 of 20 11.03.2015
3 SONAE RETAIL RESULTS (cont.)
Sonae SR Turnover and underlying EBITDA - yearly performance
Turnover and underlying EBITDA - quarterly performance
Performance per geography
SR International organic2 – LTM turnover/sqm evolution
2 Includes online sales.
In 2014, Sonae SR turnover reached 1,290 M€, increasing 6.6% (6.1% in Portugal and 7.8% Internationally), notwithstanding the strategy of rightsizing of the store network, including area reduction in various stores (decreasing almost 14 thousand sqm between 2013 and 2014).
During the year, we continued the key lines of our strategy, that include: development and roll-out of new store concepts for the four businesses, rightsizing of the store network, reinforcement of international businesses under a capital light approach, strongly supported by franchising, and improvement of omni-channel experience, already in place at Worten.
Concerning the main achievements in 2014, we would like to highlight the following:
- Worten reinforced its position in the consumer electronics market, gaining market share in Iberia;
- Zippy continued to expand its international presence, ending 2014 with 47 franchised stores across 17 different countries;
- Consolidated online sales grew 78% when compared to 2013, supported by the new Worten, Sport Zone and Zippy e-commerce platforms;
- Already in 2015, MO launched its e-commerce
platform, a project that was developed throughout 2014.
As in 2013, Sonae SR reached a positive underlying EBITDA of 15 M€, supported by the evolution of Portuguese and International businesses. This was backed by the improved top line performance, combined with the measures implemented. In Portugal, EBITDA grew 25.4%, to 48 M€. Internationally, although still negative, EBITDA improved by 4 M€.
1,209 1,210 1,290
-2.1%
0.0%1.2%
2012 2013 2014
Turnover Underlying EBITDA margin
+ 0.1% + 6.6%
291 288 334
376
-1.5%-0.8%
1.2%
4.9%
1Q 2Q 3Q 4Q
Turnover Underlying EBITDA margin
2013 2014 y.o.y 4Q13 4Q14 y.o.y
Turnover (million €) 1,210 1,290 6.6% 383 376 -1.8%
Portugal 877 930 6.1% 279 278 -0.6%
International 333 359 7.8% 104 99 -4.9%
EBITDA (million €) -1 12 - 16 15 -2.9%
Portugal 39 48 25.4% 26 24 -5.5%
International -40 -36 9.7% -10 -9 9.6%
EBITDA margin (%) -0.1% 0.9% 1.1 p.p. 4.1% 4.0% 0.0 p.p.
Portugal 4.4% 5.2% 0.8 p.p. 9.2% 8.8% -0.5 p.p.
International -12.0% -10.1% 2.0 p.p. -9.8% -9.3% 0.5 p.p.
LfL (%) -3.8% 4.6% 8.4 p.p. 5.0% -1.2% -6.2 p.p.
Portugal -2.7% 5.5% 8.2 p.p. 4.9% -0.8% -5.7 p.p.
International -6.8% 0.8% 7.6 p.p. 5.7% -3.3% -9.0 p.p.
40
60
80
100
120
1Q12 2Q12 3Q12 4Q12 1Q13 2Q13 3Q13 4Q13 1Q14 2Q14 3Q14 4Q14
Last 12 months (LTM) turnover/average LTM sq. meter (base 100)
Sq. meter / store (base 100)
Page 7 of 20 11.03.2015
3 SONAE RETAIL RESULTS (cont.)
Sonae RP
Sonae RP Portfolio
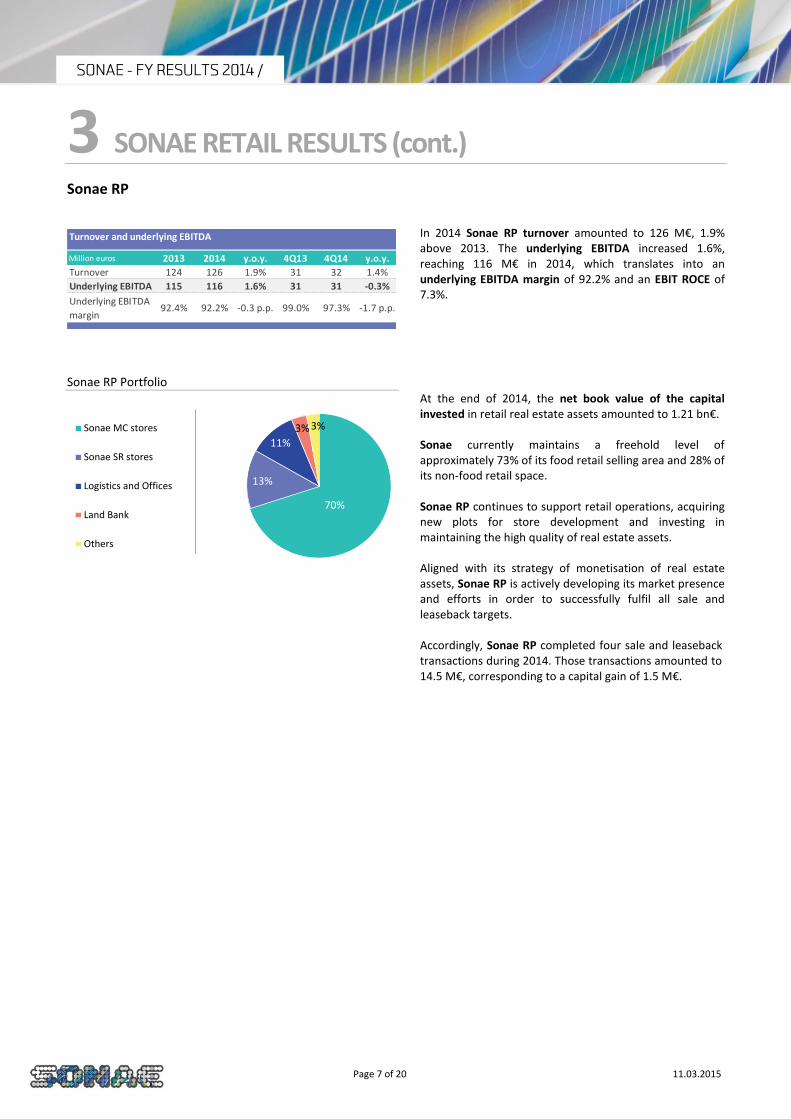
In 2014 Sonae RP turnover amounted to 126 M€, 1.9% above 2013. The underlying EBITDA increased 1.6%, reaching 116 M€ in 2014, which translates into an underlying EBITDA margin of 92.2% and an EBIT ROCE of 7.3%.
At the end of 2014, the net book value of the capital invested in retail real estate assets amounted to 1.21 bn€. Sonae currently maintains a freehold level of approximately 73% of its food retail selling area and 28% of its non-food retail space. Sonae RP continues to support retail operations, acquiring new plots for store development and investing in maintaining the high quality of real estate assets. Aligned with its strategy of monetisation of real estate assets, Sonae RP is actively developing its market presence and efforts in order to successfully fulfil all sale and leaseback targets. Accordingly, Sonae RP completed four sale and leaseback transactions during 2014. Those transactions amounted to 14.5 M€, corresponding to a capital gain of 1.5 M€.
Million euros 2013 2014 y.o.y. 4Q13 4Q14 y.o.y.
Turnover 124 126 1.9% 31 32 1.4%
Underlying EBITDA 115 116 1.6% 31 31 -0.3%
Underlying EBITDA
margin92.4% 92.2% -0.3 p.p. 99.0% 97.3% -1.7 p.p.
Turnover and underlying EBITDA
70%
13%
11%
3% 3%Sonae MC stores
Sonae SR stores
Logistics and Offices
Land Bank
Others

Page 8 of 20 11.03.2015
3 SONAE RETAIL RESULTS (cont.)
Sonae Retail Capex
Sonae MC – Company operated stores
(1)
Sonae SR – Company operated stores
(1)
In 2014, Sonae MC Capex stood at 105 M€, 2 M€ above the value registered last year.
Sonae SR Capex reached 63 M€ in 2014, 30 M€ above the value achieved in 2013.
Sonae RP Capex totalled 27 M€ in 2014, 2 M€ below 2013.
During 2014, Sonae MC investment was, in part, channelled to the opening of 19 stores, including 3 Continente Modelo and 5 Continente Bom Dia stores.
At the end of 2014, Sonae MC operated 478 stores, corresponding to 595,000 sqm.
The investment made during 2014 at Sonae SR was
impacted by the opening of 16 stores, namely:
- 3 Worten stores in Portugal;
- 6 Worten stores in Spain;
- 2 Sport Zone stores in Portugal;
- 3 Sport Zone stores in Spain;
- 1 MO store in Portugal; and,
- 1 Zippy store in Portugal.
At the end of 2014, Sonae SR operated 522 stores, corresponding to 377,000 sqm and included 118 stores outside of Portugal (123,000 sqm).
.
Sonae Retail Franchising
Sonae SR – Franchising stores (1)
(1) EoP net figure.
In 2014 Sonae MC opened 84 stores under franchising agreements, closing the year with 162 stores (43,000 sqm) in this format. During the year, 75 Meu Super stores were opened, ending 2014 with 140 stores and largely surpassing the 100 stores target set last year.
Sonae SR ended 2014 with 73 stores under franchising agreements (20,000 sqm), including 61 outside of Portugal. During 2014, Sonae SR opened 23 new stores, 22 of which outside of Portugal, thus reinforcing its international expansion. It is worth highlighting that Sonae SR entered 5 new countries in 2014: Bulgaria and Mozambique with the MO format, Chile, Georgia and Armenia with the Zippy format.
Million euros 2013 2014 % of Turnover
Sonae Retail 164 194 4.0%
Sonae MC 103 105 3.0%
Sonae SR 32 63 4.9%
Sonae RP 29 27 21.0%
Underlying EBITDA - Capex 209 179 -
Capex per business
40
118
36
271
465
40
121
41
276
478
ContinenteHyper
C. ModeloSupers
C. Bom DiaSupers
Other Total CompanyOperated
2013 2014
2013 2014 2013 2014
Worten 179 181 706 677
Sport Zone 76 77 838 836
MO 108 108 509 506
Zippy 38 38 328 329
Worten 44 47 1,912 1,626
Sport Zone 34 34 1,174 1,065
Zippy 40 35 308 294
Turkey Zippy 2 2 340 254
401 404 642 629
120 118 1,142 1,046
521 522 757 723
Portugal
International
Company Operated
Portugal
Spain
Stores Sqm/storeCountry Business
2013 2014 2013 2014
Worten 4 4 433 433
Sport Zone 2 3 623 546
MO 5 5 299 299
Sport Zone 0 1 - 289
MO 9 8 402 407
MO 3 3 254 237
Zippy 3 3 203 173
MO 0 2 - 364
Zippy 32 44 237 223
11 12 407 406
47 61 268 251
58 73 294 277
International
Total Franchising
Malta
Portugal
Other
countries
Portugal
Spain
Stores Sqm/storeCountry Business

Page 9 of 20 11.03.2015
4 INVESTMENT MANAGEMENT RESULTS
Turnover and underlying EBITDA – yearly performance
Investment Management turnover reached 252 M€ in 2014, 13.1% above 2013. Top line performance has partially benefited from the increase of 12.7%3 at the SSI division. On a quarterly basis, Investment Management turnover increased 11.9%, to 66 M€. Investment Management underlying EBITDA totalled 19 M€, a growth of 28.1% when compared to 2013, corresponding to an underlying EBITDA margin of 7.5% in 2014 (and 11.6% in 4Q14).
During 2014, the SSI unit continued to pursue its strategy of active portfolio management. In July 2014, Sonaecom acquired a 60% participation of S21Sec, a Madrid-based multinational company specialised in cyber security services. S21Sec is still undergoing a turnaround process but is showing very positive signs. Also, in September 2014, Sonaecom announced the sale of the total share capital of Mainroad to NOS.
WeDo Technologies continued to expand its international presence, ending 2014 with international turnover representing 74.8% of total turnover. According to a new report from Stratecast | Frost & Sullivan, WeDo Technologies was recognised, already in January 2015, as the global market share leader by earned revenue for the Financial Assurance software solution market.
Another important milestone in the SSI business is related to Saphety. The company’s customer base has now over 8,100 customers and 100,000 users in about 20 countries worldwide. Concerning Bizdirect, the company increased turnover by 20.2% in 2014 when compared to 2013. International revenues increased significantly and are already representing 12.2% of turnover.
As regards retail technology businesses, in 2Q14 Sonae concluded an investment in Movvo (ex-Around Knowledge), a Portuguese startup company that developed a proprietary tagless real time location technology. This technology allows the flow of people in physical spaces to measure and provide relevant information for retailers. Also, Tlantic fueled top line mainly due to the increased contribution from clients outside the Group.
Investment Management partnerships were able to deliver good operational performance in this quarter:
(i) MDS presented the strongest quarter of the year both in Portugal and Brazil, growing gross revenues and EBITDA when compared to 2013;
(ii) Maxmat increased LfL sales by 7% and EBITDA by 4% against 2013; and,
(iii) GeoStar gained market share4 during the year (1.7% increase in BSP sales versus a market decrease of 1.2%), and more than doubled its EBITDA y.o.y..
3 Includes Mainroad contribution. 4 BSP refers to IATA Billing and Settlement plan.
WeDo Technologies Bizdirect
Saphety S21Sec
Tlantic1 Movvo
MDS GeoStar2
Maxmat1 Público
Partnerships
Investment Management portfolio
Software and Systems Information unit from Sonaecom
Retail technology
(1) Sonae holds 50% of Maxmat and 77.7% of Tlantic and adopts the fullconsolidation method to report i ts results
(2) GeoStar is reported using the equity method.
Million euros 2013 2014 y.o.y. 4Q13 4Q14 y.o.y.
Turnover 223 252 13.1% 59 66 11.9%
Underlying EBITDA 15 19 28.1% 7 8 8.5%
Underlying EBITDA
margin 6.6% 7.5% 0.9 p.p. 12.0% 11.6% -0.4 p.p.
Turnover and underlying EBITDA
223
252
6.6%7.5%
2013 2014
Turnover Underlying EBITDA margin
+ 13.1%

Page 10 of 20 11.03.2015
5 SONAE SIERRA RESULTS
LfL tenant sales in Europe increased by 3.3%, 4.8 p.p. above 2013. Despite this improvement on a comparable basis, tenant sales decreased 3.0% to 3,119 M€ driven by the sale of assets (namely Parque Principado in Spain in October 2013, Valecenter and Airone in Italy in December 2013, 40% of Sonae Sierra ownership in Le Terrazze Shopping Centre also in Italy in July 2014 and La Farga Shopping Centre in Spain in November 2014). In Brazil, LfL tenant sales reached 8.4%, 3.3 p.p. above 2013 and the total tenant sales grew 16.6% y.o.y., in local currency due to the openings in 2013. In 2014, Sonae Sierra occupancy rate registered an improvement of 1.1 p.p., totaling 95.5%. This result proves, once again, the benchmark quality of Sonae Sierra assets. In Europe, the occupancy rate reached 95.7% impacted by the improved macroeconomic conditions as well as our performance in terms of asset management. Furthermore, the occupancy rate in Brazil improved 3.0 p.p. reaching 95.1%. This result was driven by the higher occupancy rate of the 2 Shopping centres opened in 2013 (Boulevard Londrina in May 2013 and Passeio das Águas in October 2013), which in their year of inaugurations had lower occupancy rates. Sonae Sierra turnover reached 225 M€, 1.2% below the value achieved in 2013. This reduction is explained by the sale of assets in Europe and the adverse currency exchange effect (from the Brazilian real), despite the higher turnover on a comparable basis. As a consequence of the turnover evolution, EBITDA stood at 108 M€, 5.0% below 2013, corresponding to an EBITDA margin of 47.8%. As a result of the above mentioned sale of assets and the adverse currency exchange effect, direct results stood at 53 M€, 5 M€ below 2013. The indirect results reached 44 M€ in 2014, which compares with the negative 54 M€ recorded in 2013. This improvement was driven not only by the yields compression, mostly in Iberia, but also by the positive evolution of the operational performance. As such, net results amounted to 96 M€ in 2014, 92 M€ above 2013. On 31st December 2014, the OMV (Open Market Value) attributable to Sonae Sierra was 2.080 bn€, 3 M€ below 2013 year-end, benefiting with the investment properties value increase and the acquisition of an additional stake in CCC Portimão and AlbufeiraShopping that almost compensated the sale of assets. NAV (Net Asset Value) stood at 1.115 bn€ at the end of 2014, 115 M€ or 11.4% above December 2013. At the end of December 2014 the loan-to-value ratio remained at a conservative level of 41.5%.
Operational indicators
2013 2014 y.o.y.
Footfall (million visitors) 406 440 8.4%
Europe & New Markets 303 329 8.5%
Brazil 102 111 8.1%
Ocuppancy rate (%) 94.4% 95.5% 1.1 p.p.
Europe 95.2% 95.7% 0.5 p.p.
Brazil 92.1% 95.1% 3.0 p.p.
Like-for-Like (LfL) tenant sales
Europe -1.5% 3.3% 4.8 p.p.
Brazil (local currency) 5.1% 8.4% 3.3 p.p.
Tenant sales (million euros) 4,623 4,617 -0.1%
Europe (million euros) 3,217 3,119 -3.0%
Brazil (million euros) 1,406 1,498 6.5%
Brazil (million reais) 4,009 4,673 16.6%
Nº of shopping centres owned/co-
owned (EOP)47 46 -1
Europe 37 36 -1
Brazil 10 10 0
GLA under Management ('000 sqm) 2,303 2,307 0.1%
Europe & New Markets 1,785 1,788 0.2%
Brazil 519 519 0.0%
Million euros 2013 2014 y.o.y. 4Q13 4Q14 y.o.y.
Turnover 228 225 -1.2% 62 62 -0.9%
EBITDA 113 108 -5.0% 30 30 -0.7%
EBITDA margin 49.6% 47.8% -1.9 p.p. 47.7% 47.8% 0.1 p.p.
Direct results 58 53 -8.6% 15 17 11.8%
Indirect results -54 44 - -16 20 -
Net results 4 96 - -1 37 -
… atributable to Sonae 2 48 - -1 18 -
Financial indicators
bill ion euros
Open Market Value (OMV) and leverage
2.152 2.083 2.080
43% 44% 42%
OMV atributable to Sonae Sierra Loan-to-value
2012 2013 2014

Page 11 of 20 11.03.2015
6 NOS RESULTS
NOS market performance
NOS published its 2014 results on February 26th 2015, which are available at www.nos.pt.
NOS operating revenues reached in 2014 1,384 M€, less 3.0% when compared to 2013.
EBITDA reached 511 M€, decreasing 4.9% when compared to 2013 and representing a 36.9% EBITDA margin.
Recurrent CAPEX amounted to 276 M€ in 2014, an increase of 5.5% y.o.y.. As a consequence of EBITDA and CAPEX evolution, EBITDA-Recurrent CAPEX decreased 14.7%.
Net financial debt to EBITDA stood at 1.9x at the end of 2014.
At the end of 2014, the average maturity of the company’s net financial debt is 2.6 years.
The 4Q14 was the strongest quarter ever for RGU growth, with net adds amounting to 165 thousand. Convergent RGUs are already representing 29.2% of the fixed customer base, 385 thousand customers, a little over a year since mobile and fixed bundles were first launched. RGU growth is leading to a significant uplift in residential fixed access ARPU, which grew by 4.7% y.o.y..
Subsequent to the merger between Optimus and Zon (currently NOS), and since the day in which new shares issued were listed on September 9th 2013, and until December 31st 2014, the company’s market capitalisation grew 22.6%, corresponding to a share price increase from 4.27€ to 5.24€. The PSI20, the main Portuguese index, decreased its market capitalisation 19.3% in the same period.
Million euros 2013 PF 2014 y.o.y. 4Q13 PF 4Q14 y.o.y.
Operating revenues 1,427 1,384 -3.0% 356 354 -0.7%
EBITDA 537 511 -4.9% 118 114 -4.0%
EBITDA margin 37.6% 36.9% -0.7 p.p. 33.2% 32.1% -1.1 p.p.
Net results 63 75 17.8% -13 12 -
Capex 270 374 38.9% 81 143 76.7%
EBITDA - Capex 267 136 -49.0% 38 -29 -
Recurrent Capex 261 276 5.5% 77 83 7.9%
EBITDA-Recurrent Capex 275 235 -14.7% 41 30 -26.5%
Financial Indicators - Pro-forma Results
('000) 2013 2014 y.o.y. 4Q13 4Q14 y.o.y.
Total RGUs (Net adds) -144 398 - -41 165 -
Convergent RGUs (Net adds) 212 1,641 - 141 366 159.5%
Mobile (Net adds) -62 400 - 5 107 -
Pay TV (Net adds) -76 -41 45.5% -28 7 -
Total RGUs 212 1,853 - 212 1,853 -
Convergent RGUs 212 1,853 - 212 1,853 -
Convergent costumers 45 385 - 45 385 -
ARPU/Unique subscriber
with fixed access (euros)36 38 4.7% 36 40 9.8%
Operational Indicators
75
85
95
105
115
125
135
NOS PSI20
D = + 22.6%
D = - 19.3%

Page 12 of 20 11.03.2015
7 OVERALL PERFORMANCE
In 2014, consolidated turnover grew 3.2% to 4,974 M€, and underlying EBITDA reached 380 M€, posting an increase of 0.6% when compared to 2013. The improved profitability of Sonae SR, Sonae RP and Investment Management divisions was sufficient to compensate the negative impact of Sonae MC, resulting from the stronger promotional activity. Underlying EBITDA margin reached 7.6%, a value that compares with 7.8% registered in 2013.
The EBITDA amounted to 417 M€, comprised of the following:
(i) underlying EBITDA of 380 M€; (ii) equity method results of 42 M€, including Sonae Sierra
direct results, as well as NOS and GeoStar contributions; and,
(iii) non-recurrent items.
Net financial activity totalled negative 77 M€ in 2014, improving 5.8% when compared to 2013, backed by a combination of a lower net debt level and a lower cost of debt. It should be noted that financial results are only related to Retail and Investment Management businesses. The average interest rate of outstanding credit facilities at the end of 2014 was around 3%.
In 2014, direct results reached 127 M€, 4.4% above 2013 and benefiting from the lower level of net financial activity (-5 M€ vs. 2013) and taxes (-5 M€ vs. 2013), which more than compensated the lower equity method results.
Excluding the merger effects between Optimus and Zon, as well as the impairments recorded in 3Q13, indirect results reached 19 M€ in 2014, almost in line with the 20 M€ posted in 2013(5). This performance is benefiting from the upward revaluation of Sonae Sierra assets, which has also been impacted by the NOS mark to market effect.
Non-controlling interests reached negative 2 M€. This line was impacted by the change in the participation at Sonaecom’s capital. Net income attributable to the Group totalled 144 M€, growing 11.2% against 2013(5) and benefiting from the performance of direct and indirect results.
Million euros 2013 PF 2014 y.o.y. 4Q13 PF 4Q14 y.o.y.
Sonae MC 3,415 3,461 1.3% 924 924 0.0%
Sonae SR 1,210 1,290 6.6% 383 376 -1.8%
Sonae RP 124 126 1.9% 31 32 1.4%
Investment management 223 252 13.1% 59 66 11.9%
E&A (1) -151 -155 -2.2% -43 -33 21.7%
Turnover 4,821 4,974 3.2% 1,354 1,364 0.7%
Sonae MC 258 241 -6.8% 75 70 -7.7%
Sonae SR 0 15 - 17 18 5.5%
Sonae RP 115 116 1.6% 31 31 -0.3%
Investment management 15 19 28.1% 7 8 8.5%
E&A (1) -10 -12 -12.2% -11 -6 43.8%
Underlying EBITDA 378 380 0.6% 120 120 0.4%
Underlying EBITDA margin 7.8% 7.6% -0.2 p.p. 8.8% 8.8% 0.0 p.p.
Equity method results (2) 45 42 -6.6% 4 8 98.6%
o.w. S. Sierra (diret results) 29 26 -8.6% 7 8 12.0%
o.w. NOS 17 16 -7.4% -3 0 82.5%
Non-recurrent items -2 -5 -189.5% -2 -5 -155.8%
EBITDA 421 417 -1.0% 122 124 1.3%
EBITDA margin 8.7% 8.4% -0.4 p.p. 9.0% 9.1% 0.1 p.p.
D&A (3) -188 -189 -0.1% -42 -57 -36.2%
EBIT 233 228 -1.9% 80 67 -16.9%
Net financial activity -82 -77 5.8% -17 -19 -13.9%
EBT 151 151 0.2% 63 47 -25.4%
Taxes -30 -25 16.7% -18 -13 31.7%
Direct results (4) 121 127 4.4% 45 35 -22.8%
Indirect results 289 19 -93.5% 0 14 -
Net income 410 146 -64.5% 45 48 8.2%
Non-controlling interests -132 -2 98.7% -8 0 -
Net income group share 278 144 -48.3% 36 49 33.8%
Indirect results (5) 20 19 -4.3% - - -
Net income (5) 141 146 3.2% - - -
Non-controlling interests (5) -12 -2 85.6% - - -
Net income group share (5) 129 144 11.2% - - -
Consolidated results
(1) Eliminations & adjustments;(2) Equity method results: includes direct income related to investments consolidated by the equity method (mainly SonaeSierra and NOS);(3) Depreciations & amortizations including provisions & impairments;(4) Direct results before non-controlling interests;(5) Excluding Zon-Optimus merger effects and Impairments booked in 3Q13.

Page 13 of 20 11.03.2015
8 CAPITAL STRUCTURE
Total shareholders’ funds amounted to 1,854 M€ in 2014, 54 M€ below 2013, due to a reduction in minorities following the increase in the participation at Sonaecom’s share capital.
Sonae continued strengthening its balance sheet, presenting, in 2014, an average book value gearing of 0.8x. Average gearing at market value stood at 0.6x, improving 0.5x when compared with 2013.
On 31st December 2014, total net debt reached 1,251 M€, increasing 32 M€ when compared to 2013, and impacted by the payment of Sonaecom shares to FT, which occurred in August. If we exclude this payment, total net debt would have reduced by 73 M€, continuing the decreasing trend over the last quarters.
The commitment to FT has been reflected in Sonae consolidated accounts since June 2013 under “other creditors”, but was not qualified as financial debt.
Regarding the debt maturity profile, during 2014 Sonae completed a number of financing transactions with maturities up to 7 years. These operations enabled Sonae to anticipate, under favourable conditions, the refinancing programme of the credit facilities maturing in 2015, as well as a significant part of the credit facilities maturing in 2016. Besides optimising the cost of funding and smoothing the amortisation profile, Sonae was able to diversify its banking pool.
In 2014, retail net debt reduced 80 M€ to 683 M€, driven by sustainable cash flow generation over the last 12 months. Retail total net debt to EBITDA reached 1.8x at the end of 2014, providing evidence of Sonae solid capital structure.
At the end of December 2014, holding net debt reached 523 M€. The loan-to-value ratio of the holding remained stable when compared to December 2013, registering a conservative level of 11%.
Net invested capital
Million euros 2013 2014 y.o.y.
Net invested capital 3,127 3,105 -0.7%
Technical investment 2,031 2,034 0.1%
Financial investment 1,364 1,279 -6.2%
Goodwill 610 611 0.1%
Working capital -878 -819 6.7%
Total shareholders funds 1,908 1,854 -2.9%
Total net debt(1) 1,219 1,251 2.6%
Net debt / Invested capital 39.0% 40.3% 1.3 p.p.
(1) Financial net debt + net shareholder loans.
Gearing
2012
1.3x
1.0x
0.8x
2.1x
1.1x
0.6x
avg gearing (book value) avg gearing (mkt value)
2013 2014
Net debt
Million euros 2013 2014 y.o.y.
Net financial debt 1,214 1,248 2.8%
Retail units 763 683 -10.5%
Investment management 30 42 39.9%
Holding & other 421 523 24.1%
Total net debt 1,219 1,251 2.6%
Capital Structure - Retail
Net debt to EBITDA
2014
2.4
2.0
1.8
2012 2013
Capital StructureLoan-to-value (%) - Holding
2012 2013 2014
17%
10% 11%

Page 14 of 20 11.03.2015
9 CORPORATE INFORMATION
Main corporate events in 4Q14
On October 24th 2014, Well’s opened its first store under franchising agreement in Largo do Rato (Lisbon). Well’s stores in this format benefit from information systems that are integrated within Sonae, which facilitates the management and business logistics for the partner and allows the business owners and their teams to focus their attention on the service provided.
On October 27th 2014, Sonae SR announced its entrance to the Chilean market, thus strengthening its international expansion. Sonae signed an agreement with the Phoenix Group to open five Zippy stores under franchising agreement.
On November 18th 2014, Sonae Sierra and McArthurGlen signed an agreement to develop a Designer Outlet in the southern Spanish city of Malaga. McArthurGlen Designer Outlet Málaga, a 115 M€ development, will be the first designer outlet in southern Spain, with 30,000 sqm of gross lettable area once fully opened.
On November 19th 2014, Sierra Fund and the Retail Property Fund Iberica (RPFI) sold the La Farga Shopping Centre (Hospitalet de Llobregat, Barcelona) to Temprano Capital Partners. In the purchase and sale agreement, the parties agreed not to disclose the sale price, for confidentiality reasons.
Subsequent information
On 21st January 2015, Sonae Sierra strengthened its professional services business for third parties by celebrating new contracts for the leasing and management of three shopping centres in Hamburg. The company will be responsible for the management and leasing of Union Investment’s shopping centres Quarrée Wandsbek-Markt, Mercado and Geschäftshaus Ottensen in Hamburg.
On 23rd February 2015, MO launched its e-commerce platform. Like the Zippy products, MO products became available online. The partnership with the Continente loyalty card is maintained in case of online sales. On 9th March 2015, Sonae received a letter from Efanor Investimentos, announcing Mr. Belmiro Mendes de Azevedo decision of not being a candidate to the membership of Sonae’s Board of Directors that will be elected at Sonae’s next Annual General Meeting. The same letter mentioned that taking into full consideration the duties of Sonae’s Board of Directors and its legal and statutory autonomy regarding the appointment of its Chairman and CEO, it will be proposed to the elected Board of Directors that Duarte Paulo Teixeira de Azevedo should be appointed as Chairman and co-CEO and that Ângelo Gabriel Ribeirinho dos Santos Paupério should be appointed as co-CEO in order to ensure that the company continues to follow a management philosophy that is coherent with that which was carried out until now, in close cooperation with its shareholders’ strategic interests.

Page 15 of 20 11.03.2015
10 OUTLOOK AND DIVIDEND PROPOSAL
Outlook for 2015
In 2015, we expect a consolidation of the improving growth trend in Portugal and an acceleration of economic growth in Spain. However, both countries are still recovering from a deep economic crisis and we are aware of internal vulnerabilities. Nevertheless, we believe in a cautiously positive outlook for the Iberian economies in 2015 with expected private consumption increases benefiting not only the retail but also the Shopping Centre business. As far as the global economy is concerned, we believe it might benefit from the accelerated growth in developed countries, coupled with the expected fall in oil price. In food retail business, price deflation was significantly reduced in the last quarter of the year and we expect a more favourable 2015, with a rational pricing evolution. We are confident that in 2015 Sonae MC will reinforce its leading market position, continuing to benefit from logistical, operational and promotional efficiencies and maintaining the benchmark levels of profitability. In Sonae SR, we expect to improve our top line performance, benefiting from the macroeconomic conditions. For 2015, besides strengthening our leading position in Portugal, we expect to speed up the recovery of our businesses in the Spanish market, while continuing International expansion through a capital light approach. Sonae RP will continue to support the growth of retail operations and the quality of its assets. Sonae RP is facing increased interest in its assets. As such, we continue to examine options around releasing capital from our mature real estate assets within Sonae RP. This includes a range of potential strategic options including, among others, the sale and leaseback of asset(s) to third parties across a range of potential markets. In the case of our core partnerships, Sonae Sierra will continue following its strategy of recycling capital and development of property management services. We believe that the positive operational trend continues with
Sonae Sierra benefiting from the expected increase in private consumption. In 2015, we believe that NOS will further strengthen its leading position in the convergent telecommunications market. As a group, always keeping as a priority the sustainability of our core businesses, we will go on leveraging our competencies of developing products and brands, while exploring international opportunities focusing on a capital light approach.
Proposed distribution of dividends
In view of the net results for the financial year 2014, the Board of Directors will propose at the Shareholders’ Annual General Meeting the payment of a gross dividend of 0.0365 euros per share, 5% above the dividend distributed in the previous year. This dividend corresponds to a dividend yield of 3.6%, based on the closing price as at December 31st 2014, and to a payout ratio of 58% of the consolidated direct income attributable to equity holders of Sonae.

Page 16 of 20 11.03.2015
11 ADDITIONAL INFORMATION
Methodological notes
The consolidated financial information contained in this report was prepared in accordance with International Financial Reporting Standards (“IFRS”), as adopted by the European Union. The financial information regarding quarterly and semi-annual figures was not subject to audit procedures.
Glossary
CAPEX Investments in tangible and intangible assets and investments in acquisitions.
Direct results Results excluding contributions to indirect results.
(Direct) EBIT Direct EBT - financial results.
EBITDA Underlying EBITDA + equity method results (Sonae Sierra direct results, NOS and Geostar) + non-recurrent items.
EBITDA margin EBITDA / Turnover.
(Direct) EBT Direct results before non-controlling interests and taxes.
Eliminations & adjustments
Intra-groups + consolidation adjustments + contributions from other companies not included in the identified segments.
EoP End of period.
Free Cash Flow (FCF) EBITDA - operating CAPEX - change in working capital -financial investments - financial results - income taxes.
Financial net debt Total net debt excluding shareholders loans.
FMCG Fast-Moving Consumer Goods.
Gearing (book value) Average of last four quarters considering, for each quarter, total net debt (EoP) / total shareholders' funds (EoP).
Gearing (market value)
Average of last four quarters considering, for each quarter, total net debt (EoP) / equity value considering closing price of Sonae shares at the last day of each quarter.
GLAs Gross Lettable Area: equivalent to the total area available to be rented in the shopping centres.
Indirect results
Includes Sonae Sierra’s results, net of taxes, arising from: (i) investment property valuations; (ii) capital gains (losses) on the sale of financial investments, joint ventures or associates; (iii) impairment losses of non-current assets (including goodwill) and (iv) provision for assets at risk. Additionally and concerning Sonae’s portfolio, it incorporates: (i) impairments in retail real estate properties; (ii) reductions in goodwill; (iii) provisions (net of taxes) for possible future liabilities and impairments related with non-core financial investments, businesses, assets that were discontinued (or in a process of being discontinued/repositioned); (iv) results from “mark to market” methodology of other current investments that will be sold or exchanged in the near future; and (v) other non-relevant issues.
Page 17 of 20 11.03.2015
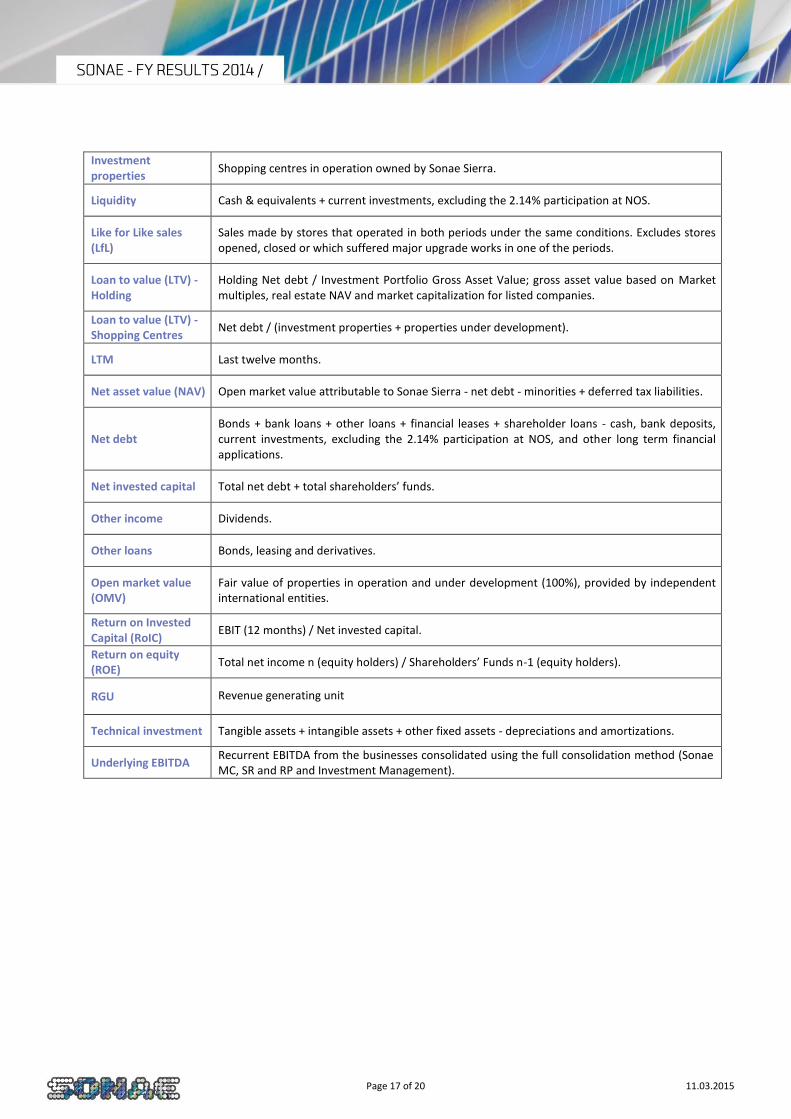
Investment properties
Shopping centres in operation owned by Sonae Sierra.
Liquidity Cash & equivalents + current investments, excluding the 2.14% participation at NOS.
Like for Like sales (LfL)
Sales made by stores that operated in both periods under the same conditions. Excludes stores opened, closed or which suffered major upgrade works in one of the periods.
Loan to value (LTV) - Holding
Holding Net debt / Investment Portfolio Gross Asset Value; gross asset value based on Market multiples, real estate NAV and market capitalization for listed companies.
Loan to value (LTV) - Shopping Centres
Net debt / (investment properties + properties under development).
LTM Last twelve months.
Net asset value (NAV) Open market value attributable to Sonae Sierra - net debt - minorities + deferred tax liabilities.
Net debt Bonds + bank loans + other loans + financial leases + shareholder loans - cash, bank deposits, current investments, excluding the 2.14% participation at NOS, and other long term financial applications.
Net invested capital Total net debt + total shareholders’ funds.
Other income Dividends.
Other loans Bonds, leasing and derivatives.
Open market value (OMV)
Fair value of properties in operation and under development (100%), provided by independent international entities.
Return on Invested Capital (RoIC)
EBIT (12 months) / Net invested capital.
Return on equity (ROE)
Total net income n (equity holders) / Shareholders’ Funds n-1 (equity holders).
RGU Revenue generating unit
Technical investment Tangible assets + intangible assets + other fixed assets - depreciations and amortizations.
Underlying EBITDA Recurrent EBITDA from the businesses consolidated using the full consolidation method (Sonae MC, SR and RP and Investment Management).

Page 18 of 20 11.03.2015
Consolidated Profit and Loss Account
Consolidated profit and loss account
Million euros 2013 PF 2014 y.o.y. 4Q13 PF 4Q14 y.o.y.
Turnover 4,821 4,974 3.2% 1,354 1,364 0.7%
Underlying EBITDA 378 380 0.6% 120 120 0.4%
Underlying EBITDA margin 7.8% 7.6% -0.2 p.p. 8.8% 8.8% 0.0 p.p.
EBITDA 421 417 -1.0% 122 124 1.3%
EBITDA margin 8.7% 8.4% -0.4 p.p. 9.0% 9.1% 0.1 p.p.
Depreciations & amortizations (1) -188 -189 -0.1% -42 -57 -36.2%
EBIT 233 228 -1.9% 80 67 -16.9%
Net financial activity -82 -77 5.8% -17 -19 -13.9%
Other items (2) 0 0 57.9% 0 0 -
EBT 151 151 0.2% 63 47 -25.4%
Taxes -30 -25 16.7% -18 -13 31.7%
Direct results 121 127 4.4% 45 35 -22.8%
Indirect results (3) 289 19 - 0 14 -
Net income 410 146 - 45 48 8.2%
Minority interests -132 -2 - -8 0 -
Net income group share 278 144 - 36 49 33.8%
(1) Includes provisions, impairments, reversion of impairments; (2) dividends; (3) Includes: (i) Sonae’s Sierra indirect income contribution; (ii)the capital gain with NOS merger; (iii) other asset provisions for possible future liabilities in non-core and/or discontinued operations and (iv)
non-cash impairments for operational assets.

Page 19 of 20 11.03.2015
Consolidated Statement of Financial Position
Million euros 2013 2014 y.o.y.
TOTAL ASSETS 5,477 5,578 1.9%
Non current assets 3,973 4,017 1.1%
Tangible and intangible assets 2,030 2,033 0.1%
Goodwill 610 611 0.1%
Other investments 1,178 1,234 4.8%
Deferred tax assets 123 90 -27.0%
Others 32 50 55.7%
Current assets 1,503 1,561 3.8%
Stocks 589 603 2.4%
Trade debtors 78 80 1.6%
Liquidity 366 589 60.7%
Others 470 290 -38.4%
SHAREHOLDERS' FUNDS 1,908 1,854 -2.9%
Equity holders 1,564 1,693 8.3%
Attributable to minority interests 344 161 -53.3%
LIABILITIES 3,568 3,725 4.4%
Non-current liabilities 1,586 1,082 -31.8%
Bank loans 241 284 17.9%
Other loans 1,121 623 -44.5%
Deferred tax liabilities 121 94 -22.1%
Provisions 51 36 -28.0%
Others 51 44 -14.0%
Current liabilities 1,983 2,643 33.3%
Bank loans 66 114 73.1%
Other loans 168 832 -
Trade creditors 1,162 1,151 -1.0%
Others 587 545 -7.0%
SHAREHOLDERS' FUNDS + LIABILITIES 5,477 5,578 1.9%
Consolidated statement of financial position

Page 20 of 20 11.03.2015
Report available at Sonae’s institutional website www.sonae.pt
Media and Investor Contacts
Patrícia Vieira Pinto
Head of Investor Relations [email protected]
Tel.: + 351 22 010 4794
Catarina Oliveira Fernandes Head of Communication, Brand and Corporate Responsibility
[email protected] Tel: + 351 22 010 4775
Rita Barrocas
External Communication [email protected]
Tel: + 351 22 010 4745
Sonae Lugar do Espido Via Norte
4471-909 Maia Portugal
Tel.: +351 22 948 7522 Fax: +351 22 940 4634
SAFE HARBOUR
This document may contain forward-looking information and statements, based on management’s current expectations or beliefs. Forward-looking statements are statements that should not be regarded as historical facts.
These forward-looking statements are subject to a number of factors and uncertainties that could cause actual results to differ materially from those described in the forward-looking statements, including, but not limited to, changes in regulation, industry and economic conditions; and the effects of competition. Forward-looking statements may be identified by words such as “believes,” “expects,” “anticipates,” “projects,” “intends,” “should,” “seeks,” “estimates,” “future” or similar expressions. Although these statements reflect our current expectations, which we believe are reasonable, investors and analysts, and generally all recipients of this document, are cautioned that forward-looking information and statements are subject to various risks and uncertainties, many of which are difficult to predict and generally beyond our control, that could cause actual results and developments to differ materially from those expressed in, or implied or projected by, the forward-looking information and statements. You are cautioned not to put undue reliance on any forward-looking information or statements. We do not undertake any obligation to update any forward-looking information or statements.
SONAE is listed on the Euronext Stock Exchange. Information may also be accessed on Reuters under the symbol SONP.IN and on Bloomberg under the symbol SONPL