1 health care access, cost, and quality health care access, cost, and quality (what we don’t know...
TRANSCRIPT

1
Health Care Access, Health Care Access, Cost, and QualityCost, and Quality
(What we don’t know can hurt us)
Doug Hall NH Center for Public Policy Studies
New Hampshire Public Health Association
October 29, 2004
With generous support from

2
All of our reportsare available on the web:
www.nhpolicy.orgwww.nhpolicy.org
New Hampshire Center New Hampshire Center for Public Policy Studiesfor Public Policy Studies
Board of Directors
Martin L. Gross, Chair
John B. Andrews
Cotton M. Cleveland
John D. Crosier
Todd I. Selig
Donna Sytek
Georgie A. Thomas
James E. Tibbetts
Kimon S. Zachos
Co-Directors
Douglas E. Hall
Richard A. Minard, Jr.
“…to raise new ideas and improve policy debates through quality information and analysis on issues shaping New Hampshire’s future.”

3
HYPOTHESIS: The employment-based health insurance system that has been relatively stable for decades, is approaching a “tipping point,” where it may become unstable and could collapse.
1. Rising costs of care lead to rising insurance premiums2. Unable to pay increased premiums, employers increase % of
premiums to be paid by employees or substitute high deductible plans. Some employers may drop coverage altogether.
3. Younger, healthier employees with low medical costs opt out of offered insurance coverage, knowing they are at low risk.
4. Through this adverse selection, older, less healthy employees constitute a larger part of the risk pool, causing average claims/person to rise yet further.
5. Back to step #1. (The positive feedback loop results in rapidly accelerating premiums and numbers of uninsured.)

4
Do you agree ?
• There is already sufficient money in the health care system to provide quality health care for all.
• Less medical care can mean better quality.
• Currently in health care, neither supply nor demand are subject to the market force of price.

5
Access, Cost, and Quality are Interrelated, but How?
We don’t have all the pieces to the puzzle!

6
AccessAccess

7
Common View
Insured Uninsured
Realistic View
Insured for what? drug rehab, prescription drugs, mental health, “experimental” procedures, dental, …
How much annual deductible and out-of-pocket?
Pre-existing conditions

8
Estimated Number of Uninsured NH Residents, 1999-2003
0
10,000
20,000
30,000
40,000
50,000
60,000
70,000
80,000
90,000
100,000
110,000
120,000
130,000
140,000
150,000
1999 2000 2001 2002 2003
Year
Per
son
s
2003 survey funded by Endowment for Health and HNHfoundation
Annual estimates from Current Population Survey of the U. S. Census Bureau indicated by filled central markers
1999 & 2001 surveys funded by NH Department of Health & Human Services
In NH, About 120,000 are Uninsured

9
Percent of Population Uninsured By State, 2003
0%
2%
4%
6%
8%
10%
12%
14%
16%
18%
20%
22%
24%
26%
28%M
inne
sota
Ver
mon
tH
awai
iR
hode
Isla
ndN
ew H
amps
hire
Con
nect
icut
Mai
neM
assa
chus
etts
Mic
higa
nN
orth
Dak
ota
Wis
cons
inK
ansa
sM
isso
uri
Del
awar
eIo
wa
Neb
rask
aP
enns
ylva
nia
Ohi
oS
outh
Dak
ota
Uta
hV
irgin
iaT
enne
ssee
Indi
ana
Mar
ylan
dK
entu
cky
New
Jer
sey
Ala
bam
aD
.C.
Illin
ois
Sou
th C
arol
ina
New
Yor
kW
ashi
ngto
nW
yom
ing
Geo
rgia
Wes
t Virg
inia
Ariz
ona
Col
orad
oO
rego
nN
orth
Car
olin
aA
rkan
sas
Mis
siss
ippi
Flo
rida
Cal
iforn
iaId
aho
Ala
ska
Nev
ada
Mon
tana
Okl
ahom
aLo
uisi
ana
New
Mex
ico
Tex
as
State
Per
cen
t
95% Confidence Intervals displayed
New Hampshire ranked 5th among the 50 states. But confidence intervals of the survey show that it falls somewhere among the 20 states with the lowest rates.

10
Insurance Status of New Hampshire Adults, 2003
0% 10% 20% 30% 40% 50% 60% 70% 80% 90% 100%
insured now and all yearinsured now, but not all yearuninsured now, insured during yearuninsured all year
6% chronically uninsured13% transitionally insured

11
Percentage of Persons Insured & Uninsured by Age Group, 2001
0% 10% 20% 30% 40% 50% 60% 70% 80% 90% 100%
Ag
e G
rou
p
Percentage
Age 0-17
Age 18-24
Age 25-34
Age 35-44
Age 45-54
Age 55-64
Age 65+
Private Health Insurance (primarily employment-based)
PublicInsurance: Medicaid, etc.
Public Insurance: Medicare
Uninsured

12
Applicant Insurance Statusin September 2002
at New Hampshire Hospitals(n=1,147)
55%
44%
1%
Uninsured Insured, but had a Balance Due Unknown
This slide from
Financial Assistance Application StudySeptember 2002

13
Who are Disproportionately Uninsured in NH ?
• Those between ages 18 and 30• Those who have household incomes of less than $30,000• Renters• Self-employed persons• Employees of small businesses (fewer than 50
employees)• Workers in retail, food, or construction industries• Workers who are unemployed, employed only part time,
or employed seasonally• African-Americans and those of Hispanic origin• Adults who are not registered to vote• Singles, living alone• Residents of Coos, Grafton, Carroll, and Sullivan counties;• Those with no education beyond high school or who did
not complete high school

14
What We Don’t Know Can Hurt Us#1
• If the number of people who are uninsured or underinsured begins to grow, how will we know it?
• What is our early warning system?• What health effects will occur and how will
we measure them?• What will be the impact on those still
insured through additional cost-shifting?

15
CostCost

16
Estimated Personal Health Care Spending in NH, 2004(in $ million)
$2,201
$2,104
$415
$175
$931
$83
$533
$188
$438
Hospital Care
Physicians, Clinics, & Other Professional
ServicesDental Services
Home Health Care
Prescription Drugs
Durable Equipment
Nursing Home Care
Other Personal Health Care Total:
$7,068 million
Other Non-durables

17
Projected Personal Health Care Expenditure in NH 2011 (in $ million)
$3,084
$3,248$557
$306
$1,857
$139
$794
$264
$978
Hospital Care
Physicians, Clinics, & Other Professional
Services
Dental Services
Home Health Care
Prescription Drugs
Durable Equipment
Nursing Home Care
Other Personal Health Care
Total:$11,227 million
Other Non-durables

18
Estimated Source of Funds Personal Health Care in US, 2004
Other Public7%
Medicaid18%
Other Private4%
Medicare19%
Insurance36%
Out-of-Pocket16%
Private Sources
Public Sources

19
Personal Health Expenditure per Capita
$0
$2,000
$4,000
$6,000
$8,000
$10,000
$12,000
1975 1980 1985 1990 1995 2000 2005 2010
Year
US
New Hampshire
New Hampshire health spending per capita has closely tracked national averages. Beginning in 1995 it slightly exceeded the national average but projections show it falling back below national average in about 2008.
Projected

20
NH Health Expenditure as % of Gross State Product (GSP)
0%
2%
4%
6%
8%
10%
12%
14%
16%
18%
20%
1975 1980 1985 1990 1995 2000 2005 2010
Year
During recessions, the expansion of the economy slows but growth in health spending continues to grow and it consumes greater portions of the overall GSP.
Estimated Projected

21
Expenditures on Personal Health Care and Public Schools in NH
$0
$1,000
$2,000
$3,000
$4,000
$5,000
$6,000
$7,000
19
75
19
76
19
77
19
78
19
79
19
80
19
81
19
82
19
83
19
84
19
85
19
86
19
87
19
88
19
89
19
90
19
91
19
92
19
93
19
94
19
95
19
96
19
97
19
98
19
99
20
00
20
01
20
02
Year
Mil
lio
ns
of
Do
lla
rs
Personal Health Care Expenditures
Public School Expenditures
Personal health care spending was 166% of public school spending in 1975
Personal health care spending was 325% of public school spending in 2002
22
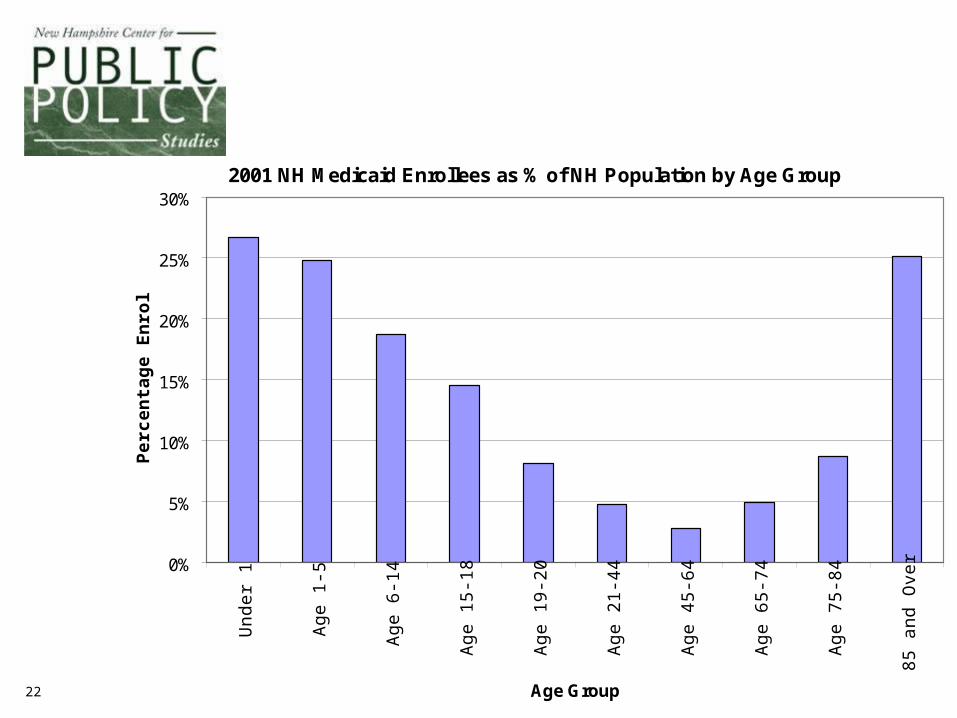
2001 NH Medicaid Enrollees as % of NH Population by Age Group
0%
5%
10%
15%
20%
25%
30%
Un
de
r 1
Ag
e 1
-5
Ag
e 6
-14
Ag
e 1
5-1
8
Ag
e 1
9-2
0
Ag
e 2
1-4
4
Ag
e 4
5-6
4
Ag
e 6
5-7
4
Ag
e 7
5-8
4
85
an
d O
ver
Age Group
Pe
rce
nta
ge
En
roll
ed

23
Medicaid Spending per Enrollee by Age Group, FFY 2001
$0
$2,500
$5,000
$7,500
$10,000
$12,500
$15,000
$17,500
$20,000
$22,500
$25,000
Under 1 Age1-5
Age6-14
Age15-18
Age19-20
Age21-44
Age45-64
Age65-74
Age75-84
Age85 +
Age Group
Ave
rag
e S
pen
din
g p
er E
nro
llee

24
2001 NH Medicaid Enrollees by Eligibility Category
12,833
13,507
66,547
15,675
Children$2,266 per child
Adults$2,336 per
person
Aged$18,182
per person
Disabled$19,727 per person

25
NH Medicaid Spending by Eligibility Category, FFY 2001
$233,326,495
$266,447,475
$150,803,296
$36,611,492
$4,007,029
Children
Adults
Aged
DisabledTotal
$691,195,787
Unknown
Aged and disabled accounted for 72% of the spending

26
Source: Audited financial statements of the hospitals for 2001 and 2002 as provided in spreadsheet form by NH Hospital Association; 4th Quarter, 2002 Trending Report, NH Hospital Association
Revenue/Expense Measure 2001 2002 ChangeInpatent Admissions 124,096 123,764 -0.2%Inpatient Patient-days 543,033 547,094 0.8%
Gross Patient Service Revenue $2,857,633,144 $3,264,893,121 14.3%Charity Care $45,736,960 $61,546,402 34.6%Contractual Allowances $1,077,218,351 $1,276,061,665 18.5%Net Patient Service Revenue $1,734,677,833 $1,927,285,054 11.1%Net Operating Revenue $1,794,578,201 $1,989,630,720 10.9%Bad Debts $96,243,326 $106,671,251 10.8%Total Operating Expense $1,723,705,402 $1,905,109,946 10.5%Net Operating Income $70,872,799 $84,520,774 19.3%
26 NH Acute Care Hospitals
27
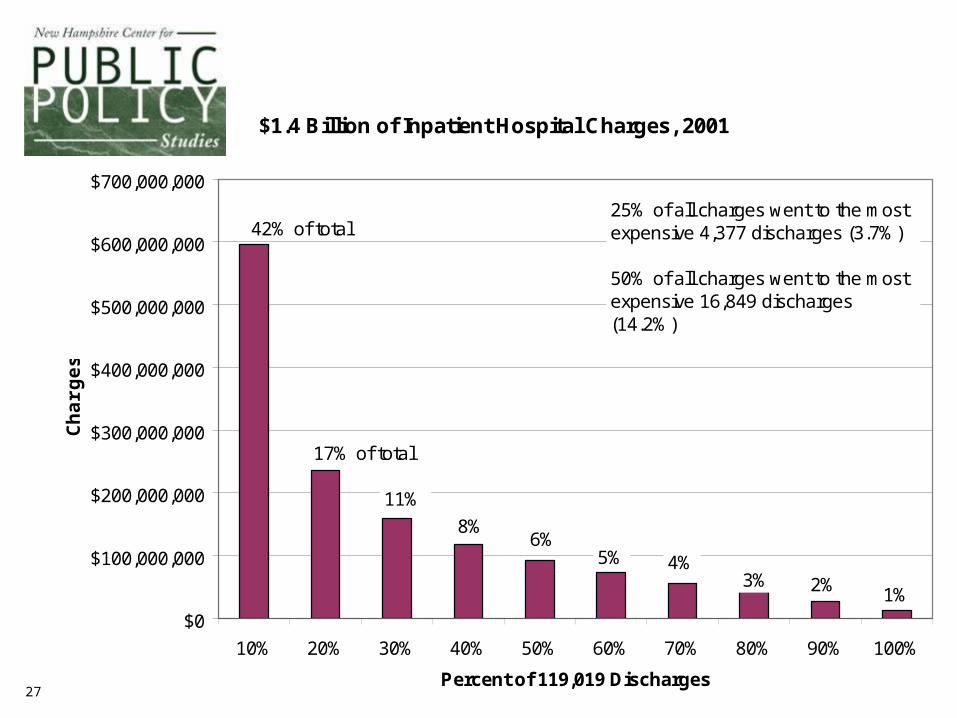
$1.4 Billion of Inpatient Hospital Charges, 2001
$0
$100,000,000
$200,000,000
$300,000,000
$400,000,000
$500,000,000
$600,000,000
$700,000,000
10% 20% 30% 40% 50% 60% 70% 80% 90% 100%
Percent of 119,019 Discharges
Ch
arg
es
42% of total
17% of total
11%
8% 6%
5% 4% 3% 2% 1%
25% of all charges went to the most expensive 4,377 discharges (3.7%)
50% of all charges went to the most expensive 16,849 discharges (14.2%)

28
Cost-Shifting•The allocation of unpaid costs of care delivered to one patient population through above-cost revenue collected from other patient populations.
•For hospitals, nursing facilities and physicians, the historical cause of cost shifting has been below-cost reimbursement rates paid by public programs and uncompensated care losses due to charity care and bad debt.
Source: “Cost Shifting: An Integral Aspect of U.S. Health Care Finance,” The Lewin Group, November 2002

29
NH Hospital Revenue, 2001 (theoretical situation where all payers pay cost + 5% margin)
0%
10%
20%
30%
40%
50%
60%
70%
80%
90%
100%
110%
120%
130%
140%
% of Gross Charges by Payer
% o
f C
os
t P
aid
Third Party / Insurance46%
Self-Pay7%
Medicare40%
Medicaid6%
Other 1%
0% 100%

30
NH Hospital Revenue, 2001(actual)
0%
10%
20%
30%
40%
50%
60%
70%
80%
90%
100%
110%
120%
130%
140%
Percent of Gross Payer Charges
% o
f C
os
t P
aid
Third Party / Insurance46%
Self-Pay2%
Medicare40%
Medicaid6%
Bad Debt & Charity
5%
Base Case
346%
Other 1%
0%

31
NH Hospital Revenue, 2001(actual)
0%
10%
20%
30%
40%
50%
60%
70%
80%
90%
100%
110%
120%
130%
140%
Source of Payment
% o
f C
os
t P
aid
Shortfall of $119 million
Sho
rtfa
ll of
$3
0 M
illio
n
Sho
rtfa
ll of
$86
mill
ion
Suplus of $64 million
Shortfall of $ 2 million
0% 100%
Third Party / Insurance46%
Medicare40%
Medicaid6%
Bad Debt & Charity
5%
Self-Pay2%
Other 1%
Surplus of $134 million

32
Quantifying the 2001 Cost-Shiftin 26 New Hampshire Hospitals
PayerActual
Revenue
Revenue Needed to
Meet Expenses Plus 5% Margin
Excess or(Shortfall)
ShortfallsMedicare $559,189,410 $678,444,353 ($119,254,943)Medicaid $82,259,512 $111,966,988 ($29,707,476)Bad Debt/Charity Care $0 $85,566,423 ($85,566,423)Other $19,864,074 $22,283,430 ($2,419,356)
Total ($236,948,198)
SurplusesInsurance $916,840,046 $782,740,939 $134,099,107Self-Pay $91,660,528 $27,833,046 $63,827,482
Total $197,926,588Remaining shortfall ($39,021,610)
Operating marginTheoretical operating margin 5.0% $81,373,104Actual margin 2.6% $42,351,494Reduced margin $39,021,610

33
Rough estimate of the cost to provide the “missing” health care to those who are currently uninsured
• 2004 health care costs in NH: $7,000 million• Uninsured are 10% of the population• Their “need gap” is mostly for physicians, hospitals, and
prescription drugs (75% of all services)• They are disproportionately younger than the
insured/Medicare population with costs about 67% of the average.
• Uninsured currently receive 60% of the health care of those who are fully insured (self-pay, cost-shifted, and subsidized).
$140 million additional cost
(By way of comparison, the State obtained $205 million net Medicaid enhancement revenue and recoveries in 2003.)
34
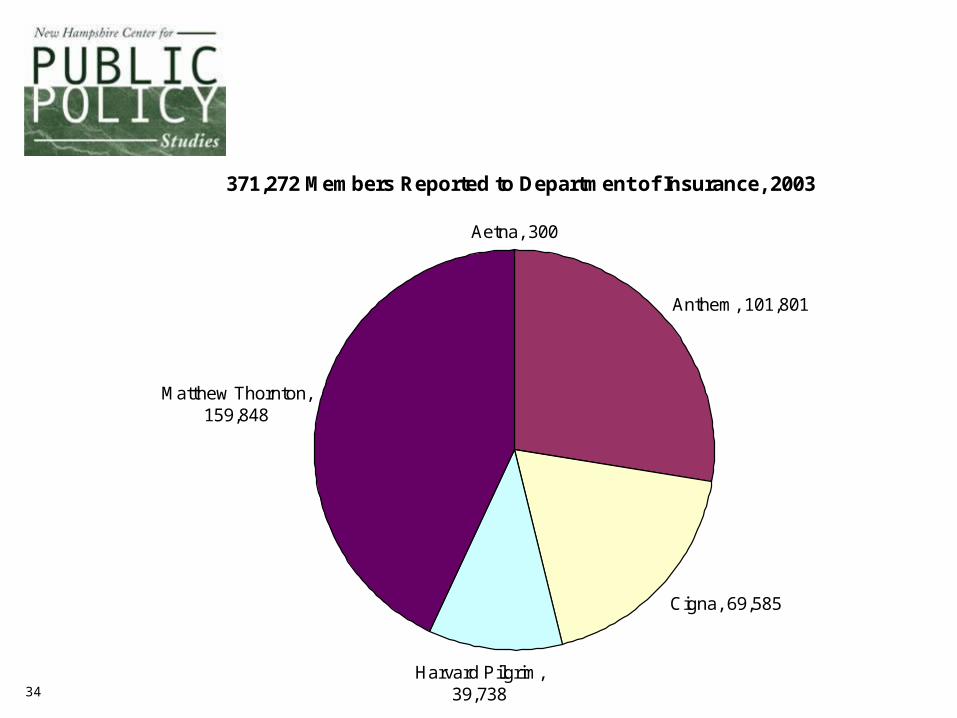
371,272 Members Reported to Department of Insurance, 2003
Aetna, 300
Anthem, 101,801
Cigna, 69,585
Harvard Pilgrim, 39,738
Matthew Thornton, 159,848
35
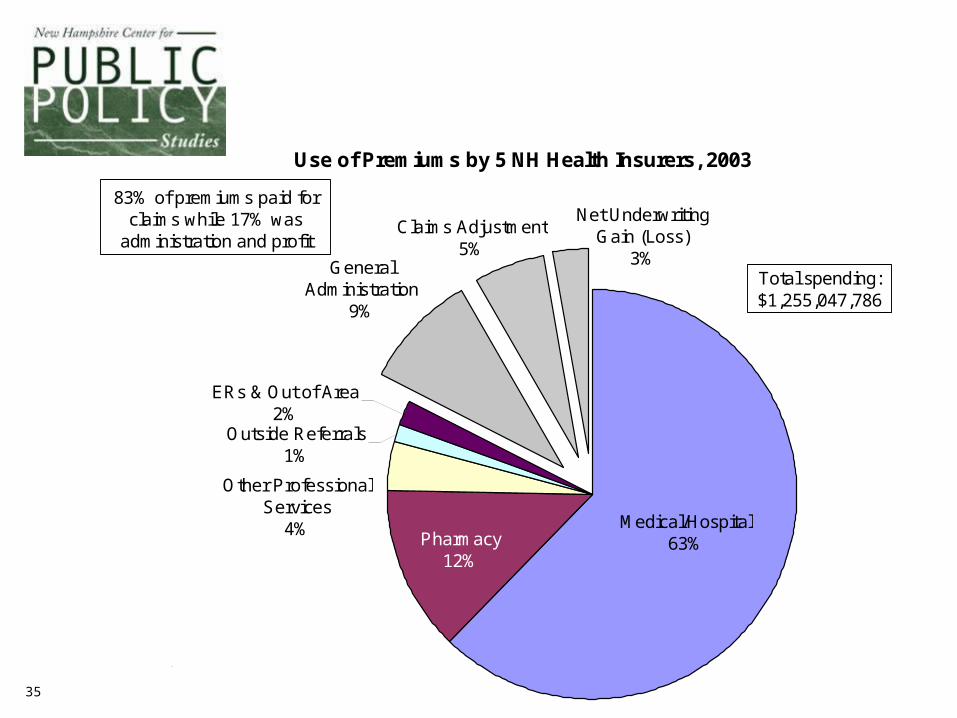
Use of Premiums by 5 NH Health Insurers, 2003
Claims Adjustment5%
Net Underwriting Gain (Loss)
3%General Administration
9%
Outside Referrals1%
ERs & Out of Area2%
Other Professional Services
4%Pharmacy
12%
Medical/Hospital63%
83% of premiums paid for claims while 17% was
administration and profit
Total spending:$1,255,047,786
Based on annual financial reports filed with NH Department of Insurance

36
2001 2002 2003% change in 2 years
Member-months 5,280,024 5,290,688 4,936,816 -6.5%
Net Premium Income $1,194,219,196 $1,241,571,726 $1,254,608,757 5.1%Total medical and hospital claims $973,778,586 $1,003,260,608 $1,035,193,680 6.3%Claims Adjustment Expenses $50,160,374 $63,893,427 $68,615,016 36.8%General Administrative Expenses $100,326,769 $107,312,895 $113,653,270 13.3%Net Underwriting Profit (Loss) $56,638,560 $63,051,904 $36,029,896 -36.4%
Per Member YearNet Premium Income $2,714.12 $2,816.05 $3,049.60 12.4%Total medical and hospital claims $2,213.12 $2,275.53 $2,516.26 13.7%Claims Adjustment Expenses $114.00 $144.92 $166.78 46.3%General Administrative Expenses $228.01 $243.40 $276.26 21.2%Net Underwriting Profit (Loss) $128.72 $143.01 $87.58 -32.0%
Underwriting Finances of 5 NH Health Insurers

37
What Did Each $1,000 of Health Insurance Premium Buy in 2002?
Hospitals$338 Hospitals
$287
Physicians/Clinics$266
Physicians/Clinics$226
Prescription Drugs$125
Prescription Drugs$125
Other Providers$70
Provider Cost-shift$103
Net Profit $51
Admin/Claims Processing$120
Admin/Claims Processing$120
Other Providers$82
Net Profit $51
$18 $18
$0
$100
$200
$300
$400
$500
$600
$700
$800
$900
$1,000
By the books With cost-shift squeezed out
Do
llars
State premium tax
$708 paid for health care of
the insured

38
Missing Pieces of the Cost Puzzle
Amounts paid in claims for different service types by employers’ self-insured health benefit plans.
#1

39
Missing Pieces of the Cost Puzzle
List prices of all providers, including hospitals, physician practices, laboratories, outpatient clinics, surgery centers.
#2
40
Actual payment amounts made by insurers to all types of providers under negotiated discounts and contracts.
#3
Missing Pieces of the Cost Puzzle

41
Missing Pieces of the Cost Puzzle
Aggregate costs of private medical practices broken down by standard line item costs and numbers of units of various codes billed that generate offsetting revenue.
#4

42
QualityQualityFrom work by Elliott Fisher, MD, MPH, and others.
See a series of articles in Annals of Internal Medicine, Vol. 138, #4, February 18, 2003 and another series in Health Affairs, Web exclusive edition, October 7, 2004.

• U.S. health care spending would decline by over 30%.
• The projected deficit in the Medicare Trust fund would be postponed by at least 25 years.
• We could send 30% of the U.S. health care workforce to Africa and -- in theory -- improve the health of both continents.
If all regions of the US could adopt the Medicare medical care practice patterns of the lowest spending 1/5 of the US hospital catchment areas, which of the following statements would apply?

In a Veterans’ Administration study, less care was consistent with both better care and better outcomes
• Followed individuals with serious chronic diseases(6 medical conditions, 3 psychiatric conditions)
• Constrained VA hospital use to 50% of previous level
• Clinic visits increased 10%• Visits for urgent care declined• No compensating use of private hospitals
resulted• Survival rates not adversely affected
(for 5 conditions improved significantly, for 4 conditions remained unchanged)

Physicians control or direct about70% of all health care spending
•How soon will a patient return for follow-up?•What drugs will be prescribed?•What imaging should be performed?•When is discharge from a hospital stay ordered?•What diagnostic tests and procedures are
ordered?•What specialists are consulted and how often?•Is the ICU required?
For similar conditions across different regions, practice patterns appear to be driven by supply, not inherent need.

Supply-Sensitive Care : Highest vs Lowest Spending Regions
1.00 1.5 2.00.5 2.5 3.0
1.00 1.5 2.00.5 2.5 3.0
Office Visits
Initial Inpatient Specialist ConsultationsInpatient Visits
Physician Visits
ElectrocardiogramTests and Procedures
Lower in High Spending Regions Higher in High Spending Regions
CT / MRI BrainPulmonary Function TestElectroencephelogram (EEG)
Discharges
Inpatient Days in ICU or CCUTotal Inpatient Days
Hospital Utilization
Feeding Tube PlacementEmergency Intubation
Procedures -- Last 6 months of life

1 Year Mortality Rate of Medicare Beneficiaries by Spending Regions
0
5
10
15
20
25
30
35
Hip fracture Colorectal cancer Acute myocardialinfarction
Medicare beneficiarysurvey
Annals of Internal Medicine, Volume 138, Number 4, February 18, 2003, page 291
N=614,503 N=195,429N=159,393 N=18,190

•Additional resources 60% more spending per capita
•Content of care Less effective careNo additional major surgeryMore supply-sensitive services
•Access to care, satisfaction Slightly worse accessNo greater satisfaction
•Health outcomes No gain in functionMortality slightly higher
•Physician perceptions Quality worseLower career satisfaction
What do higher spending hospital catchment areas of the country get compared to lower spending?
This comparison is after having controlled for inherent regional price differences, average levels of illness, age, sex, race, and socioeconomic conditions.

Qua
lity
of Care
Rank
OR
MN
NH
VTME
IA ND
WIVA
MTDE
WYWA
CO
NCAZ
SD
HI
NE
NMKY
MO
PA
UT
MA CT
NV
KS
ID
RIIN
OHSC
MDMI
NY
WVCA
OK
ALIL
GA
MSAR
NJTX
LA
TN
FL
0
10
20
30
40
50
2000 3000 4000 5000 6000
1995 Per-capita Medicare Expenditures -- Illness Adjusted
Is spending more likely to make things better?

Law of Diminishing Returns
Inputs of Medical Care
Hea
lth
Ben
efit
Overall, we may be in this region of declining benefit from more medical care
51
What We Don’t Know Can Hurt Us#2
• Are these results regarding quality measures unique to the Medicare population or do they hold true for those with private insurance as well?
• What are the uniform quality-of-care measures and cost-of-care measures that are available for all providers in NH and where can I get them?

52
What We Don’t Know Can Hurt Us#3
• What is the cost of this care/service?Is the potential benefit worth the cost?
• What is the quality of this care/service?Is the potential benefit worth the risk?
• What are the quality and cost of alternatives?
Can I go elsewhere and get higher quality or lower cost?
53
The Important Link Between Policy & Practice:
Information• What are the costs and what is
driving them?• For whom is access limited, why, and
what are the results?• What prevention services and
patterns of care are most effective?• How are the answers to these
questions related?

54
55
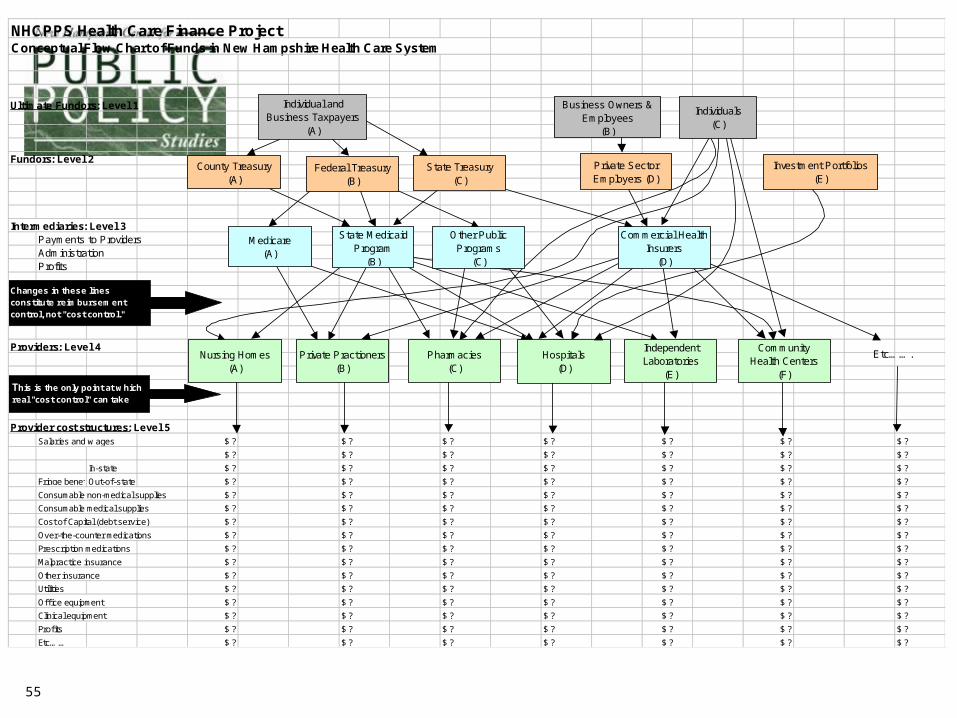
NHCPPS Health Care Finance ProjectConceptual Flow Chart of Funds in New Hampshire Health Care System
Ultimate Fundors: Level 1
Fundors: Level 2
Intermediaries: Level 3Payments to ProvidersAdministrationProfits
Providers: Level 4
Provider cost structures: Level 5Salaries and w ages $ ? $ ? $ ? $ ? $ ? $ ? $ ?
$ ? $ ? $ ? $ ? $ ? $ ? $ ?
In-state $ ? $ ? $ ? $ ? $ ? $ ? $ ?
Fringe benefitsOut-of-state $ ? $ ? $ ? $ ? $ ? $ ? $ ?
Consumable non-medical supplies $ ? $ ? $ ? $ ? $ ? $ ? $ ?
Consumable medical supplies $ ? $ ? $ ? $ ? $ ? $ ? $ ?
Cost of Capital (debt service) $ ? $ ? $ ? $ ? $ ? $ ? $ ?
Over-the-counter medications $ ? $ ? $ ? $ ? $ ? $ ? $ ?
Prescription medications $ ? $ ? $ ? $ ? $ ? $ ? $ ?
Malpractice insurance $ ? $ ? $ ? $ ? $ ? $ ? $ ?
Other insurance $ ? $ ? $ ? $ ? $ ? $ ? $ ?
Utilities $ ? $ ? $ ? $ ? $ ? $ ? $ ?
Office equipment $ ? $ ? $ ? $ ? $ ? $ ? $ ?
Clinical equipment $ ? $ ? $ ? $ ? $ ? $ ? $ ?
Profits $ ? $ ? $ ? $ ? $ ? $ ? $ ?
Etc…… $ ? $ ? $ ? $ ? $ ? $ ? $ ?
Etc…….
Changes in these lines constitute reimbursement control, not "cost control."
This is the only point at which real "cost control" can take place.
Nursing Homes(A)
Private Practioners(B)
Pharmacies(C)
Hospitals(D)
Independent Laboratories
(E)
CommunityHealth Centers
(F)
Commercial Health Insurers
(D)
Other Public Programs
(C)
State Medicaid Program
(B)
Medicare(A)
Investment Portfolios(E)
Private Sector Employers (D)
State Treasury(C)
Federal Treasury(B)
County Treasury(A)
Individuals(C)
Business Owners & Employees
(B)
Individual and Business Taxpayers
(A)

56
St. Joseph Hospital, 2001Nashua, NH
0%
10%
20%
30%
40%
50%
60%
70%
80%
90%
100%
110%
120%
130%
140%
Percent of Gross Charges by Payer
% o
f C
ost
Pai
d
Third Party / Insurance55%
Self-Pay5%
Medicare34%
Medicaid2%
Bad Debt & Charity4%
Net operating income of $10.8 million on net revenue of $91.4 million
0%

57
Cottage Hospital, 2001Woodsville, NH
0%
10%
20%
30%
40%
50%
60%
70%
80%
90%
100%
110%
120%
130%
140%
Percent of Gross Charges by Payer
% o
f C
ost
Pai
d
Third Party / Insurance34%
Self-Pay8%
Medicare44%
Medicaid9%
Bad Debt & Charity5%
Net operating loss of $0.8 million on net revenue of $13.5 million
0%

58
Franklin Hospital, 2001
0%
10%
20%
30%
40%
50%
60%
70%
80%
90%
100%
110%
120%
130%
140%
Percent of Gross Charges by Payer
% o
f C
ost
Pai
d
Third Party / Insurance34%
Self-Pay6%
Medicare46%
Medicaid9%
Bad Debt & Charity6%
This hospital had a net operating loss of $6.2 million on net revenue of $15.0 million
0%

59
Potentially Misleading !!
Is a hospital’s shortfall caused by reimbursement that is low or by a cost structure that is high?
We don’t know!
Hospital B, 2001
0%
10%
20%
30%
40%
50%
60%
70%
80%
90%
100%
110%
120%
130%
140%
Source of Payment
% o
f C
os
t P
aid
Self-Pay5%
Medicare51%
Medicaid7%
Bad Debt & Charity6%
Third Party / Insurance
31%
This hospital had a net operating loss of $2.7 million on net revenue of $20.5 millionHospital A, 2001
0%
10%
20%
30%
40%
50%
60%
70%
80%
90%
100%
110%
120%
130%
140%
Source of Payment
% o
f C
os
t P
aid
Third Party / Insurance58%
Self-Pay2%
Medicare31%
Medicaid4%
Bad Debt & Charity3%
Other 3%
190%
This hospital had a net operating gain of $4.7 million on net revenue of $55.1 million