1. guy turner director climate change policy enviros consulting 20-23 greville street farringdon...
Post on 18-Dec-2015
214 views
TRANSCRIPT

1

Guy TurnerDirector Climate Change Policy
Enviros Consulting20-23 Greville Street
FarringdonLondon
Tel: +44 (0)207 421 [email protected]
Ecotaxes in the UK - A Business View
Heinrich Böll Foundation
25th June 2004
3
Outline of Talk
1. Overview of Enviros Consulting
2. Brief overview of UK Energy Tax System, CCL and CCAs
3. Key Features of the UK’s Climate Change Agreements
4. Comparison of CCAs and EU ETS
5. Impact of CCL
6. Impact of CCAs
7. Benefits of CCL and CCAs
8. Business Response
9. Policy Implications
10.Areas for Further Research

4
Overview of Enviros Consulting
• 350 staff, with 8 offices throughout UK, Ireland. Also offices in Spain, Czech, Canada and South Africa.
• 60 staff in the energy / climate change practice
• Staff comprise engineers, economists, financial experts and MBAs
• We have a long history of advising on and delivering energy efficiency in industry
• Key sectors include: oil & gas, chemicals, food & drink, glass, cement, brick, packaging, general manufacturing and buildings
5
Our Experience with UK Energy Tax System
• The UK CCL and CCA system has been central to our work over the last four years
• We helped a number of industry sectors negotiate their Climate Change Agreement (CCA) targets with government in 2000
• We were an active participant in the UK Emissions Trading Group, which helped define the detailed rules of the CCA scheme
• We now manage the CCA activities of 6,000 sites in the food and drink and metal packaging sectors. Of these 6,000 sites, 4,000 are very small (eg chicken houses)
– We hold training seminars on CCA issues and energy management programmes
– We set up “group” verification of emissions
• Since the start of the CCA scheme we have undertaken various reviews for the UK government on business responses
6
Key Features of the UK Energy Tax System
• CCL introduced as a downstream energy tax. Downstream was chosen rather than upstream in order to avoid undesirable consequences:
– Protection of employment in the deprived coal field areas
– Avoid cost pass through from generators to the domestic sector - government claims 4million people living in fuel poverty plus manifesto commitment to no new fuel taxes
• Gross effect of CCL was to increase energy prices by 10-15% (depending on fuel mix). Little perceived impact as underlying energy prices decreased at the same time.
• Exemptions for (good quality) CHP, renewable energy and electrolysis
• Partial exemptions (80%) for Energy Intensive Users through the Climate Change Agreements (CCAs) and commercial greenhouses
7
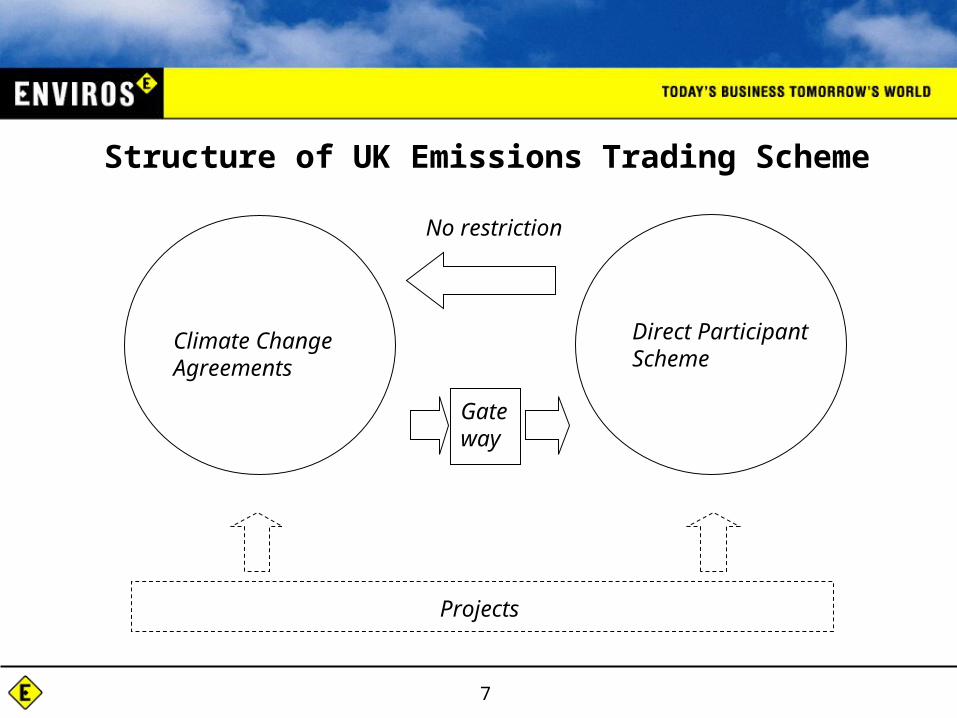
Structure of UK Emissions Trading Scheme
Direct Participant Scheme
No restriction
Gateway
Projects
Climate Change Agreements
8
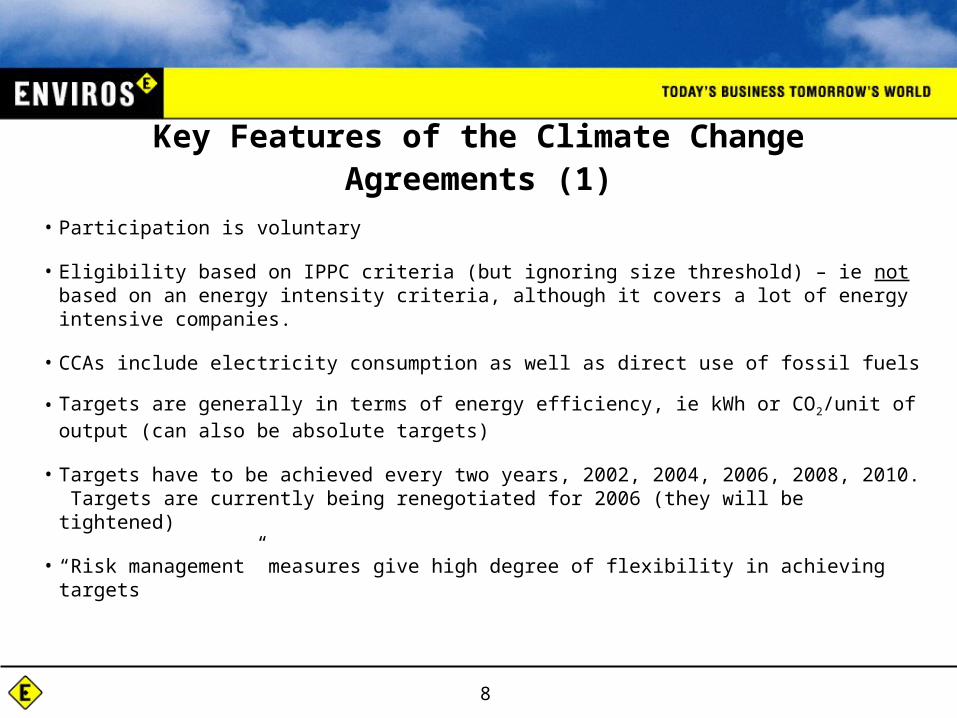
Key Features of the Climate Change Agreements (1)
• Participation is voluntary
• Eligibility based on IPPC criteria (but ignoring size threshold) – ie not based on an energy intensity criteria, although it covers a lot of energy intensive companies.
• CCAs include electricity consumption as well as direct use of fossil fuels
• Targets are generally in terms of energy efficiency, ie kWh or CO2/unit of output (can also be absolute targets)
• Targets have to be achieved every two years, 2002, 2004, 2006, 2008, 2010. Targets are currently being renegotiated for 2006 (they will be tightened)
• “Risk management” measures give high degree of flexibility in achieving targets

9
Key Features of the Climate Change Agreements (2)
• Typical target profile: Year % improvement2002 2%2004 4%2006 6%2008 8%2010 10%
• Targets can be met by direct improvements in energy efficiency or through trading CO2
• If a sector passes its target, all its constituent members pass. If a sector fails its target, liability falls to the individual company / installation.
• This has created some odd sector behaviour - some sectors comply as a “block” or “pool”. Why? No obvious benefit for participant companies.
– Firms “long” of allowances will not realise their true value
– If “long“ firms want to sell at a discount, why sell to your competitor?

10
Structure of the Climate Change Agreements
• 44 “Umbrella Agreements” between industries and government
• 10,700 sites covered in these agreements
• Of these 10,700 sites, 6,700 are very small (bakeries, supermarkets, intensive farms)
• Of the remaining 4,000 sites, 2,000 of these are in the food and drink sector
• Hence excluding food and drink sector, c. 2,000 “traditional” heavy industrial sites

11
Comparison of Coverage of CCAs and EU ETS
• EU ETS will cover c. 1,500 sites in the UK, including power sector
• CCAs cover c. 4,000 significant industrial sites
• Although EU ETS covers more emissions, CCAs have far deeper penetration across industry

12
Impact of CCL
CCL itself has had relatively little effect on business energy consumption
• Those firms paying the CCL at 100% are not energy intensive
• For these firms, 10-15% is not a material increase
• The 10-15% impact of the CCL has been offset by underlying reductions in energy prices
13
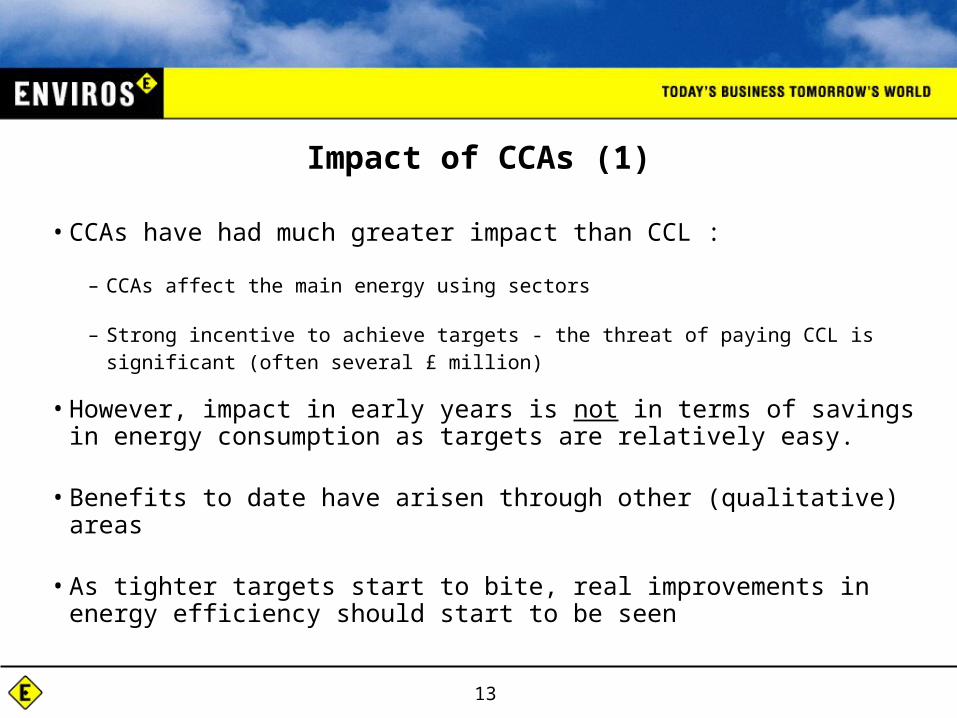
Impact of CCAs (1)
• CCAs have had much greater impact than CCL :
– CCAs affect the main energy using sectors
– Strong incentive to achieve targets - the threat of paying CCL is significant (often several £ million)
• However, impact in early years is not in terms of savings in energy consumption as targets are relatively easy.
• Benefits to date have arisen through other (qualitative) areas
• As tighter targets start to bite, real improvements in energy efficiency should start to be seen
14
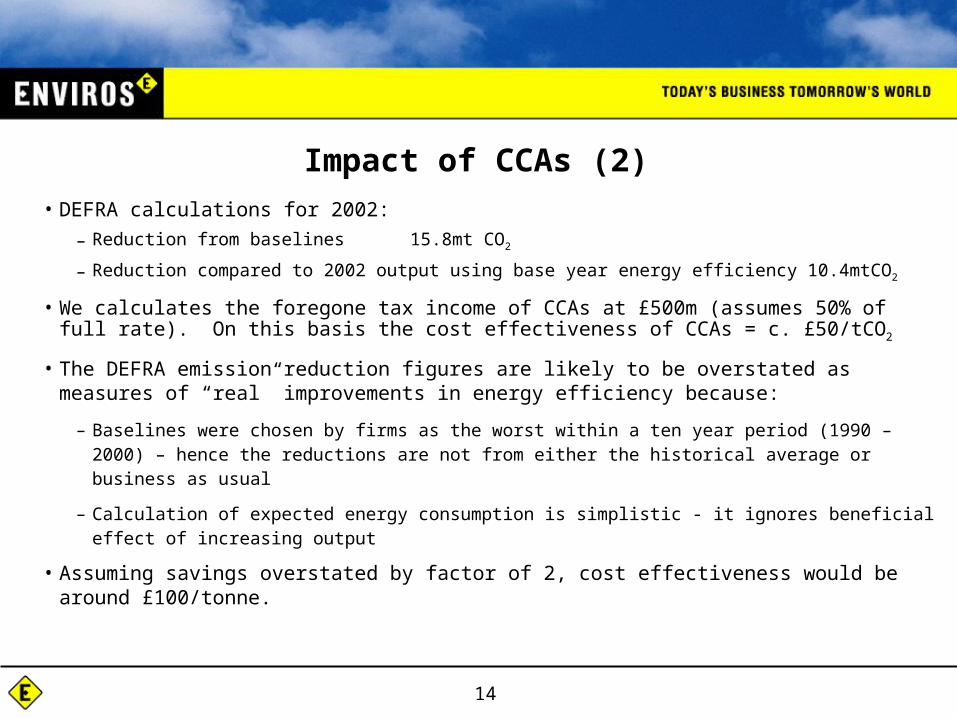
Impact of CCAs (2)
• DEFRA calculations for 2002:
– Reduction from baselines 15.8mt CO2
– Reduction compared to 2002 output using base year energy efficiency 10.4mtCO2
• We calculates the foregone tax income of CCAs at £500m (assumes 50% of full rate). On this basis the cost effectiveness of CCAs = c. £50/tCO2
• The DEFRA emission reduction figures are likely to be overstated as measures of “real” improvements in energy efficiency because:
– Baselines were chosen by firms as the worst within a ten year period (1990 – 2000) – hence the reductions are not from either the historical average or business as usual
– Calculation of expected energy consumption is simplistic - it ignores beneficial effect of increasing output
• Assuming savings overstated by factor of 2, cost effectiveness would be around £100/tonne.

15
Impact of CCAs (3)
• Enviros’ view is that CCAs have had little impact in changing energy consumption of business to date. This is due to:
– Targets were originally set generously in favour of business (asymmetric information) – 86% of participants passed their first target
– Economic growth: increasing output will reduce specific energy consumption
– Risk management measures are quite generous:
• Product Mix & Output Algorithm
• Tolerance Band
– Excessive supply of CO2 allowances from “direct emissions trading scheme” (price of CO2 dropped to £2.80/tonne CO2)
• Also difficult to see significant shifts in energy efficiency over such a short time frame

16
0.00
2.00
4.00
6.00
8.00
10.00
12.00
14.00
13/02/2002 04/04/2002 24/05/2002 13/07/2002 01/09/2002 21/10/2002 10/12/2002 29/01/2003
UK ETS Price Activity 2002
Source: TFS, ICAP
2002 vintage
Big fall due to surplus in CCA sectors starting to become verified
Increase in prices bid up bysmall number of sellers (two!).
No downward pressure on prices from buyers
2003 vintage lower than 2002 – less demand in this non CCA year
17
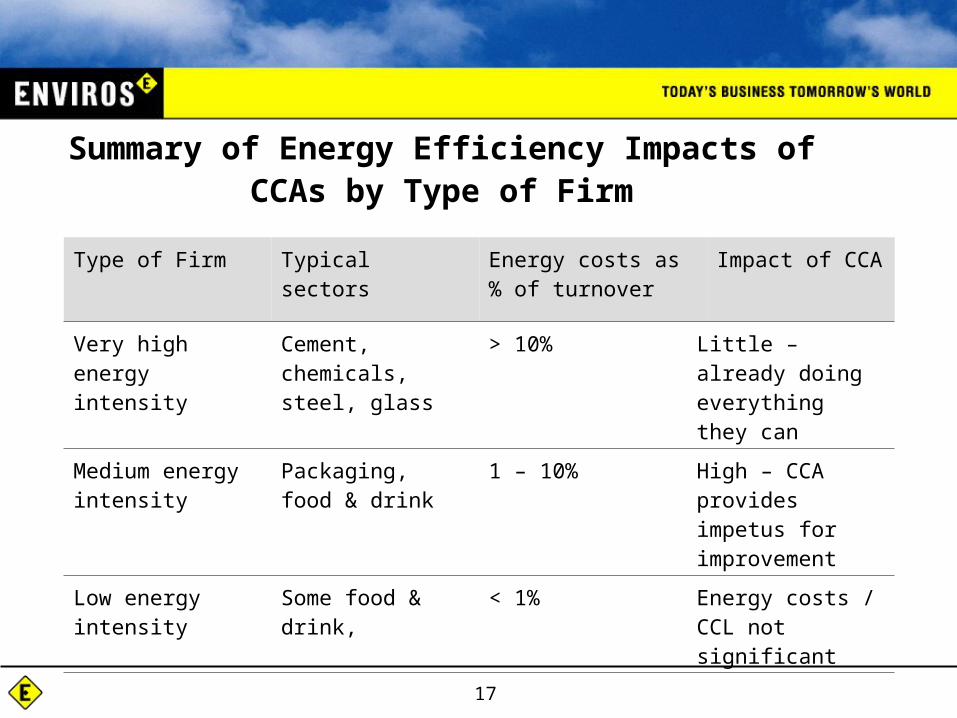
Summary of Energy Efficiency Impacts of CCAs by Type of Firm
Type of Firm Typical sectors Energy costs as % of turnover
Impact of CCA
Very high energy intensity
Cement, chemicals, steel, glass
> 10% Little – already doing everything they can
Medium energy intensity
Packaging, food & drink
1 – 10% High – CCA provides impetus for improvement
Low energy intensity
Some food & drink, < 1% Energy costs / CCL not significant

18
Benefits of CCAs to Date
• Much greater awareness of energy consumption (rather than simply energy costs) – eg before CCAs a large supermarket chain did not know what its energy consumption was.
• Awareness at higher levels in organisations, eg Finance Director - finance led not technology led. Company avoids paying “tax”.
– Eg Trade Associations now often meet four times a year to discuss energy management issues, hold training sessions
• Much better data on energy consumption in industry (better policy decision-making)
• Improved energy metering throughout industry

19
Business Response to CCL & CCAs
-ve Initially strong business opposition to CCL due to onerous tax burden
+ve In favour of CCAs as they offer 80% discount on CCL
-ve Complexity of CCAs and administration costs
+ve Rules are understood, system works, flexible, better than EU ETS

20
Policy Implications
• CCL is still too low to change behaviour in non energy intensive sectors
• CCAs seem to be addressing important aspects of failures in the market for energy efficiency (awareness, senior level engagement)
• The threat of sanctions (full rate of CCL) was key to setting up CCAs
• High administrative burden was (mostly) necessary – now have a scheme with 10,700 performance contracts between government and industry
• One step at a time – for a complex scheme, get the scheme in place first. Once accepted, targets can then be tightened taking into account international competitiveness.

21
Areas for Further Research
• Competitiveness impacts of energy and climate change legislation – what is the optimal rate of energy/carbon tax? Not so easy as MC = MB
• Reasons for certain business responses – eg why businesses choose sub-optimal strategies (ie pooling)
• When tradable permit schemes efficient policy tools? – eg will the EU ETS really change business behaviour?