1 global livestock markets: outlook, policies, and future challenges nancy morgan, livestock...
TRANSCRIPT

1
Global livestock markets: outlook, policies, andGlobal livestock markets: outlook, policies, andfuture challengesfuture challenges
Nancy Morgan,Nancy Morgan,
Livestock EconomistLivestock Economist
FAO/World BankFAO/World Bank

2
The Livestock Revolution revisited: World Meat Production and Trade
0
50
100
150
200
250
1990 1995 2000 2005 2008 2009
Beef Pigmeat Poultry Ovine
Production Driven by Gains in
Poultry/Pork Sectors
0
5
10
15
20
90 95 2000 2004 2005 2008 2009
Milli
on to
nnes
Beef Pork Poultry Meat Ovine
With Trade Growing Faster
than Production Animal disease
-50 0 50 100 150
Africa
Asia
Latin America
North America
Europe
Other
Develped
Developing
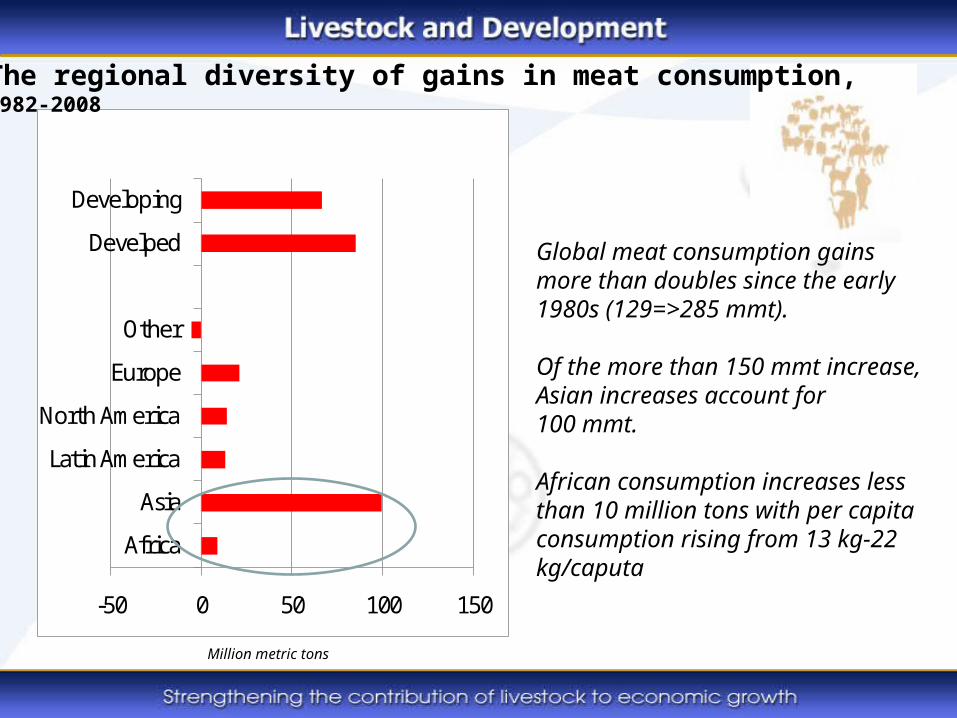
Global meat consumption gainsmore than doubles since the early 1980s (129=>285 mmt).
Of the more than 150 mmt increase,Asian increases account for100 mmt.
African consumption increases less than 10 million tons with per capita consumption rising from 13 kg-22 kg/caputa
The regional diversity of gains in meat consumption, 1982-2008
Million metric tons

4
Growth in Dairy Sectors in
Developing Countries Continues Unabated
Over the past twenty-five years developing countries contributed nearly three-quarters of global consumption gains for both meat and dairy
.....80% of production gains came from smallholders
0
100,000
200,000
300,000
400,000
500,000
600,000
700,000
800,000
900,000
1,000 to
ns
OtherdevelopingAsia
Developed
2017

What about the evolution in meat trading patterns?
-10 -8 -6 -4 -2 0 2 4 6 8
AfricaAsia
Latin AmericaNorth America
EuropeOceania
OtherDevelped
Developing
Million metric tons
NET MEAT TRADE STATUS, 2008
Key Importing Regions:
Asia: 40% importsEurope: 22% importsN. America: 10%
Key Exporting Regions:
N. America: 30%Latin America: 30%Europe: 13%Oceania: 12%

Key Indicators which reveal opportunities for importsubstitution, etc.
Key Indicators
Imports: % Consumption
Exports: % Production
Volume (Value ) of Imports
Developing 10 6 12
Developed 7 11 11
Europe 9 5 5.2 ($14 billion)
North America 5 17 2.4 ($6.7 billion)
Latin America 8 16 2.6 ($4 billion)
Asia 9 2 10.6 ($16.3 billion)
Africa 13 1 1.7 (1.7 billion)
WORLD 8 8 23.2 ($43 billion)
Key opportunitiesare domesticallydriven

7
Potential in terms of consumption growth, How much do we eat?
020406080
100120140160180200
Meat Milk
Kg/caputa
Developed
Developing
Asia
Africa
Per capita meat and dairy product consumption in developing countries, despiterapid gains, remains about one-third the levels of developed countries.
Large opportunities for consumption gains in livestock products in developing countries

8
0.57
1.78
1.09
3.07
2.07
2.65
2.48
2.73.85
0 2 4 6 8 10
Wheat
Coarse grains (feed)
Rice
Vegetable Oils
Poultry
Pigmeat
Beef
Milk
% change per annum
2008-2017 1998-2007
....but livestock products remain the fastest growing commodity
THE CRYSTAL BALL:Consumption gains to slow over the next decade….

Of key concern, however, is uncertainty about commodity price levels andprice volatility!!!!
Implications for livestock sectors:
•Focus on developing strong and competitive local markets.
• Considerable investments to be made in research and development, with a focus on alternative feeds.
•Governments should allocate money in an efficient way, looking at effective provision of services (veterinary/ extension)
• Donor funds should leverage this investment, not substitute for it!!!

Challenges to the Sector
Structure of modern food sector quickly evolving– Longer livestock value chains– Mounting pressure on resource
availabilities, including water, grazing land
Juxaposed by farming systems which in many cases are still at the preliminary stage of development
Increasing complex and competitive environment
Lack of financing and strategic thinking by policy makersleads to livestock development that can be unsustainableand detrimental to rural economic development

11
-
10
20
30
40
50
60
70
80
90
100
1990 1992 1994 1996 1998 2000 2002 2004
% p
over
ty in
rur
al a
reas
0
2
4
6
8
10
12
14
% O
DA to
agricu
lture
Donor support to agriculture
% rural poverty
% ODA to Ag
Challenges to the Livestock Sector

12
Current World Bank Livestock Portfolio
• 7 Livestock-only and 58 livestock component projects
• US 1.9 billion
• 65 % in Africa and East Asia
• Performance rating at par with other sectors
28
14
7
45
7
0
100
200
300
400
500
600
700
800
AFRVP EAPVP ECAVP LACVP MNAVP SASVP
Mill
ions
(cur
rent
$)
0
5
10
15
20
25
30
Num
ber o
f Pro
ject
s

Lifting livestock’s long shadow
From degradation to carbon sequestration
From pollution to biogas and clean water
From desertification to sustainable management

The Global Zoonotic Disease Challenge - beyond Avian Influenza

15
Certainly the high and pervasive costs of animal disease are fostering concerns about animal industries
0
2
4
6
8
10
U.K.
Nether
land
s
Taiwan
Urugu
ayU.K
.
Korea
1/
Japan
1/
Nether
land
s
US$
bill
ion
Indirect
Direct
$3.8
$2.3
$6.6
$.08
$9.2
$.433 $.015
1/ Indirect costs not available.
BSEBSE CFSCFSFMDFMD
$.500
AIAI

16
PLATFORMS FOR INVESTMENT PLATFORMS FOR INVESTMENT IN LIVESTOCK FOOD CHAINSIN LIVESTOCK FOOD CHAINS
Ensuring sustainable systems to support livestock Ensuring sustainable systems to support livestock development (with a particular emphasis on development (with a particular emphasis on
mitigating environment impact)mitigating environment impact)
Facilitating safe marketing and cross border trade in Facilitating safe marketing and cross border trade in animal productsanimal products
Safety of livestock food chains Safety of livestock food chains
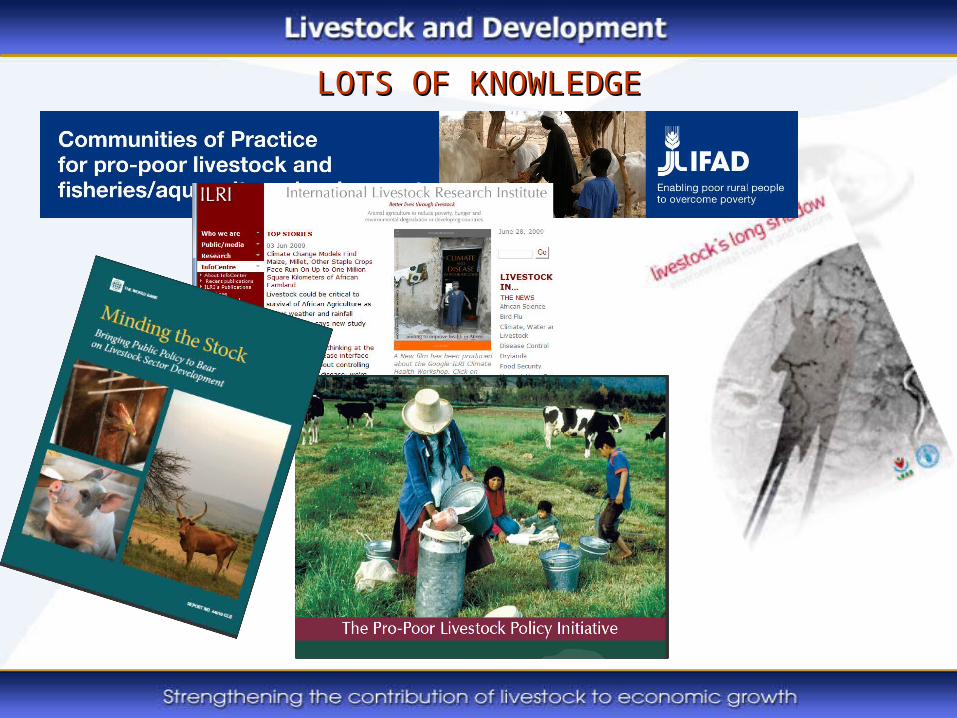
LOTS OF KNOWLEDGELOTS OF KNOWLEDGE

Share of livestock in agricultural GDP and livestock service in agricultural budgets, 1978/1979.
Region/Country Share of livestock GDP in agricultural
GDP (%)
Budgetary share of livestock services in agricultural services (%)
West & Central Africa
Burkina Faso 29 16
Cameroon 10 14
Gambia 21 4
Niger 29 8
Sierra Leone 7 5
East & Southern Africa
Botswana (75-80)1 44
Ethiopia 33 11
Kenya 40 34
Lesotho 58 28
Malawi 6 21
Swaziland 16 48
Source: Addis Anteneh (1991). 1 Estimates from various sources. Staff and non-staff costs: The crisis of animal health services.
Understanding how to support livestock sectors:Markets, budgets and investments
DEMAND, B
UDGETS,
ENABLING
ENVIRONM
ENTS
LIVESTO
CK INVESTM
ENT
AND DEVELO
PMENT

75% of the world’s poor are rural and most are involved in livestock rearing or trading. Development of the sector remains fundamental for poverty reduction, economic
growth and environmental sustainability
The Challenge--- supporting sector development through effective strategy development, policy implementation, and investment.