1 fourth meeting of the nfsm executive committee presentation on performance and crop situation sri....
Post on 22-Dec-2015
214 views
TRANSCRIPT

1
Fourth Meeting of the
NFSM Executive Committee
Presentation on performance and crop situation
Sri. Sunil Sharma., I.A.S.,Commissioner of Agriculture,
Andhra Pradesh

2
AP’s food grains production recorded an average annual growth rate of 8.98% for the period 2004-09.
The State has recorded the highest ever food grain production of 198.17 lakh tonnes in 2007-08 and 204.74 lakh tonnes during 2008-09 as against a
Normal of 173.73 lakh tonnes.
However, due to adverse seasonal conditions during Kharif 2009, the expected production of food grain is 68.39 lakh tonnes as against the normal of 97.10 lakh tonnes.
However, we plan to compensate this loss during Rabi 2009-10 by enhancing the area under
cultivation as well as productivity. We estimate food grain production of 97.46 lakh tonnes in Rabi 2009-10, as against the normal production of 66.90 lakh tonnes.
Introduction

3
Effect of Drought - Kharif-09
• Erratic rainfall, resulted in poor sowings.
• Prolonged dry spells during growth period caused severe
damage to rainfed crops.
• As against as a normal Kharif area of 79.07 lakh ha only
63.91 lakh ha was sown i.e. a loss of 19% in area sown.
• 981 mandals have been declared as drought affected.
• A cropped area of 13.56 lakh ha was damaged in 19
districts.
Source: Dept. of Agriculture

4
Effect of Floods (Sep-09 – Oct-09)
• Due to low pressure developed in West Central
Bay of Bengal and adjoining areas from 29th Sep
to 4th Oct-09, 13 districts in the state received
heavy rains.
• It led to unprecedented floods and caused
inundation of crops.
• A cropped area of 1.85 lakh ha was damaged.
Source: Dept. of Agriculture

5
Production Estimates Kharif-2009
• A total food-grains production of 68.39 lakh tons
is estimated as against the Normal of 97.10 lakh
tons i.e. about 30% decline over Normal and
35% decrease compared to last Kharif (105.69
lakh tons)
Source:- Department of Agriculture

6
Prospects of Rice production during Kharif-2009
S.No Crop
Area sown(lakh ha)
Yield(kg / ha)
Production(lakh MT)
Normal Actual Normal Expected Normal Expected
1 Rice 25.53 18.50 2842 2854 72.58 52.80
The Kharif rice production is estimated at 52.80 lakh tons as against the Normal of 72.58 lakh tons i.e. 27% decrease over Normal and 37% decrease compared to last Kharif (83.81 lakh tons).
Source: Dept. of Agriculture

7
Prospects of Pulses production during Kharif-2009
S.No Crop
Area sown(lakh ha)
Yield(kg / ha)
Production(lakh MT)
Normal Actual Normal Expected Normal Expected
1 Redgram 4.52 4.00 514 585 2.34 2.34
2 Greengram 2.59 1.78 422 384 1.09 0.68
3 Blackgram 0.8 0.75 451 365 0.36 0.27
4 Total Pulses
8.12 7.09 3.87 3.52
N:B:- Erratic rainfall and also unprecedented floods in the state resulted in poor sowing of pulse crops and the yield level reduced (except Redgram) during Kharif-2009.
Source: Dept. of Agriculture

8
The following strategies are adopted for increasing the Rabi Rice & Pulses production.
• Increasing the area under Rice & Pulses during Rabi
• Efficient and timely input delivery.
• Effective extension out reach.
• Providing access to the information by the farmers through AGRISNET.
• Weather based fore warning of pest and diseases and timely control.
• Farm Mechanization for improving efficiency in farm operations and reducing cost of cultivation.
• Intensive training of farmers on improved crop management practices like INM, IPM, PHT and water management.
• Adequate credit with specific reference to pulse and tenant farmers and crop insurance.
9
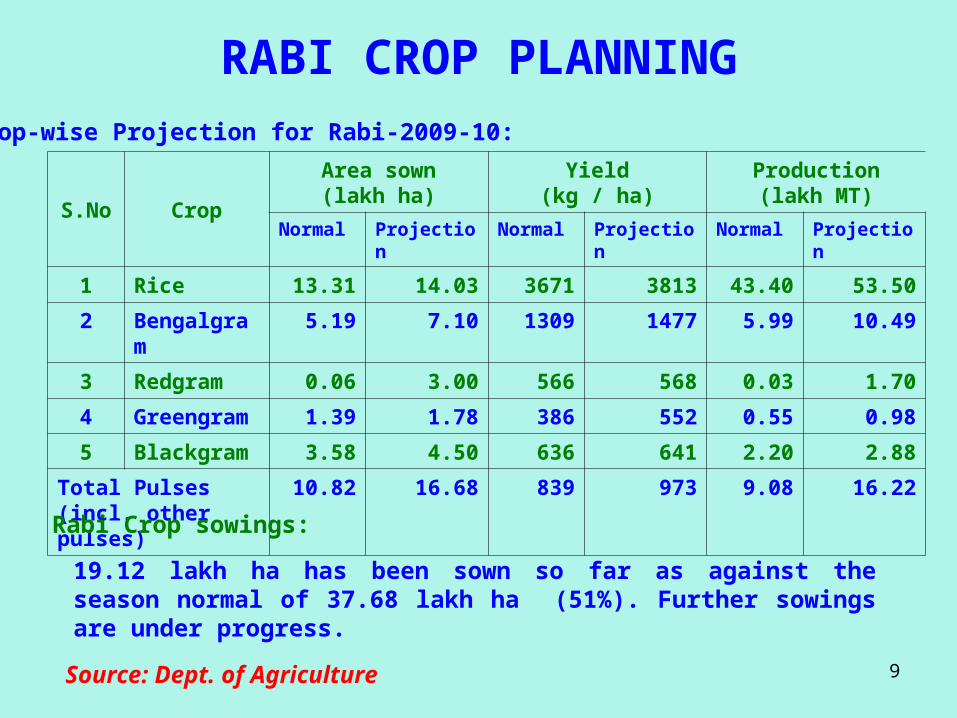
RABI CROP PLANNINGCrop-wise Projection for Rabi-2009-10:
S.No Crop
Area sown(lakh ha)
Yield(kg / ha)
Production(lakh MT)
Normal Projection Normal Projection Normal Projection
1 Rice 13.31 14.03 3671 3813 43.40 53.50
2 Bengalgram 5.19 7.10 1309 1477 5.99 10.49
3 Redgram 0.06 3.00 566 568 0.03 1.70
4 Greengram 1.39 1.78 386 552 0.55 0.98
5 Blackgram 3.58 4.50 636 641 2.20 2.88
Total Pulses (incl. other pulses)
10.82 16.68 839 973 9.08 16.22
Rabi Crop sowings:
19.12 lakh ha has been sown so far as against the season normal of 37.68 lakh ha (51%). Further sowings are under progress.
Source: Dept. of Agriculture

10
Projections for Rabi-09-10 Food-grains Production
• A total Rabi food-grains production of 97.46 lakh tons is estimated as against the Normal of 66.90 lakh tons ie 45% excess over Normal. (98.35 lakh tons last year).
• The Rabi Rice production is estimated at 53.50 lakh tons as against the Normal of 43.40 lakh tons ie 23% excess over Normal. (58.26 lakh tons last year).
• The Bengalgram production is estimated at 10.49 lakh tons as against the Normal of 5.99 lakh tons ie 75% excess over Normal. (8.57 lakh tons last year).
With the receipt of heavy rains there is enough water in the major reservoirs under Krishna basin i.e. Nagarjunasagar, Jurrala, Tungabhadra & Srisailam.
Poor inflows were recorded in major reservoirs in Godavari basin i.e. SRSP, Nizamsagar and Singur etc. As such the paddy area will be decreased
under these commands.
Water levels in major reservoirs

11
Subsidy Seed distribution during Rabi-2009-10
S.No CropSubsidy seedplanned for
Rabi-2009-10
Positionedso far
Distributionso far
1 Paddy 250234 110430 31776
(Qty in qtls) as on 01.12.09
Distribution is in progress
Source: Dept. of Agriculture
PADDY

12
Subsidy Seed distribution during Rabi-2009-10
S.No CropSubsidy seedplanned for
Rabi-2009-10
Positionedso far
Distributionso far
1 Greengram 6000 5020 3964
2 Blackgram 25000 25000 * 20900
3 Bengalgram 360000 360000 360000
4 Redgram 30240 17628 14193
Source: Dept. of Agriculture
PULSES
* Distribution is in progress
(Qty in qtls) as on 01.12.09

13
Increasing Pulses Area under Irrigation
Nos
Area under
irrigation ha
Nos
Area under
irrigation ha
Nos
Area under
irrigation ha
Nos
Area under
irrigation ha
1 Sprinkler 2000 4000 3820 3820 3820 3820 9640 11640
2Diesel Engines / Electric motors
3000 6000 4000 8000 5000 10000 12000 24000
Total 10000 11820 13820 35640
2011-12 Total
Sl.No
Item
2009-10 2010-11
Source: Dept. of Agriculture
14
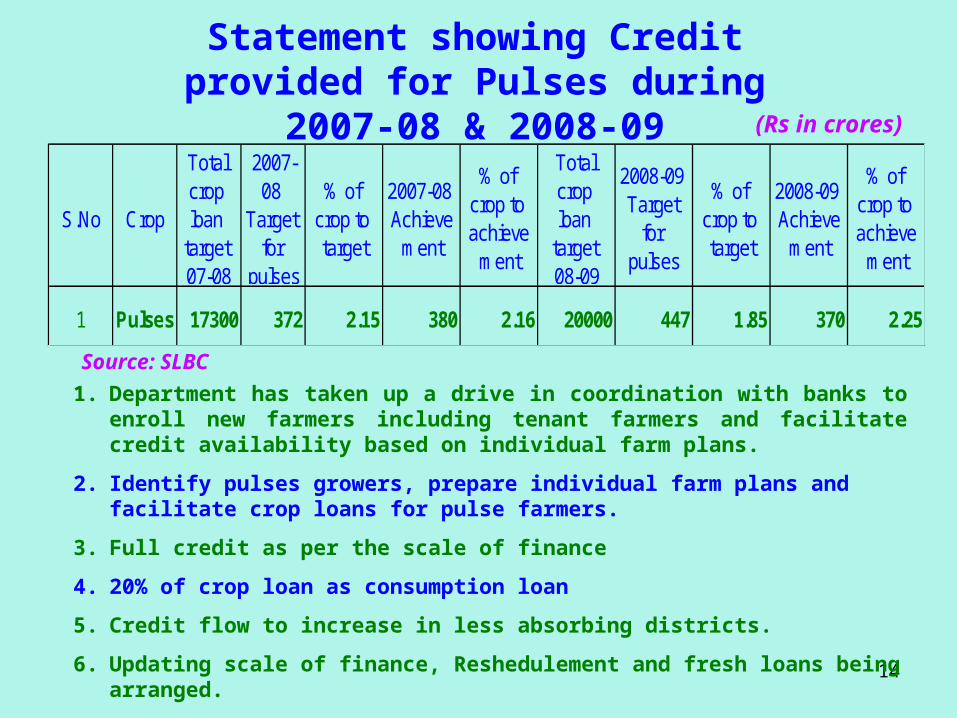
Statement showing Credit provided for Pulses during 2007-08 & 2008-09
1. Department has taken up a drive in coordination with banks to enroll new farmers including tenant farmers and facilitate credit availability based on individual farm plans.
2. Identify pulses growers, prepare individual farm plans and facilitate crop loans for pulse farmers.
3. Full credit as per the scale of finance
4. 20% of crop loan as consumption loan
5. Credit flow to increase in less absorbing districts.
6. Updating scale of finance, Reshedulement and fresh loans being arranged.
Source: SLBC
(Rs in crores)
S.No Crop
Total crop loan
target 07-08
2007-08
Target for
pulses
% of crop to target
2007-08 Achieve
ment
% of crop to achieve
ment
Total crop loan
target 08-09
2008-09 Target
for pulses
% of crop to target
2008-09 Achieve
ment
% of crop to achieve
ment
1 Pulses 17300 372 2.15 380 2.16 20000 447 1.85 370 2.25

15
Statement Showing Releases, Expenditure and submission of UC Under NFSM - Rice & Pulses
(As on 30.11.09)
The entire allocated amount of Rs. 14223.111 lakhs will be utilized before 31.03.10.
S.No CropAllocation
2009-10
Amount Released including
revalidation
Expenditureup to
30.11.09
Total Amountof Ucs
submitted
Balance tobe released
from allocation made
1 2 3 4 5 8 9
1 Rice 4669.365 3735.492 1888.404 1643.958 933.873
2 Pulses 9553.746 7642.997 6076.826 5815.522 1910.749
Total 14223.111 11378.49 7965.230 7459.480 2844.622
An amount of Rs. 271 lakhs is yet to be released under publicity

16
Base Line Normal
(02-03 to 06-07)
2008-09
% increase
over Normal
Base Line Normal
(02-03 to 06-07)
2008-09
% increase
over Normal
Base Line Normal
(02-03 to 06-07)
2008-09
% increase
over Normal
NFSM districts 1719.74 2326.00 35.25 2675 3092 15.62 4600 7193 56.38Non-NFSM districts 1618.07 2061.00 27.37 3211 3420 6.51 5195 7048 35.67Andhra Pradesh 3337.80 4387.00 31.43 2935 3246 10.60 9795 14241 45.39
Area (000' ha)
District
Yield (kg/ha) Production (000' tons)
Impact of the Mission - RICE - 2008-09
• Area under Rice increased by 10.49 lakh ha out of which
NFSM districts contributed 6.06 lakh ha i.e. about 60%
• Production increased by 44.46 lakh tons out of which NFSM
districts contributed 25.93 lakh tons i.e. about 56.37%.
Source:- Out line of Agricultural situation 2008-09

17
Impact of the Mission Bengalgram - 2008-09
• Area under Bengalgram increased by 2.40 lakh ha out of which NFSM
districts
contributed 2.26 lakh ha i.e. about 94%
• Production increased by 4.22 lakh tons out of which NFSM districts
contributed 4.12 lakh tons i.e. about 97.63%.
Base Line Normal
(02-03 to 06-07)
2008-09
% increase
over Normal
Base Line Normal
(02-03 to 06-07)
2008-09
% increase
over Normal
Base Line Normal
(02-03 to 06-07)
2008-09
% increase
over Normal
NFSM districts 323.662 551.00 70.24 1188 1446 21.75 385 797 107.27Non-NFSM districts 42.982 56.00 30.29 1169 1071 -8.35 50 60 19.41Andhra Pradesh 366.64 607.00 65.56 1186 1413 19.16 435 857 97.11
Area (000' ha)
District
Yield (kg/ha) Production (000' tons)
Source:- Out line of Agricultural situation 2008-09

18
Input Consumption in NFSM districts
• Paddy seed distribution increased by 22 % During 08-09 compared to 07-08.
• Bengalgram seed distribution increased by 29.4% during Rabi-08-09, compared to Rabi-2007-08.
• The NPK consumption in NFSM districts increased by 10.68% in Rabi-08-09 compared to Rabi-07-08.

19
Status of Baseline, Concurrent Evaluation etc.
• Benchmark Survey – NFSM Districts
(Submitted vide Lr.No. NFSM / B. Survey / 26 / 08, Dt: 02.01.09).
• Concurrent Evaluation Status(Submitted vide Lr.No. NFSM / C.E / 26 / 08, Dt: 22.12.08 & Dt, 18.03.09).
• Results of Demonstrations and Minikits
(Submitted vide Lr.No. NFSM / 41 / 09, Dt: 04.06.09).
• Success Stories
(Submitted vide Lr.No. NFSM / 16 / 09, Dt: 22.05.09).
• Perspective Plan up to 2011-12 formulated.

20
Innovative Actions
• Promotion of Redgram in irrigated areas during Rabi-2009-10.
• Organization of Farm Mechanization Exhibition at ANGRAU.
• Value addition in SRI system grown Rice.
21
Visits by GOI representatives Kharif-09
• Dr. Shanker Lal, National Consultant (seeds).
• Dr. A.K. Singh from Dir. Oil. Seeds, Telhan Bhawan, Hyderabad.

22