(1) fish marketing - natural resources institute
TRANSCRIPT

A Guide to the Analysis ofFish Marketing Systems Usinga Combination of Sub-sectorAnalysis and the Sustainable
Livelihoods Approach
U. Kleih, P. Greenhalgh and N. Oudwater
The integration of wider development approaches in the fisheries sector is essential for the
sector to be fully involved in the development process. A Guide to the Analysis of Fish
Marketing Systems Using a Combination of Sub-sector Analysis and the Sustainable
Livelihoods Approach discusses the main elements to be considered when analysing a fish
marketing chain from a livelihoods perspective. This analysis uses both the Sustainable
Livelihoods Approach and sub-sector analysis and argues that this combination of
methodologies delivers the most reliable results.
Although the guide can be used for the analysis of any fish marketing chain in developing
countries, the focus is on the marine fisheries sector using two DFID-funded research
projects in India and Bangladesh as case studies. It is primarily aimed at researchers and
development practitioners investigating fisheries-based communities or sub-sectors with the
intention of preparing project interventions or policy recommendations.
POST-HARVEST FISHERIESRESEARCH PROGRAMME
A Guide to the Analysis ofFish Marketing Systems Usinga Combination of Sub-sectorAnalysis and the Sustainable
Livelihoods Approach
U. Kleih, P. Greenhalgh and N. Oudwater
(1) Fish Marketing Systems.qxd 8/8/03 5:55 pm Page i

ii
© The University of Greenwich 2003
The Natural Resources Institute (NRI) of the University of Greenwich is an internationally recognizedcentre of expertise in research and consultancy in the environment and natural resources sector. TheInstitute carries out research and development and training to promote efficient management and use ofrenewable natural resources in support of sustainable livelihoods.
Short extracts of this publication may be reproduced in any non-advertising, non-profit-making contextprovided that the source is acknowledged as follows:
KLEIH, U., GREENHALGH, P. and OUDWATER, N. (2003) A Guide to the Analysis of Fish Marketing
Systems Using a Combination of Sub-sector Analysis and the Sustainable Livelihoods Approach.
Chatham, UK: Natural Resources Institute.
Permission for commercial reproduction should be sought from the Managing Editor, University ofGreenwich at Medway, Central Avenue, Chatham Maritime, Kent ME4 4TB, United Kingdom.
This publication is an output from a research project funded by the United Kingdom Department forInternational Development (DFID) for the benefit of developing countries. The views expressed are notnecessarily those of DFID.R7969 Post-Harvest Fisheries Research Programme
Natural Resources InstituteISBN: 0 85954 522-0
University of Greenwich, a registered charity and company limited by guarantee, registered in England (Reg. No. 986729). Registered Office:
Old Royal Naval College, Park Row, Greenwich, London SE10 9LS.
(1) Fish Marketing Systems.qxd 8/8/03 5:55 pm Page ii

Contents
Acknowledgements v
Introduction 1Objective Of The Guide 1Background 1
Overview of the Sustainable Livelihoods Approach 5Background 5The Key Elements of the Sustainable Livelihoods Framework 6Methodology 7
Sub-sector Analysis 9Background 9Concepts and Definitions 10Sub-sector Mapping 11Steps Involved in Sub-sector Analysis and Resources Required 11
Combining Sub-sector Analysis with the SustainableLivelihoods Approach 13Building a Project Partnership 13Approaching the Topic 14Mapping the Commodity Chain 14Understanding the Livelihoods Context of Sub-sector Participants 14Economic Analysis Focusing on Financial Capital Assets 17Technical Post-harvest Issues 18The Way Forward 18
Practical Issues 21Steps Involved in the Case Study Projects 21
Review of methods used in the Bangladesh project 22Review of methods used in the India project 23
Data Collection Methods 24Desk studies 24Participatory survey methods 25Rapid market appraisal 26Quantitative methods/questionnaire surveys 27Combinations of quantitative and qualitative methods 29
AppendixesAppendix 1: References, Further Reading Material And Relevant Websites 31Appendix 2: The Sustainable Livelihoods Approach And Its Relevance
for Fish Marketing 35Appendix 3: Steps in Sub-sector Analysis 49Appendix 4: India and Bangladesh Project Case Study Material 53Appendix 5: Examples of Checklists and Guidelines Developed 71
for Fieldwork in Bangladesh and India
iii
(1) Fish Marketing Systems.qxd 8/8/03 5:55 pm Page iii

Abbreviations
CMS Cirrus Management Services Pvt. Ltd, India
CODEC Community Development Centre, Chittagong, Bangladesh
DFID Department for International Development, UK
EU European Union
HACCP Hazard Analysis Critical Control Point
ICM Integrated Coastal Management, India
IMM Integrated Marine Management Ltd
MAPP Morocco Agribusiness Promotion Project (MAPP)
MPEDA Marine Products Export Development Authority, India
NGO Non-Governmental Organization
NRI Natural Resources Institute, University of Greenwich, UK
PHFRP (DFID) Post-Harvest Fisheries Research Programme
PLA Participatory Learning and Action
PPA Participatory Poverty Assessment
PRA Participatory Rural Appraisal
RMA Rapid Market Appraisal
RRA Rapid Rural Appraisal
SCP Structure, Conduct, Performance model
SIFFS South Indian Federation of Fishermen Societies
SLA Sustainable Livelihoods Approach
SPS Sanitary and Phytosanitary Standards
SUFER Support for University Fisheries Education and Research, Dhaka, Bangladesh
UoC University of Chittagong, Bangladesh
USAID United States Agency for International Development
iv
(1) Fish Marketing Systems.qxd 8/8/03 5:55 pm Page iv

Acknowledgements
The authors would like to express their gratitude to their research partners who participated in the twoprojects from which this guide has been developed. Some of the case study material used in the guidehas been borrowed from their project reports. Particular thanks are due to the members of the followingorganizations:
Cirrus Management Services Pvt Ltd (CMS), Bangalore, IndiaCommunity Development Centre (CODEC), Chittagong, BangladeshIntegrated Coastal Management (ICM), Kakinada, IndiaIntegrated Marine Management (IMM Ltd), Exeter, UKSouth Indian Federation of Fishermen Societies (SIFFS), Trivandrum, IndiaUniversity of Chittagong (UoC) Marketing and Sociology Departments, Bangladesh.
The authors are grateful to CODEC for providing the photographs used for the cover design of thispublication.
In addition, the valuable information provided by Mr Ivor Clucas is gratefully acknowledged.
Last but not least, the authors would like to thank the DFID Post-Harvest Fisheries ResearchProgramme for providing the funds for the preparation of this guide.
v
(1) Fish Marketing Systems.qxd 8/8/03 5:55 pm Page v

(1) Fish Marketing Systems.qxd 8/8/03 5:55 pm Page vi

Objective of the Guide
The objective of this guide is to provide the main
elements that need to be considered when
analysing a fish marketing chain from a
livelihoods perspective. It is argued that a
combination of the Sustainable Livelihoods
Approach (SLA) and sub-sector analysis will
deliver the most reliable results. The combination
of the two approaches allows a clear focus on the
main stakeholders involved in the commodity
chain, emphasizing livelihoods aspects, but also
employing more traditional methodologies.
Although the guide can be used for the analysis of
any fish marketing chain in developing countries,
the focus is on the marine fisheries sector. This is
because the DFID-funded research projects,
which were used for the compilation of this guide,
mainly dealt with marine fish species.
The guide is primarily targeted at researchers and
development practitioners investigating
fisheries-based communities or sub-sectors with
the intention of preparing project interventions or
policy recommendations.
The report starts with background information
on the two research projects in which the
methodology was applied and tested. The SLA
and sub-sector analysis are then presented
independently before a discussion of how the two
approaches can be combined, particularly if
poverty alleviation is the ultimate objective of a
study. The last section covers data collection and
analysis, highlighting the main steps involved as
well as tools and techniques. Additional material
covering the case studies and the approaches
adopted is presented in the Appendixes.
Background
The two projects primarily used for the
compilation of this guide were both funded by
the DFID Post-Harvest Fisheries Research
Programme (PHFRP), and implemented in
Bangladesh and India by the Natural Resources
Institute (NRI) of the University of Greenwich
in partnership with local collaborators.
The project ‘R7969 Fish Distribution from
Coastal Communities in Bangladesh: Market and
Credit Access Issues’ lasted from February 2001
to October 2002. The main partners included:
� Natural Resources Institute (NRI), University
of Greenwich, UK
� Community Development Centre in
Chittagong (CODEC)
� University of Chittagong (UoC) Marketing
and Sociology Departments; this component
was funded by the Dhaka-based DFID project
‘Support for University Fisheries Education
and Research (SUFER)’.
The ultimate goal of the project was to work
towards poverty alleviation and livelihood
security among coastal fishing communities and
those involved in the distribution chain. The aim
of this research project was to explore the
dynamics of the livelihoods of the poor in the
fish marketing chain in more detail and make
recommendations regarding the development of
fish marketing and livelihood sustainability.
Introduction
(1) Fish Marketing Systems.qxd 8/8/03 5:55 pm Page 1

Through the application of new knowledge, theproject aimed to improve the post-harvestutilization of fish and its impact on thelivelihoods of poor fisherfolk, processors, tradersand consumers. The following project outputshave been produced:
� an improved understanding of the trading andcredit system for fish produced in poorcoastal communities
� a methodology integrating market and creditanalysis techniques with a livelihoodsapproach in a post-harvest fisheries context
� policy suggestions originating fromstakeholders and likely to benefit the poor incoastal fishing communities and the fishdistribution chain in Bangladesh.
Although the following three main research areaswere covered, it was not always possible to keepthem completely separate.
(i) Analysis of the livelihoods systems offishing communities. This started with aninvestigation of the capital assets available tothe different wealth groups in the villages,and their vulnerability context. Other aspectsincluded the institutional, social, cultural andpolitical contexts, investigating, amongstother things, patronage relationships betweentraders and fishing communities, socialrelations between the various partiesinvolved in the trading and credit network,and distribution of non-economic obligationsand rights. In addition, poor fish producers’and traders’ access to institutions affectingtheir livelihoods was emphasized.
(ii) Analysis of the marketing system. This includedmapping of the sub-sector, calculation of costsand margins, assessment of the pricingmechanisms for the fish (both for theproducers and consumers), risk factors, such asseasonality, evaluation of technical issues (e.g.post-harvest loss, increased necessity for foodsafety and quality control systems),identification of bottlenecks and opportunities.
(iii) Analysis of the credit system. This includedan assessment of the inter-linkages between
fish distribution and credit supply, possiblemarket inefficiencies due to exploitativepractices, access to formal and informalsources of credit by poor participants in thecommodity chain, relative costs of credit,and the extent to which fishing communitiesmay have been able to benefit from micro-credit programmes in Bangladesh.
The research project ‘R7970 Globalization andSeafood Trade Legislation – The Impact onPoverty in India’ which lasted from July 2001 toMarch 2003, sought to devise strategies andmanagement systems to improve the post-harvestutilization of fish in ways that would make animpact on the lives of poor producers, processors,traders and consumers. It was part of the overallDFID programme to develop strategies andmanagement systems with similar objectives.
Using a multi-disciplinary approach, the researchundertaken by the project aimed to generate anddisseminate new knowledge and develop amethodology to assess the impact ofglobalization and changing international foodsafety legislation on the livelihoods of the poor inthe sector. In addition, policy recommendationswere developed relating to people’s livelihoods,poverty eradication and the global seafoodmarket. The project targeted the poor andvulnerable in the fish processing and distributionchains, which included coastal and aquaculturefishing communities (e.g. fishermen, boat andnet owners, small-scale processors, serviceproviders, traders and distributors).
Four organizations were involved directly aspartners in the project:
� Natural Resources Institute (NRI), Universityof Greenwich, UK
� Cirrus Management Services Pvt Ltd (CMS),Bangalore, India
� Integrated Coastal Management (ICM),Kakinada, India
� South Indian Federation of FishermenSocieties (SIFFS), Trivandrum, India.
2
Introduction
(1) Fish Marketing Systems.qxd 8/8/03 5:55 pm Page 2

Other related projects funded by DFID in Indiathrough PHFRP included:
� ‘Changing Fish Utilization and its Impact onPoverty in India (ICM/IMM)’
� ‘Field Evaluation of a Systems-basedApproach to the Reduction of BlowflyInfestation of Traditionally Processed Fish inTropical Developing Countries’ (MDAssociates).
3
Introduction
(1) Fish Marketing Systems.qxd 8/8/03 5:55 pm Page 3

(1) Fish Marketing Systems.qxd 8/8/03 5:55 pm Page 4

Background
The Sustainable Livelihoods Approach (SLA) isa way of thinking about development that hasevolved from lessons learned from povertyreduction approaches as experienced byinternational and national organizations such asDFID, CARE and OXFAM. Sustainablelivelihoods is a framework for thinking aboutpoverty by trying to understand and analyse thelives and needs of the poor and identify keyopportunities that will ultimately benefit them.The SLA embraces a wider approach to people’slivelihoods by looking beyond income generationactivities in which people engage. Throughparticipatory approaches, it seeks to encouragevarious stakeholders, with their ownperspectives, to engage in these discussions anddebate the factors affecting their livelihoods andpossible opportunities. In sum, the SLA:
� involves a systematic analysis of poverty andits causes
� takes a holistic view of opportunities forimproving people’s livelihoods, the possibleimpact of such opportunities and how this fitswithin existing livelihoods, taking intoaccount the constraints
� places people and their priorities at the centre.
The SLA stresses the importance of an in-depthunderstanding of the various livelihoodcomponents and factors including:
� the priorities that people identify
� constraints and livelihood opportunities,varying from place to place, group to groupand across income levels
� the different strategies that the poor adopt inpursuit of their priorities and in response tothe constantly changing environment in whichthey live
� different social groups within a communityoften facing a variety of sources of risk intheir livelihoods, and thus differing reasonsfor their vulnerability
� the institutions, policies and organizationsthat determine their access to assets/opportunities and the returns they can achieve
� the access of the poor to social, human,natural, financial and physical capital andtheir ability to put these assets to productiveuse
� the changing context in which they live, forexample, external trends (i.e. socio-economicand ecological), shocks (both natural andman-made) and seasonality.
(See also Ashley and Carney, 1999.)
Overview of the Sustainable
Livelihoods Approach111Chapter
1 Based on: Carney (1998), Ashley and Carney (1999), DFID Sustainable Livelihoods Guidance Sheets, www.livelihoods.org and Oudwater(2001).
A livelihood comprises the capabilities,assets and activities required for a meansof living. A livelihood is sustainable whenit can cope with and recover from shocksand maintain or enhance its capabilitiesand assets both now and in the future,while not undermining the natural resourcebase (Carney, 1998).
Box 1: Definition of a ‘sustainable
livelihood’
(1) Fish Marketing Systems.qxd 8/8/03 5:55 pm Page 5

In the following sections, a brief summary isgiven of the main elements that make up thesustainable livelihoods framework (see Appendix2 for a more detailed discussion). Following thekey building blocks, a short overview is thenprovided on methodologies that can be used inapplying the sustainable livelihoods principles.
The Key Elements of theSustainable LivelihoodsFramework
The key elements of the SLA framework are:
� capital assets: resources that help peoplesurvive and thrive (i.e. natural, social, human,physical and financial capital)
� vulnerability context: things to which the poorare vulnerable
� policies, institutions and processes (in earlierversions of the SLA this was referred to as‘structures and processes’): influencing theirlivelihoods
� livelihood strategies: how people adapt andplan in response to threats and opportunities
� livelihood outcomes and aspirations: people’sobjectives and priorities.
(See Figure 1)
Capital assetsCapital assets are resources that help peoplesurvive and thrive and include:
� natural capital (e.g. aquatic resources)
� human capital (e.g. fishing skills, physicalhealth)
� social capital (e.g. social relations, informalsafety networks)
� physical capital (e.g. available marketinginfrastructure)
� financial capital (e.g. access to credit).
Assets are important in terms of quantity andquality. Another crucial question is how do menand women access assets and what is the extent
of their control, rights and security of access.Although it is not always possible to define a‘minimum’ level of assets needed for survival asthe basic requirements differ from place to place,it is obvious that the better people’s overall assetstatus is, the better they will be able to respond tochanges and face hardships. Also it needs to berecognized that some capital assets can benegative (i.e. liabilities). A pentagon issometimes used as a visual tool to presentinformation about people’s access to assets andthe interrelationships between them.
Vulnerability contextThe factors that make up the vulnerabilitycontext are important because they have directimpact upon people’s assets and options availableto them in pursuit of beneficial livelihoodoutcomes (DFID Sustainable LivelihoodsGuidance Sheets). Shocks, trends and seasonalshifts are the main concepts usually used toassess household vulnerability. Shocks includeunpredictable events such as natural disasters(e.g. cyclones, floods, earthquakes), economicshocks (e.g. sudden change in the marketingsystem) or conflict. Trends are changes over alonger period of time (e.g. declining fish stocks,national and international economic trends ortechnological trends). Seasonality is related tophenomena such as price fluctuations, fishcatching seasons or food availability.
Although the use of the term ‘vulnerabilitycontext’ highlights the fact that the relatedinfluences are often the direct or indirect causesof household poverty, it is also worthwhile notingthat not all trends or shocks are negative or causevulnerability (e.g. economic indicators maymove in favourable directions, and newtechnologies can be beneficial to poor people).
Policies, institutions and processesAccording to the DFID Sustainable LivelihoodsGuidance Sheets, “structures in the frameworkare the hardware – the organizations, both private
6
Overview of the sustainable livelihoods approach
(1) Fish Marketing Systems.qxd 8/8/03 5:55 pm Page 6

Fig
ure
1:
Sus
tain
able
live
liho
od
s fr
amew
ork
Hum
an
ASS
ET
S
TR
AN
SFO
RM
ING
Infl
uenc
e an
d A
cces
s
STR
AT
EG
IES
OU
TC
OM
ES
VU
LN
ER
AB
ILIT
YC
ON
TE
XT
Soc
ial
Phy
sica
l
Sho
cks
Tre
nds
Gov
ernm
ent
Pri
vate
sec
tor
Law
s
Pro
cess
esPo
lici
es
Cul
ture
Inst
itut
ions
NR
bas
ed
Non
NR
bas
ed
Mig
rati
onIn
ord
er t
o ac
hiev
e
Sea
sona
lity
Fina
ncia
l
Nat
ural
Inco
me
Wel
l-be
ing
Food
Sec
urit
y
Vuln
erab
ilit
y
NR
use
Str
uctu
res
✔ m
ore
✔ i
ncre
ased
✔ i
mpr
oved
✔ r
educ
ed
✔ m
ore
sust
aine
d
Sou
rce:
NR
I un
publ
ishe
d te
achi
ng m
ater
ial.

and public – that set and implement policy andlegislation, deliver services, purchase, trade andperform all manner of other functions that affectlivelihoods. They draw their legitimacy from thebasic governance framework”. Broadly speaking,the organizations forming the structure belong totwo main categories, that is, the public sector(e.g. political bodies, executive agencies, judicialbodies, quasi-government agencies), and theprivate sector (e.g. commercial enterprises, civilsociety, NGOs).
One of the key principles of the SLA is theattempt to link micro- and macro-levels: thehousehold/community level with processesinitiated by government, the private sector andNGOs. There is a two-way influence betweenassets and policies and institutions. The presenceor absence of relevant policies can haveimportant effects on the livelihoods of the poor.Changes or transformations in these policies andinstitutions can be used to mitigate negativeeffects of trends on the overall asset status andcushion the impact of shocks and seasonality,thereby reducing people’s vulnerability.
Livelihood strategiesLivelihood strategies are how people combine anduse their assets to make a living, given the factorsthat make them vulnerable and the policy andinstitutional context within which they live. In thepast, development efforts often sought to improveservices and opportunities available to people (e.g.fisherfolk). However, the SLA seeks to understandthe factors behind people’s choice of livelihoodstrategies and to reinforce the positive aspects andmitigate the constraints or negative influences. Insum, the SLA seeks to identify measures that buildon the strengths the people have while at the sametime trying to reduce the level of vulnerability.
Livelihood outcomesLivelihood outcomes are the achievements oroutputs of livelihood strategies. People often aimfor a range of preferred outcomes based on theirperceived priorities and objectives, for example,income, well-being, food security, sustainable
use of natural resources, reduced vulnerability or
increased decision-making power. Livelihood
outcomes are not necessarily coherent and there
can be conflicts between different outcomes. For
example, an increased income may be achieved
at the expense of the natural resource base (e.g.
declining fish stocks), or different household
members may have different priorities.
“When analysing the livelihoods outcomes, it is
important to understand not only the aims of
particular groups but also the extent to which these
are already being achieved” (DFID Sustainable
Livelihoods Guidance Sheets). For example, if
certain social groups are systematically failing to
meet their objectives this may be because of lack
of assets or that their aims are in conflict with
those of other, more powerful, groups.
Methodology
In order to get an holistic, but at the same time, in-
depth understanding of people’s livelihoods, it is
important to employ different perspectives, such
as those offered by socio-economics and natural
sciences, with their own complementary methods
and tools. There is not a single approach, but
rather a wide collection of many tools, each
having their own strengths and applications, from
which one can choose and then adapt according to
needs. Generally speaking, it is best to start with
a broad perspective to gain a general
understanding of the whole fish distribution
system and then focus on relevant factors
identified during the initial scoping study.
A wide range of tools can and should be used for
data collection to support an analysis based on
the SLA for complementarity and obtaining a
broad and in-depth understanding. It is suggested
that a combination of participatory, qualitative
and quantitative tools could be used. Suggestions
include:
� participatory methods, including tools such
as Venn diagrams, seasonal calendars, social
and resource mapping, matrix ranking, wealth
ranking exercises
7
Overview of the sustainable livelihoods approach
(1) Fish Marketing Systems.qxd 8/8/03 5:55 pm Page 7

� sample surveys, including structured andsemi-structured questionnaires
� institutional appraisal, including formal andinformal access to credit
� identification and analysis of fish distributionchannels
� market analysis and risk assessment
� social analysis
� gender analysis
� stakeholder analysis and conflict assessment
� participatory poverty assessment techniques
� case studies.
More details of a selection of these techniquesare presented below in the section on datacollection and analysis and in Appendix 5.
8
Overview of the sustainable livelihoods approach
(1) Fish Marketing Systems.qxd 8/8/03 5:55 pm Page 8

Background
Sub-sector analysis is a systematic approach to
studying commodity chains with the aim of
analysing all the participants, their linkages and
influential factors in the commodity system in
order to identify constraints and opportunities for
growth. Although the approach may be primarily
considered a tool for economic analysis, there are
areas where social, technical, institutional and
policy aspects of the commodity chain and its
players are also assessed.
The formulation of programme and policy
interventions tends to be the principal purpose for
carrying out sub-sector analyses (e.g. NGOs such
as CARE). In addition, the approach has also been
used for the preparation of policy interventions by
governments and donors (e.g. USAID). Originally,
especially in the 1990s, the sub-sector approach
was developed with a focus on agricultural
commodity chains and agri-business. Although it
can equally be applied to the fisheries sector, there
are fewer examples where sub-sector analysis has
been systematically used in this context. Here an
attempt is made to fill this gap and place the
approach in combination with a sustainable
livelihoods approach in a fisheries context.
Holtzman (World Bank website, 2003), advocating
rapid assessment methods, highlights the approach’s
emphasis on the economic performance of a
commodity system and the participants involved.
This includes investigation of the structure, conduct
and performance of a sub-sector.
Analysis of the structure of the commodity system
usually focuses on the characteristics related to the
number and size of firms in relation to the size of the
market, the presence or absence of barriers faced by
new market entrants, and product differentiation
(Scarborough and Kydd, 1992). Conduct, in turn,
relates to firms’behaviour in the commodity system
in relation to strategies such as pricing and selling,
overt or tacit inter-firm co-operation (or rivalry), and
research and development activities. The
characteristics commonly investigated for
performance are the results of structure and conduct,
such as a sector’s productive and allocative
efficiency, progressiveness, equity and employment.
One of the criticisms faced by this school of
thought relates to the generally made inference
relating the number of firms to their conduct and
performance. For example, it is often implied
that a larger number of firms means a more
competitive sector; on the other hand, it has been
demonstrated that the existence of fewer firms in
a sector (e.g. oligopolistic market) may also lead
to the type of inter-firm rivalry akin to the
perfectly competitive model.
Another set of indicators used to analyse the
efficiency of a marketing system are derived
from price, cost and margin data. Marketing
margins are commonly referred to as the
difference between two prices in the chain (e.g.
between consumer and producer prices, or
between other points in the marketing chain such
as wholesale and retail market prices).
Deconstruction of margins into cost elements
and enterprise return can be employed to provide
insight into the efficiency of resource allocation
in production, distribution and consumption
(Scarborough and Kydd, 1992).
Sub-sector Analysis 2Chapter
(1) Fish Marketing Systems.qxd 8/8/03 5:55 pm Page 9

Concepts and Definitions
According to Miles (2003) and Holtzman (2003)2,
the following key concepts must be considered
when performing a sub-sector assessment.
Sub-sectorA sub-sector is defined as a group of enterprises
involved in the production and marketing of one
well-defined product or several closely related
products.3 A commodity sub-sector does not
necessarily lie strictly within one particular sector;
it can cut across a number of industrial sectors
(e.g. fish catching, transport and manufacturing).
The key to this definition is the particular network
under review. This might be based around a
common raw material, such as fish, or a common
output, such as fishery products.
Horizontal and vertical perspectivesThe horizontal perspective refers to a particular
stage of the production or distribution system
where a similar set of functions is performed
(e.g. fish retailers, vendors and hawkers). As for
the vertical perspective, fish are caught in the
sea, rivers and publicly or privately owned inland
waters (e.g. ponds), and work their way vertically
through the marketing system to the consumer.
This may include processing such as freezing,
canning, drying or salting. The combination of
vertical and horizontal perspectives shows the
sub-sector participants, illustrating where and
how they function in the marketing system.
MarketsAn assessment of the markets is essential when
performing a sub-sector assessment. This includes
an analysis of supply and demand, the number and
importance of buyers and sellers, prices, quality
standards, etc. Although it may not always be
straightforward to obtain precise figures on this,
an understanding of the approximate size of the
market (i.e. in terms of quantity and/or value)
provides an indication of the importance of the
sub-sector. In particular, if new interventions are
planned, there must be a viable long-term market
for the sub-sector commodity.
CompetitionIn the fish marketing chain, competition exists
across every level in that, for example, wholesale
traders compete with other wholesalers, and
exporters with other similar players. Competition
comes from domestic sources, as well as from
other countries. Understanding the competition,
domestic and international, can shed
considerable light on the problems faced by all in
the sub-sector, as well as illustrate the techniques
used by successful enterprises.
International dimensionIn the era of globalization, commodity chains or
food systems have to be considered from an
international perspective. In particular, export
industries are highly interlinked with international
markets. In addition to the dynamics of these
markets (e.g. supply, demand, prices, quality
requirements), it is important to understand the
wider context in which they function (e.g.
international seafood trade, food safety legislation,
international conventions and agricultural policies).
Technical issuesIn addition to economic, social and institutional
issues, it is important to understand the technical
aspects of the sub-sector, for example,
processing, transportation, packaging, means of
preservation such as chemicals or ice,
preservation, and different categories of loss (i.e.
quantitative and qualitative).
Co-ordinating agents,institutions and mechanismsCo-ordination of food systems is an active process
performed at different levels by participants of the
10
Sub-sector analysis
2 Both sources are available on the World Bank website as part of their Guide to Developing Agricultural Markets and Agro-enterprises.3 Wilcock, D. (1991) The sub-sector approach to agribusiness projects. Developing Alternatives 1 (2). (DAI, Bethesda, MD, USA.)
(1) Fish Marketing Systems.qxd 8/8/03 5:55 pm Page 10

system or by external stakeholders (e.g.
government policies and regulations). Firms at
particular key stages of a commodity sub-sector
are co-ordinating agents, for example:
� wholesale traders or processors are located at
key stages and handle or process large
volumes of a commodity, co-ordinating
assembly, transformation and distribution
� government agencies provide needed
services, commodity or agribusiness trade
associations
� formal groupings of producers, traders and
processors act as co-ordinating institutions;
various types of formal and informal
contractual arrangements, alternative forms
of markets (spot, futures, auction), electronic
information exchanges, and vertical
integration are co-ordinating mechanisms.
Uncertainty in the fisheries sector, the perishable
nature of fisheries commodities (limited storage
and shelf-lives), and increasingly stringent quality
and phyto-sanitary requirements are incentives
for sub-sector participants to devise effective co-
ordinating institutions and arrangements.
LeverageLeverage is the ability to affect large numbers of
sub-sector participants with the least action. Sub-
sector assessment aims to find cost-effective
opportunities where this can be accomplished –
these are known as points of leverage. The point
of leverage can be access to credit, a law that is
preventing access to, or expansion of, a sub-
sector, or a new technology that would
dramatically improve production capabilities.
Stakeholder commitmentIf a project is to be implemented based on the
analysis, it is critical to ensure the early
commitment of local organizations that have a
stake in the sub-sector. These organizations can
vary from fisherfolk co-operatives and NGOs to
trade associations, but they must play a substantial
role in the sub-sector and be involved in the
implementation once the assessment is completed.
Sub-sector Mapping
The sub-sector map is an essential tool for the
analysis of a commodity system. The map
illustrates the flow of commodities or products
from producer to consumer in quantitative,
graphic terms, as well as the interrelationships
between participants in the sub-sector. Several
components should be illustrated in the map.
� Markets Markets are the final destination of
the product (i.e. fish and seafood products in
our case). These can be defined either by
location, such as domestic or international, or
by the type of end-user (e.g. human
consumption, industrial users).
� Functions Each step through which the
product passes during the production and
distribution system is referred to as a function.
For example, in the case of the dried fish
marketing chain of the Bangladesh study, the
fish is caught, processed, transported, stored
and traded before it reaches the consumer.
� Participants Participants are the key actors
and their roles within the sub-sector (e.g.
fisherfolk, processors, wholesalers, exporters,
retailers, consumers). Operators or players are
other terms often used synonymously.
� Commodity chain Commodity chains tend to
consist of different channels through which
goods flow from the point of catch or
production to the end-user. Marketing
channels, on the other hand, are made up of
participants, differentiated by technologies,
functions, linkages and geographical locations.
Steps Involved in Sub-sector Analysis andResources Required
Box 2 provides an overview of the principal steps
involved in a sub-sector analysis. It is generally
accepted, that sub-sector assessment is an
iterative process through which the analysts hone
their skills and develop their techniques for
conducting assessments by actually doing them.
11
Sub-sector analysis
(1) Fish Marketing Systems.qxd 8/8/03 5:55 pm Page 11
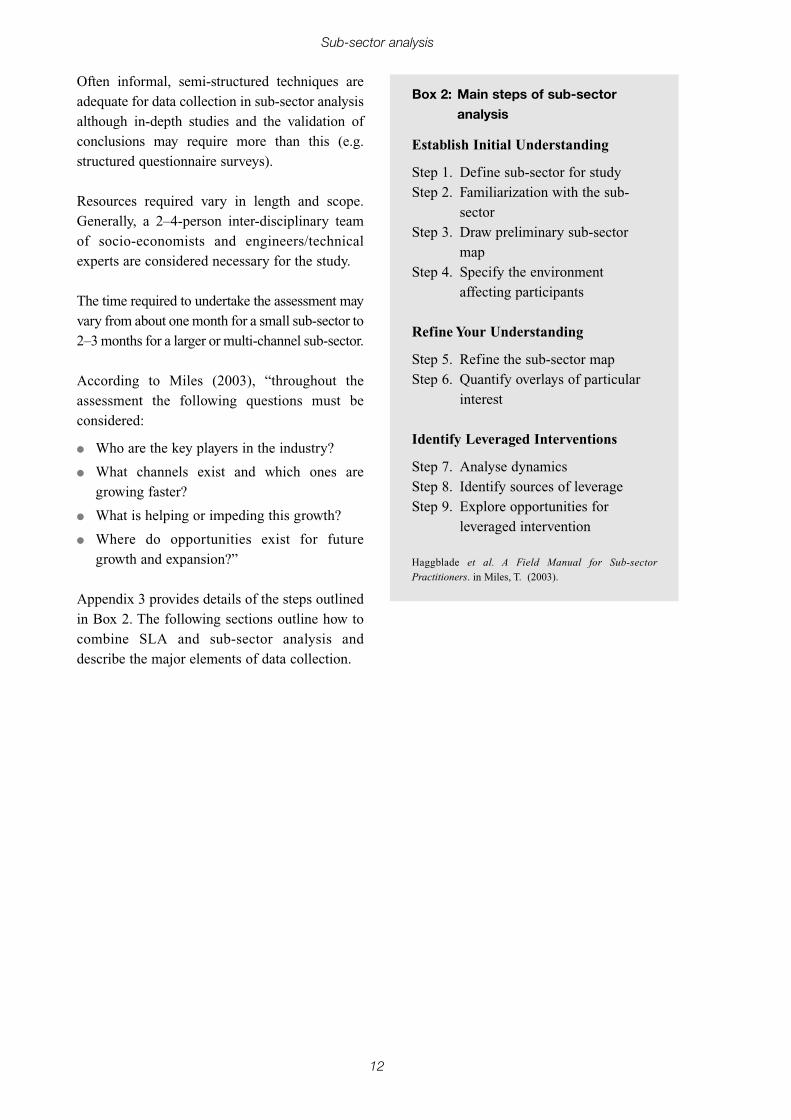
Often informal, semi-structured techniques areadequate for data collection in sub-sector analysisalthough in-depth studies and the validation ofconclusions may require more than this (e.g.structured questionnaire surveys).
Resources required vary in length and scope.Generally, a 2–4-person inter-disciplinary teamof socio-economists and engineers/technicalexperts are considered necessary for the study.
The time required to undertake the assessment mayvary from about one month for a small sub-sector to2–3 months for a larger or multi-channel sub-sector.
According to Miles (2003), “throughout theassessment the following questions must beconsidered:
� Who are the key players in the industry?
� What channels exist and which ones aregrowing faster?
� What is helping or impeding this growth?
� Where do opportunities exist for futuregrowth and expansion?”
Appendix 3 provides details of the steps outlinedin Box 2. The following sections outline how tocombine SLA and sub-sector analysis anddescribe the major elements of data collection.
12
Sub-sector analysis
Establish Initial Understanding
Step 1. Define sub-sector for studyStep 2. Familiarization with the sub-
sectorStep 3. Draw preliminary sub-sector
mapStep 4. Specify the environment
affecting participants
Refine Your Understanding
Step 5. Refine the sub-sector mapStep 6. Quantify overlays of particular
interest
Identify Leveraged Interventions
Step 7. Analyse dynamicsStep 8. Identify sources of leverageStep 9. Explore opportunities for
leveraged intervention
Haggblade et al. A Field Manual for Sub-sector
Practitioners. in Miles, T. (2003).
Box 2: Main steps of sub-sector
analysis
(1) Fish Marketing Systems.qxd 8/8/03 5:55 pm Page 12

Using a combination of the SustainableLivelihoods Approach (SLA) and sub-sectoranalysis proved to be a useful analytical frameworkto gain new knowledge on the post-harvestfisheries sector in the Bangladesh and Indiaresearch projects. Although commodity systems orsub-sectors are not usually seen as an entry pointfor a livelihoods analysis, a sub-sector approachseems justified if an entire, or at least a largeproportion of the population group, depends onone particular commodity (e.g. fish and otherseafood products in many parts of coastalBangladesh and India). Also, the DFID SustainableLivelihoods Guidance Sheets emphasize that“livelihoods and sector-wide approaches arebroadly complementary; each should gain fromrecognizing the strengths of the other”.
The approach permitted the investigation of thedomestic (i.e. Bangladesh) and international(India) fish and seafood distribution systems,highlighting poverty implications at the sametime. As already mentioned, the focus of the studyin Bangladesh was on market and credit accessissues, whereas the India study concentrated onglobalization, international food safety legislationand the seafood export industry.
In the following sections, an introduction to theinstitutional side of a project is provided beforeembarking on the technical issues covered by theresearch.
Building a ProjectPartnership
In order for projects to yield longer-term impact,it is important that strong partnerships are built
between the organizations involved in theresearch. Both the SLA and sub-sector approachrequire stakeholder commitment if the project isto make an impact beyond its actual lifetime.
In this context, a distinction needs to be madebetween those who are carrying out the actualresearch (core team) and other stakeholders. Thelatter may include primary stakeholders, such asfishing and trading communities, and secondarystakeholders, such as the funding agency orgovernment departments.
A clear identification of roles and tasks as well asallocation of resources between the coremembers of the research team need to be agreedupon at an early stage in the project. Both coreteam members and other stakeholders have a roleto play in designing the methodology andagreeing on the outputs to be produced within theboundaries provided by the funding agency.Often, the latter may have identified, throughprevious exercises, the key issues on which theresearch would be expected to concentrate.
Experience of this type of research shows thatsharing of information amongst the teammembers, and inception and consultationworkshops at the beginning and end of theprojects, stimulate the exchange of informationbetween the project core teams and otherstakeholders.
The following sections provide an overview ofthe main technical areas where the SLA and sub-sector approach were combined in the tworesearch projects.
Combining Sub-Sector
Analysis With The Sustainable
Livelihoods Approach13Chapter
(1) Fish Marketing Systems.qxd 8/8/03 5:55 pm Page 13

Approaching the Topic
Desk research was undertaken prior to the startof the fieldwork to gain an understanding of thefisheries sectors and the key issues involved. Inthe India project, this involved a study onglobalization, international seafood markets,food safety legislation and livelihoods-relatedaspects. In the Bangladesh project, the key pointswere linked to market and credit access in thedomestic fish distribution system. These studieshelped the respective research teams to build onexisting work and focus the design of fieldworkand data collection. (Systematic review by theresearch teams of research and grey literature isessential to avoid ‘reinventing the wheel’ andmaking unnecessary blunders.)
Mapping the Commodity Chain
In the first step of data collection, the commoditychain was mapped to identify the different marketparticipants and their functions. In addition totechnical and economic aspects as advocated insub-sector analysis, mapping also allows theidentification of the poor within the commoditysystem (e.g. small-scale fisherfolk andprocessors), as compared to large-scale operators,such as wholesale traders and exporters.
Although, it is preferable to obtain data on thenumber of players involved as well as quantitiesof produce and related values, this may provedifficult in the absence of reliable statistics. Inparticular, estimating the numbers of small-scaleoperators in countries with large populations,such as India and Bangladesh, is likely to requireseveral exercises, which may include techniquesother than commodity chain mapping (e.g.wealth ranking and participatory povertyassessments at the micro-level).
If poverty alleviation is the ultimate objective ofthe research (i.e. through policy advice or aproject intervention), the location of the poor andtheir functions on the map should be emphasized.
As part of a participatory exercise, it is suggestedthat participants in the marketing chain undertakethe mapping themselves as much as possible. Atthe same time, it needs to be borne in mind thatthe resulting maps may be quite location-specificreflecting the knowledge of the marketparticipant who drew the map. In general, larger-scale operators, such as wholesalers, can providethe best overview of the chain. Also,knowledgeable key informants, such asgovernment officials or NGO workers, can addextra information to the map.
It is recommended that each group of stakeholdersbe asked to draw a map of the commodity chainfrom their perspective. The research team shouldthen combine all the different maps into oneoverall commodity chain map. This ‘final’ mapcould be used for discussions with a group ofstakeholders for their feedback and furtherclarification if necessary. Appendix 4 provides amap produced as part of the Bangladesh project.The practical issues of mapping and relatedconstraints will be dealt with in the section belowon data collection and analysis.
Understanding theLivelihoods Context ofSub-sector Participants
Once the sub-sector and its participants weremapped out, the participants’ livelihoods wasstudied using the SLA as the methodologicalframework. As outlined in Table 1 this requiresthe collection and analysis of data on the keySLA issues discussed earlier (see page 6).
It needs to be borne in mind that each category ofoperator is likely to have several sub-categories(e.g. in the case of traders: wholesalers,intermediary traders and retailers; in the case ofprocessors: owners of the enterprise and workers).
14
Combining sub-sector analysis with the sustainable livelihoods approach
(1) Fish Marketing Systems.qxd 8/8/03 5:55 pm Page 14

Importance of keeping theanalysis poverty-focused
A common complaint of the SLA is that given its
holistic perspective it is difficult to know when
and where to stop the livelihoods analysis. For
example, it may be the case that a commodity
chain has several categories of players at the
same stage in the chain (e.g. traditional
fishermen, semi-traditional trawler operators,
large-scale industrial trawlers). Although one
might be tempted to study fully the livelihoods
context for each participant, owing to constraints,
such as time or other resources, it may be
necessary to focus on a few selected players only.
Typically, in poverty-related studies or
interventions, these should be either operators
belonging to the poor or those whose actions
have a significant bearing on the latter’s
livelihoods (e.g. main trader categories). Equally,
it may be sufficient to limit the analysis to key
issues for those who clearly do not belong to the
category of the poor. For example, it may be
sensible to focus on exporters’ ability to access
financial resources or influence policies and
institutions rather than concentrate on their
human or social capital assets. In essence, it is
important to remain focused in carrying out the
livelihoods part of the study.
Gender perspective
When studying the livelihoods context of
participants in the commodity system, it is
recommended that the analysis be undertaken
from a gender perspective, distinguishing
between female and male participants. For
example, depending on culture and other
circumstances, it is sometimes the case that
female participants in the sub-sector face more
difficulties in accessing certain types of
livelihoods assets or institutions compared to
their male colleagues. At the same time, specific
tasks performed in the commodity chain may be
primarily undertaken by female operators.
Dynamics of the sub-sector
By looking more closely at the changes that have
taken place, it is possible to develop an
understanding of how the stakeholders have been
affected by these changes and how they have
adapted to, or coped with them. For example, in
the India study, it was important to trace the
changes resulting from new legislation by
15
Combining sub-sector analysis with the sustainable livelihoods approach
Table 1: Framework for the analysis of livelihoods of sub-sector participants
Capital assetsHumanSocialNaturalFinancialPhysical
Vulnerability contextShocksTrendsSeasonality
Policies,institutions,processes
Livelihoods strategiesand outcomes
Fishing sector Traders Processors Exporters
(1) Fish Marketing Systems.qxd 8/8/03 5:55 pm Page 15

importing countries and its impact on poorparticipants in the export chain such as shrimppeelers.
Access to capital assetsFor details of the different livelihoods capitalassets see the section outlining the SustainableLivelihoods Approach (page 6) (see alsoAppendix 2). The following provides some of thekey elements to be considered in the context offishing communities, for example, human capitalnot only includes levels of education and healthbut also fishing skills and knowledge of theenvironment such as weather and sea conditions.Social capital involves access to support networks(e.g. relatives or friends) in times of hardship, ormembership of associations. Natural capitalprimarily includes aquatic resources such as fishstocks and other resources in the widercommunity context. In the context of fishcatching and marketing, physical assets includethe actual fishing gear (e.g. boats and nets), butalso the public infrastructure such as landingsites, market facilities and transportinfrastructure. Financial assets include cash,savings and access to formal and informal sourcesof credit. This may include transactions wherebyloan supply and marketing arrangements areinterlocked (i.e. obtaining credit has acorresponding, possibly pernicious, liability). Asalready indicated earlier, it is important to bear inmind that some capital assets can be negative (i.e.liabilities). For example, some experts suggestthat access to credit is best regarded as neither anasset nor a liability. This is because a loan takenby poor fisherfolk leads to a financial capitalliability which is offset by another capital asset(e.g. physical asset such as gear, or human capitalasset acquired through education).
Vulnerability contextFollowing the analysis of people’s assets, it isimportant to understand the vulnerability contextin which these assets can be used. These externalfactors are often related to the causes of povertywhich make poor people, in particular,vulnerable. Shocks, trends and seasonality are
the three main concepts that are usually analysedin this context and are described in the sectionoutlining the Sustainable Livelihoods Approach(page 6) (see also Appendix 2). In our analysis,introduction of new seafood trade legislationwould be described as a shock. Typical trendsinfluencing the livelihoods of fishing and tradingcommunities include declining fish stocks andincreasing demand due to, amongst other things,population growth. The two factors combinedresult in an upward pressure on fish prices to thedisadvantage of poor consumers. Seasonalityincludes recurrent changes throughout the yearthat influence people’s assets and livelihoodoutcomes. For example, the major fishing seasonmay occur during the rainy season, therebylimiting cash income to a few months per year.This, in turn, is likely to result in a strain on thehousehold cash flow and household food securityduring the lean season.
Policies, institutions and processesThese have been mentioned above in the sectionoutlining the Sustainable Livelihoods Approach(page 6) (see also Appendix 2). Within a sub-sector and SLA context, it is important toinvestigate to what extent key stakeholder groupsin the commodity chain can influence policiesand have access to institutions. The latter mayinclude trader associations, but also localgovernment departments and the judiciary. Inparticular, small-scale operators often sufferfrom lack of access to these institutions, which inturn makes them more vulnerable and contributesto their poverty.
Livelihood strategies and outcomesIn a fisheries context, the livelihood strategiesadopted (see section outlining the SustainableLivelihoods Approach (page 6) (see alsoAppendix 2) reflects the activities peopleundertake and the roles they play as part of thecommodity sub-sector (e.g. fish catching,processing or trading).
16
Combining sub-sector analysis with the sustainable livelihoods approach
(1) Fish Marketing Systems.qxd 8/8/03 5:55 pm Page 16

At the same time, it is important to be aware ofstrategies open to sub-sector participants whichare not necessarily fisheries-related (e.g.agricultural activities, migration, alternativeincome-generating activities). Income, well-being, food security as well as related wealthdifferences are some of the livelihoods outcomesresulting from livelihoods strategies employed bycommunity members. Within this context, theadded value of SLA to sub-sector analysis is thatit looks beyond the fishery sector itself,recognizing that stakeholders may have otheractivities and priorities outside the fishery sector.Also, cross-sector linkages, which are importantfrom the household point of view, can be tracedwithin this framework.
Through participatory poverty assessments(PPAs), it is possible to gain an understanding oflocal perceptions and definitions of poverty, andwhat people themselves see as pathways out of,or into, poverty. Individual livelihood strategiesmight deal with different dimensions of povertyand aim for different outcomes. In the case offisherfolk, access to consumption credit is animportant mechanism to ensure food security andthe ability to go fishing when the main seasonstarts. In addition to exploring people’slivelihood goals and preferred outcomes, it isalso worthwhile obtaining an insight into the waypeople rank the outcomes of their livelihoodstrategies. Some fisherfolk, tied to localmoneylenders through outstanding loans, mightperceive it as exploitation and as a factorpreventing them from moving out of poverty, asthey cannot invest in alternative income-generating activities. Others might value thesocial security provided by the more powerfulgroup within their community and accept the factthat they are limited in developing alternativelivelihood strategies.
Further, social groups and/or individuals mightvalue the trade-offs between immediatelivelihood gains and longer-term lossesdifferently, depending on the range of choicesthey have. Large-scale fishers might not beconcerned by the decline in fish resources as they
have sufficient resources to invest in otherlivelihood strategies if required. However,artisanal fishers might have a stronger incentiveto work towards sustainable management offishery resources, as they have limited alternativelivelihood strategies due to lack of assets andtheir vulnerability.
Economic AnalysisFocusing on FinancialCapital Assets
Traditional sub-sector analysis is primarily usedto develop recommendations for policy or projectinterventions focused on economic growth andperformance, whilst one undertaken incombination with the SLA places strongeremphasis on poverty reduction amongst themembers of the commodity system.Nevertheless, although the ultimate objectivemay be different, it is still considered necessaryto undertake an analysis of selected keyindicators to assess the performance of acommodity system. Also, it must not be forgottenthat economic growth is one of the requirementsfor poverty alleviation.
As outlined above in the section on sub-sectoranalysis, one set of indicators measuringeconomic efficiency is related to the structure,conduct, performance (SCP) model. If theshortcomings of the model are taken properlyinto account (e.g. a smaller number of enterprisesin the sub-sector does not automatically meanreduced levels of competition and vice versa),then the analysis can provide a useful insight intoa sub-sector’s functioning and its allocativeefficiency.
The analysis of prices and marketing marginsrepresents another set of indicators on which theperformance of a commodity system can beassessed. For price analysis, it is important todecide what levels of analysis (i.e. levels ofanalytical depth) are ultimately required giventhe context of the study. The ready availability ofprice series as well as related deflators such as
17
Combining sub-sector analysis with the sustainable livelihoods approach
(1) Fish Marketing Systems.qxd 8/8/03 5:55 pm Page 17
consumer price indices (used to obtain real
prices), are required to undertake more
sophisticated analyses. On the other hand, if the
research objectives have a strong focus on poverty
reduction, then it may not be necessary to spend a
lot of resources and time on price analysis.
As for marketing margins, it is recommended
that these are deconstructed as far as possible
into gross margins, cost elements and net
margins. This allows a better judgement of
whether certain sub-sector stages or their
respective participants are responsible for
excessive margins and returns. At the same time,
care must be taken in comparing the results of
these analyses across countries or regions, as they
are often location-specific. An example is
provided in Appendix 4 of how the analysis of
marketing margins was conducted as part of the
Bangladesh study.
Access to financial capital such as cash, savings
and credit is another area that is likely to be
important in the economic context of the sub-
sector analysis. For example, one of the
objectives of the Bangladesh study was to
investigate the link between the supply of loans
and marketing arrangements in the commodity
chain. Although these types of inter-locked
transactions can have beneficial impacts on the
functioning of the sub-sector, there may also be
negative effects in that direct and indirect capital
costs can be excessively high leading to the
exploitation of weaker participants in the chain.
Levels of income provide an insight into the
levels of relative wealth and poverty within a
fishing and trading community. Although there
may be individuals who are comparatively rich in
financial terms and otherwise, there are generally
vast numbers of market participants who operate
at the poverty line or below. A sense of well-
being is highly subjective, and needs to be seen in
the context of local wealth/poverty indicators.
For example, in some fishing communities in
India, boat and engine owners were in some cases
not perceived as better-off as they were usually
highly indebted and faced higher operation risks
(i.e. high running and investment costs).
Technical Post-harvestIssues
The investigation of technical issues is an
important element of sub-sector analysis,
however, this should also be undertaken within a
sustainable livelihoods context. This implies that
aspects, such as access to ice for preservation of
fish or losses (i.e. qualitative or quantitative)
incurred in the commodity chain, ought to be
assessed from a poverty angle (i.e. what are the
implications for the poor sub-sector participants).
Equally, technical measures affecting the product
also ought to be seen from the viewpoint of the
end-user. For example, inappropriate use of
chemicals used for fish preservation may affect
the health of poor consumer groups.
The Way Forward
Normally, the objectives designed at the beginning
of the research will indicate the way forward once
the research proper is completed. In general, there
are two broad avenues in which the research
findings may be used: (i) policy recommendations;
and (ii) project/programme interventions.
Within a livelihoods framework, these future
steps will be developed from a poverty
perspective. However, if the dissemination of
policy recommendations is to be effective, then it
is important to establish appropriate links when
the project is implemented. This may include
regular consultation with government and donor
decision-makers as part of workshops as well as
study visits. Findings obtained through micro-
level analysis need to be used for the preparation
of policies targeting the macro-level.
NGOs can also play a role in the dissemination of
recommendations if they are well-placed and have
access to fora where policy measures are discussed.
At the same time, NGOs may also be potential
18
Combining sub-sector analysis with the sustainable livelihoods approach
(1) Fish Marketing Systems.qxd 8/8/03 5:55 pm Page 18

users of research findings if they are carrying outproject interventions targeting the poor.
The identification of points of leverage isadvocated as part of sub-sector analysis, and theemphasis ought to be on measures which would
allow the most effective impact on povertyreduction rather than economic performance assuch (e.g. generation of foreign exchange). Thisapplies to both policy recommendations andproject interventions.
19
Combining sub-sector analysis with the sustainable livelihoods approach
(1) Fish Marketing Systems.qxd 8/8/03 5:55 pm Page 19

(1) Fish Marketing Systems.qxd 8/8/03 5:55 pm Page 20
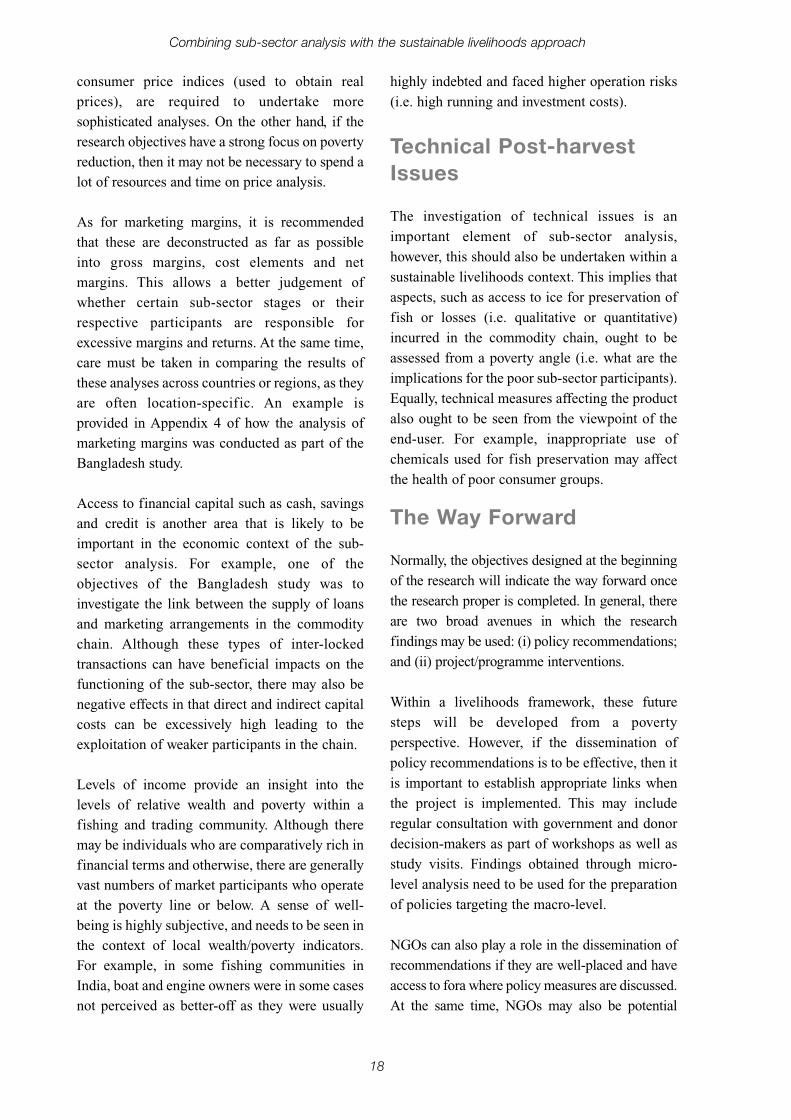
Steps Involved in the Case Study Projects
Tables 2 and 3 highlight the principal steps andmethods involved in the research projects in
Bangladesh and India which were mainly usedfor case study material in this guide. The outlineof activities, responsibilities and time-frame isintended to assist the design of research in otherpotential projects.
Practical Issues 14Chapter
Table 2: Project: ‘Fish Distribution from Coastal Communities in Bangladesh – Market and
Credit Access Issues’
Activities
Small, pre-project, stakeholder workshop in Chittagong todiscuss components of project with potential partners
Review of existing literature on market and credit issuesin the marine fish distribution system
Inception workshop attended by 30 stakeholdersbelonging to the private sector (fishing community andtrader representatives), public sector, NGOs, donors,research institutions including the University ofChittagong
Training of University of Chittagong research team inquantitative field survey methods to be used in coastalcommunities
First round of market assessments and participatory ruralappraisals (PRAs) in six coastal communities, pluspreliminary analysis to identify gaps for follow-up
Questionnaire data collection by the University ofChittagong with funding from DFID SUFER project
Entry, processing and analysis of questionnaire data
Second round of PRA in coastal communities (two roundsof data collection were considered necessary due to highfishing season and off-season)
Consultation workshops in Chittagong and Dhakainvolving stakeholders from the private sector, publicsector, NGOs and donors
Finalization of analysis and reports
Project partnersresponsible
Organization: CODECFacilitation:PHFRP Manager
CODEC
Organization andfacilitation: CODEC andNRI
Organization:CODECFacilitation: consultants/statisticians
CODEC and NRI
University of ChittagongMarketing and SociologyDepartments
University of ChittagongMarketing and SociologyDepartments
CODEC and NRI
NRI, CODEC and theUniversity of Chittagong
NRI, CODEC and theUniversity of Chittagong
Time-frame
January 2001
February 2001
March 2001
July 2003
July–September2001
November–December 2001
January–June2002
January andApril 2002
July 2002
August 2002–January 2003
(1) Fish Marketing Systems.qxd 8/8/03 5:55 pm Page 21

Review of methods used in the Bangladesh projectThe research process started with a desk reviewassessing existing information. The identificationof key issues and definition of areas ofinvestigation was undertaken at the inceptionworkshop. The main points thus identified fedinto the design of the field surveys, whichinvolved participatory, qualitative andquantitative survey techniques. In particular, thefollowing techniques were used:
� participatory rural appraisal (PRA) usingtechniques such as semi-structuredinterviewing, wealth ranking, mapping, andtransect walks
� rapid market appraisal (RMA) usingtechniques such as semi-structuredinterviewing and participatory mapping ofcommodity chains
� questionnaire surveys were conducted by theUniversity of Chittagong and the resultspresented in separate reports: this involved atraining course run by specialists inquantitative surveys (i.e. statisticians)organized at the CODEC training centre for theUniversity of Chittagong team in July 2001.
During the first round of participatory/qualitativeresearch (PRA/RMA), a good understanding ofthe ‘reality on the ground’ was developed. Thiswas followed by the questionnaire survey, theobjective of which was to obtain statisticallyvalid estimates representative of the targetpopulation. A second round of PRA/RMAexercises was undertaken to cover the off-season,as far as marine fishing was concerned, and to fillany remaining information gaps.
22
Practical issues
Table 3: Project: ‘Globalization and Seafood Trade Legislation – The Effect on Poverty in India’
Activities
Start-of-project workshop in Visakhapatnam to prioritizeresearch agenda, identify tools and techniques to meetobjectives
Desk research on international seafood legislation
Data analysis and assessment of the main export marketsfor Indian seafood products, particularly the EU, Japanand USA
Data collection and analysis of the seafood export supplychains in Andhra Pradesh, Kerala and Orissa
Analyse the changes in the livelihoods of poorparticipants in the export supply chain
End-of-project workshop to present research findings,validate methodology and develop policyrecommendations
Dissemination activities – papers, reports, web articles(Final Technical Report)
Further dissemination activities
Project partnersresponsible
NRI, ICM, CMS andSIFFS
NRI
NRI
ICM, CMS, SIFFS andNRI
ICM, CMS, SIFFS andNRI
NRI, ICM, CMS andSIFFS
NRI
NRI and PHFRP
Time-frame
June 2001
March 2002
June 2002
June 2002
December 2002
January 2003
May 2003
2003–04
(1) Fish Marketing Systems.qxd 8/8/03 5:55 pm Page 22

The information thus generated was used for thedevelopment of policy suggestions, which werepresented at final consultation workshops inChittagong and Dhaka together with the findingsof the research.
Types of information covered
For each operator category (i.e. fish suppliers andtraders) in the Bangladeshi marine fishdistribution chain, the following types ofinformation were elicited as much as possible:
� socio-demographic information: wealth,gender and age
� household asset base: human capital, socialcapital, natural resources, physical capital andfinancial capital
� vulnerability context: shocks, trends, changes,seasonality, pollution, etc.
� marketing system: supply and demandsituation, pricing mechanisms, prices,marketing costs and margins, technical post-harvest issues, food safety issues, availabilityof market information and means ofcommunication used, infrastructure, changingconsumption patterns, performance ofmarketing system versus equityconsiderations
� savings and credit system: types of savingsand credit, access to formal and informalsources of credit, relative costs of credit, linksbetween fish distribution and credit supply,patronage relationship, occurrence ofexploitative practices, lessons from thebroader micro-finance sector
� policy, institutional and process issues (alsobeyond the fish production and tradingcontext): national and local government,donors, NGOs, the private sector.
Review of methods used in the India projectThe methods employed during the field studieswere standardized as much as possible so thatresults from the three states (i.e. Andhra Pradesh,Kerala, and Orissa) could be compared.
The basic research question to be answered was‘How has international seafood legislation (suchas the EU directive) affected the livelihoods ofpoor people who depend on the export industry?’
To answer this question, we needed to know whowas involved in the export industry (i.e. all thecategories of people involved from the time theshrimp is caught to the time it is loaded on to theship).
This involved a two stage study: (i) mapping theexport supply chain; (ii) identifying the poorwithin the supply chain and studying the impactthat international legislation has had on them.
Stage 1 – Mapping the supply chain
Information on the supply chain was collectedfrom secondary sources such as:
� key informants from government authorities,central agencies
� published documents of various previousprojects and workshops/meetings
� magazine and periodical articles
� the world-wide web
� previous studies of export chains in the threestates.
Stakeholders identified include:
� crew and owners of trawling vessels
� crew and owners of artisanal fishing units
� owners and workers of aquaculture farms
� middlemen traders who deal exclusively inexport species
� peeling shed owners and workers
� processing plant owners and workers
� exporters
� ancillary industries such as ice plants,transportation, headload workers, etc.
23
Practical issues
(1) Fish Marketing Systems.qxd 8/8/03 5:55 pm Page 23

Stage 2 – Understanding the impactof the legislation
The following questions were asked to the
various stakeholders:
(i) Who are the poor in the supply chain?
(ii) What has been impact of international
legislation on these?
(iii) What have been the changes in their
livelihood strategies?
(iv) What has been the impact of international
legislation on the stakeholders, particularly
the poor participants of the Indian seafood
industry?
The main tool employed for the fieldwork was
participatory poverty assessment (PPA) in focus
group discussions and individual interviews with
the different stakeholders.
Data Collection Methods
Desk studies
Desk studies are particularly important if there is
little knowledge of the research topic prior to
project design and data collection. Desk-based
literature reviews were carried out by both
projects prior to the start of fieldwork. The
Bangladesh project primarily focused on the
domestic fish marketing chain emphasizing
market and credit access issues. The literature
review mostly relied on printed material. On the
other hand, given its nature and context (i.e.
globalization, seafood safety legislation and
livelihoods), more use was made of web-based
material in the India project (see Appendix 1 for
a list of websites on fisheries-related topics). The
topics covered in this desk research included:
� globalization issues, focusing on potentially
positive and negative impacts
� the Indian fishing industry
� major export markets for Indian seafood
products, and the dynamics and patterns
involved (i.e. mainly USA, EU, Japan and
China)
� international seafood safety legislation
focusing on both the institutional and
technical context.
The lack of reliable fish export statistics and the fact
that import figures for one country did not always
match supposedly corresponding export figures for
24
Practical issues
Participatory poverty assessment (PPA) was undertaken to gain an understanding of whoconstitute the poor within the fishing communities in India. PPAs were conducted using acommon framework in the three states. Efforts were made to encourage participants from thecommunities to produce their own definitions of social and economic categories (relativewealth) that are relevant to their village and to place the various stakeholders, such as artisanalfishermen, trawler crew and peelers, in these categories based on their observations. Theseassessments were made at community level to understand the poverty within the villagesituation and at stakeholder level so as to characterize poverty as it is relevant to the exportsector and thus to try to identify the ‘export poor’.
One of the problems identified during the discussions was how poverty was defined. Themethodology gave a subjective assessment of poverty based on ideas created by participants inthe discussions rather than an absolute measure of wealth. It was felt that more in-depth studiescould be undertaken in this regard. Poor in some areas may mean not poor or not-so-poor inothers. Details of how different people (including the poor) are paid or compensated for theirwork/efforts could have been included.
Box 3: The use of participatory poverty assessments
(1) Fish Marketing Systems.qxd 8/8/03 5:55 pm Page 24

another country was a problem encountered by the
research team. The use of best judgement was often
the only solution in these circumstances.
Participatory survey methods
Historically, information-gathering exercises
have tended to be protracted, expensive, narrow
in their focus and heavily weighted by
preconceived ideas. As a result, in the early
1980s, the rapid rural appraisal (RRA) approach
to initial project preparation was developed. By
the end of the decade, there was a range of RRA
methods and approaches available which then
gave rise to participatory rural appraisal (PRA) at
the beginning of the 1990s. In addition to these
two, probably the best known informal appraisal
methods, there are now newer methods such as
PLA (participatory learning and action) and PPA
(participatory poverty assessment).
Although RRA and PRA have many features in
common, the latter added a few elements which
were not always prominent in RRA: for example,
more emphasis on participation, change of
attitudes towards rural populations, trust between
project partners, sharing of information and
ultimately, the empowerment of local communities.
The main principles of informal data gathering
include triangulation, flexibility and multi-
disciplinary teamwork.
� Triangulation is intentionally collecting
information from several different
perspectives which can be achieved through
the team composition (e.g. level of
experience, gender and discipline), selection
of units of analysis (e.g. farmers groups,
households or individuals) or techniques (e.g.
scoring, mapping and diagramming).
� Flexibility is the absence of a rigid protocol
and the possibility of changing techniques and
tools when necessary. At the same time, it
ought to be remembered that rapid and
participatory data collection exercises have to
be well-planned.
� Multi-disciplinary teamwork implies a team
of individuals with different professional
backgrounds responsible for collecting and
analysing data from rural environments.
Important points to remember when undertaking
an informal survey (or indeed any survey)
include the following.
� Decide on the objectives before beginning.
Without clear objectives, there is a danger that
the exercise will be unfocused and lead to
feeble conclusions.
� Decide on the team composition (right mix of
experience, gender and discipline), team
training required, team size (not more than
two or three), and number of survey teams
carrying out parallel surveys (not more than
three). In addition, aspects such as team
dynamics, team introduction to villages, note
taking and report writing, and the need for a
common base for the survey teams need to be
properly addressed.
� Define the role of the survey team, i.e. the fact
that survey methods such as PRA and PPA are
widely recognized as a means of involving the
local population in the analysis of their own
livelihoods systems cannot be stressed enough.
� Consider stratification of the survey area or
population if not all locations, individuals or
groups in the demonstration areas are to be
included in the survey. The survey area or
population should be divided into sub-sets
within which the variability of key factors is
expected to be lower. A sample of individuals,
groups or locations for actual survey can then
be selected from each sub-set. A typical
example is that of ecological zones or
technologies used (e.g. fishing systems).
� Decide in advance whether to have groups or
individuals of coastal communities as the unit
of investigation. This will depend on the
circumstances and the subject of analysis.
Group discussions are particularly useful if the
information required is not expected to vary
widely between households. Also, if the issue
under discussion is not too sensitive in nature,
25
Practical issues
(1) Fish Marketing Systems.qxd 8/8/03 5:55 pm Page 25
a group interview may provide an easyoverview of likely variables, such as fishingtechnologies used.
� Cross-check findings by direct observation ofimportant indicators to avoid being misled byrumour, myth or gossip.
The main tools and techniques used inparticipatory data collection include:
� semi-structured interviews
� different forms of ranking and scoring (e.g.wealth ranking, pair-wise ranking, matrixscoring)
� mapping (e.g. transect walks, resource maps,commodity chains)
� construction of diagrams (e.g. seasonalcalendars, historical profiles, daily routinecharts, Venn diagrams, decision trees)
� participatory poverty assessments (oftenusing a combination of the above techniques).
A detailed description of all the tools andtechniques used in participatory appraisals isbeyond the scope of this guide. If moreinformation is required it is advisable to consultthe literature (see also Appendix 1) or participatein a training course. A selection of tools used inthe Bangladesh and India studies (e.g. checklistsfor semi-structured interviewing, mapping andparticipatory poverty assessments) is provided inAppendix 5.
Rapid market appraisalThe origins of rapid market appraisal (RMA) aresimilar to those of rapid rural appraisal (RRA), inthat formal surveys were often seen as lengthy,costly and management intensive. As aconsequence, a set of tools was developed byHoltzman (2003), who also used the sub-sectorapproach as the framework for analysis.
Unlike questionnaire surveys, which usuallydepend on enumerators, RMAs are conducted byanalysts who should preferably have several yearsof experience of the topic.
According to Holtzman (2003), “used by
experienced analysts, having a cross-country
comparative perspective, rapid appraisal is a way to:
� gain a food systems view of how a commodity
sub-sector is organized, operates and
performs
� identify sub-sector constraints and
opportunities
� identify and diagnose policy and regulatory
problems that require government (and
donor), analysis, attention and action
� prescribe interventions in food system
organization, technology and management.
Rapid appraisal methods can also be useful
exercises at the beginning of longer-term
programmes of applied research and testing of
marketing systems innovations. In addition, they
can be used to do focused study up-dates (of
earlier formal surveys), and as a complement to a
longitudinal, formal research programme.
Finally, rapid appraisal surveys can be used to
identify agri-business opportunities, as well as to
design, monitor and evaluate donor-funded
projects and policy reform programs”.
Rapid market appraisal techniques mostly rely on
semi-structured interviews with key informants,
knowledgeable observers of a sub-sector and a
minimum number of participants at different
stages of the commodity system. Interviewing at
least 3–5 participants at each stage is considered
necessary to obtain a reasonably reliable picture of
a certain category of operator. The decision on the
minimum number of interviewees depends on the
divergence of answers and opinions obtained from
them. The coverage of more controversial issues
requires a relatively larger number of interviews.
Mapping commodity chains forms part of the set
of ‘informal’, semi-structured techniques used to
identify participants of the sub-sector, its
functioning, quantities and values involved,
technologies used, constraints and opportunities.
The drawing of commodity maps by sub-sector
participants or knowledgeable key informants is
26
Practical issues
(1) Fish Marketing Systems.qxd 8/8/03 5:55 pm Page 26
accompanied by interviews aiming to obtain
information on these key issues.
Selective visits to physical facilities such as
landing sites, processing sheds and markets are
necessary to cross-check the information
obtained through interviews. Direct observation
of operations and facilities helps to improve the
understanding and to cross-check the data
already obtained. Another form of cross-
checking (or triangulation) is based on posing the
same set of questions to other operators at the
same stage of the sub-sector or at adjacent stages
in a technique known as mirror-image
interviewing (Holtzman, 2003).
One of the practical aspects of rapid appraisals
undertaken with market participants include the
latter’s time constraints – they often tend to have
little time, particularly when visited during their
working hours. As a result, checklists and interview
guidelines need to be more focused as compared to
semi-structured interviews or group discussions
carried out with villagers (e.g. fisherfolk or
farmers). Sometimes, it is more appropriate to
agree an alternative date for a discussion with an
individual or a group of operators deemed
important as information sources.
Quantitative methods/questionnaire surveys
Questionnaire surveys should be seen as a tool to
complement RMAs and PRAs. In particular,
formal sample surveys are required if the
objective of the study is to derive statistically
valid, quantitative estimates that are
representative of the target population.
According to the DFID Sustainable Livelihoods
Guidance Sheets, livelihoods analysis makes use
of both qualitative and quantitative research,
whereby the latter seeks to place reasonably firm,
absolute levels or values on the things that are
being investigated.
The scope of this guide is not to provide an
introduction into statistics but to highlight a
number of key questions4 deemed important for
the implementation of quantitative surveys.
The planning stage, beginning with the setting of
exact objectives, is one of the most important
parts of all surveys. In the case of statistical
surveys, this includes deciding on the type of
data to be collected, target population, sampling
techniques, statistical measures and analytical
tools to be used, and presentation of results.
The types of data that have to be considered
include continuous data (e.g. weight data), counts
(e.g. number of individuals in a household), scores
(e.g. qualitative loss data might use numbers of 0 to
5, with zero being no loss and 5 being severely
damaged), and binary/categorical data (e.g.
classification of fishing technologies into
categories such as main gear used; if only two
categories exist then one would talk of binary data).
Sampling is used where it is unnecessary,
impossible or too expensive to measure
everything. Therefore, a small fraction of the
material is measured. When designing a
sampling scheme, it is important to define a
‘target population’ for which information is
required. A sample from this population is then
selected to estimate values for the population
(e.g. percentage of fishermen using a particular
fishing method).
There are two statistical concepts which are
important for sample estimates: bias and
precision.
A biased estimate is one which tends to always
overestimate the ‘true’ population value (or tend
to underestimate it). For example, if extension
officers are asked to nominate farmers to
participate in a survey, they might tend to select
the more progressive farmers, or ones who can
better afford to take risks. This would distort the
27
Practical issues
4 Adapted from Sherington, J. (1997) Statistical Concepts in Research (prepared for NRI’s Grain Storage Management Course). Chatham,UK: Natural Resources Institute. (unpublished)
(1) Fish Marketing Systems.qxd 8/8/03 5:55 pm Page 27

results. Ideally, samples should allow for unbiasedestimates of the characteristics of interest.
Precision relates to the consistency of estimatesif the sampling was carried out a number oftimes. In general, the larger the sample, the moreprecise the estimate. For example, a sample of1000 plots will give a more precise estimate ofyield than a sample of 10 plots. Precision alsodepends on the amount of random variationbetween units. For a given sample size,measurements with large standard deviations willgive less precise estimates than those with smallstandard deviations.
While both unbiasedness and precision are bothimportant, unbiasedness is generally a higherpriority. There is little use in getting precisely thewrong answer!
The best way to ensure lack of bias is by random
selection of units in the population. Theoverriding principle for selection of a simplerandom sample is that every unit should have(approximately) the same chance of beingselected. Where this proves impossible, then thetarget population (and related objectives) mayhave to be redefined (e.g. farms less than 1 kmfrom a road or grain store accessible with acertain type of probe).
There are a number of common statisticalmeasures to be calculated such as mean, median,standard deviation and minimum - maximum. Inaddition, trends and relationships can be studied,and statistical tests carried out. Standard errorsare calculated to put a precision on estimates.Once again, it is not intended to provide here acomplete handbook on statistical data collectionin rural areas but to give some guidelines forthose involved in a research project.
For collecting baseline information indemonstration areas, it is best to concentrate onthe avoidance of bias when selecting the samplepopulation and to use the most commonmeasures for calculation.
In most situations, it will be necessary to designdata recording forms (e.g. questionnaires) foreach project or demonstration area andtechnology. As indicated earlier, survey and datarecording forms should be kept to a minimum.Avoid collecting unnecessary data or informationwhich can be better obtained using participatorymethods.
When using data recording forms, it is suggestedthat manual copying be limited as much aspossible owing to the possible introduction oferror and loss of time efficiency.
Nowadays, the use of computers and statisticalprogrammes is fairly standard for the analysis ofquantitative data. Aside from common databaseand statistical computer programmes such asAccess, SPSS and SAS, spreadsheet programmescan also be useful, particularly if databases arerelatively small and the statistical calculations tobe carried out are not complex.
Although often overlooked, presentation ofresults is an important part of every statisticalanalysis. Well presented results can greatlyfacilitate the interpretation of statistical data andthe drawing of conclusions.
Numerical results are usually presented in theform of tables or graphs, depending on whethernumerical precision or an indication of trends isrequired. Nevertheless, in the evaluation oftechnologies, some statistical data may feeddirectly into financial calculations.
In the case of the questionnaire surveysundertaken by the University of Chittagong,SPSS (version 10.0) was used for data analysis.The statistical techniques for analysis andpresentation include: frequencies, averages,dispersion, ANOVA and chi-square tests, tablesand graphs. Financial management tools werealso used (e.g. ratio analysis).
28
Practical issues
(1) Fish Marketing Systems.qxd 8/8/03 5:55 pm Page 28

Combinations of quantitativeand qualitative methodsIf carried out in a focused manner, the qualitativeand quantitative survey techniques can
complement each other. Box 4 indicatesexamples of how the two survey techniques candraw on each other during the survey design, anddata collection and analysis stages.
29
Practical issues
Type A: Merging tools and attitudes
� Thinking about sampling in designing enquiry based on qualitative methods.
� Coding responses to open-ended questions from qualitative enquiries.
� Using statistical techniques to analyse unbalanced data sets and binary, categorical andranked data sets, arising from participatory enquiry.
� Creating frequency tables from coded data.
� Modelling binary and categorical data generated from ranking and scoring exercises.
� Using mapping to generate village sampling frames for: questionnaire surveys; type 2 ortype 3 on-farm trials.
� Using attitudes from participatory methods (e.g. to reduce the non-sampling error inquestionnaire surveys or farmer-researcher misunderstandings in on-farm trials).
Type B: Sequencing of tools
� Using participatory techniques in exploratory studies to set up hypotheses, which can thenbe tested through questionnaire-based sample surveys or via on-farm trials.
� Choosing a random sample and conducting a short questionnaire survey to gain informationon key variables, which are then investigated in-depth by participatory enquiry.
Type C: Concurrent use of tools
� Survey of statistically selected sample members, using pre-coded questionnaires todetermine target population characteristics of a qualitative (e.g. opinions on a newtechnology) or quantitative (e.g. crop production) nature.
� Setting up scientific experiments (on-station or type 1 trials) to study the effects of specificinterventions in a controlled environment (e.g. on-station or ‘contract’ research).
� Using aerial photographs or GIS.
along with:
� Participatory enquiry for attitudes, beliefs and perceptions of the target population.� Type 3 trials.
Box 4: Examples of qualitative and quantitative combinations of survey instruments
Note: Type 1 on-farm trials are those designed and managed by researchers. Type 2 trials are designed by researchers but managed byfarmers. Type 3 trials are designed and managed by farmers and monitored by researchers (Coe and Franzel, 1997).
Source: Marsland et al. (2001).
(1) Fish Marketing Systems.qxd 8/8/03 5:55 pm Page 29

(1) Fish Marketing Systems.qxd 8/8/03 5:55 pm Page 30

Alam, K. (1996) Two Fishing Villages of
Bangladesh: A Community Study. PhD thesis,Department of Development and Planning,Faculty of Social Sciences, Aalborg University,Denmark.
Ashley, C. and Carney, D. (1999) Sustainable
Livelihoods: Lessons from Early Experience.London: Department for InternationalDevelopment.
Ashok, M. S., Clucas, I. J., Greenhalgh, P.,Prasad, D., Salagrama, V., Simon, G., Supkar, R.and Vivekanandan, V. (2003) Report on Final
Workshop on Globalization and Seafood Trade
Legislation: The Effect on Poverty in India;
23–24 January 2003, Visakhapatnam, Andhra
Pradesh, India.
Campbell, J. (2000) Literature Review: TheUtilization of Marine Fish and the SustainableLivelihoods of the Poor in India. ProjectMemorandum, Sustainable Coastal LivelihoodsProject India. (unpublished)
Carney, D. (ed.) (1998) Sustainable rurallivelihoods: what contribution can we make?Papers presented at the Department for
International Development’s Natural Resources
Advisers’ Conference, July 1998. London:Department for International Development.
Chambers, R. (1994) The origins and practice ofParticipatory Rural Appraisal. World
Development, 22 (7): 953–969.
Chowdhury, I. U. (2002) Institutional and socio-political context of coastal fishing communitiesin Bangladesh. Paper presented at consultationworkshops on Fish Distribution from Coastal
Communities – Market and Credit Access Issues,22–23 July 2002, Chittagong, and 25 July 2002,
Dhaka, Bangladesh. Kleih et al. (eds).
CMS (2002) Globalization and Seafood TradeLegislation: The Effect on Poverty in India. FinalReport for Orrisa; Project Report. Bangalore:Cirrus Management Services. (unpublished)
DFID (1997) Eliminating World Poverty: A
Challenge for the 21st Century. White Paper.London: Department for InternationalDevelopment.
DFID (2000) Eliminating World Poverty: Making
Globalization Work for the Poor. White Paper.London: Department for InternationalDevelopment.
DFID (no date) Sustainable Livelihoods
Guidance Sheets. London: Department forInternational Development.
Holtzman J. S. (2003) Rapid Appraisals of
Commodity Sub-sectors. Abt Associates Inc.,Bethesda, MD, USA. (located on World Bankwebsite)
ICM (2002) Research Project on Globalizationand Seafood Trade Legislation: The Effect onPoverty in India. Final Report for AndhraPradesh; Project Report. Kakinada: IntegratedCoastal Management. (unpublished)
References,
Further Reading Material
and Relevant Websites11Appendix
(2) Fish Marketing Append.qxd 8/8/03 5:59 pm Page 31
Kleih, U., Alam, K, Dastidar, R., Dutta, U.,Oudwater, N. and Ward, A. (2003) Livelihoods inCoastal Fishing Communities, and the MarineFish Marketing System of Bangladesh –Synthesis of Participatory Rural Appraisals inSix Villages, and Assessment of the MarketingSystem. Chittagong: Community DevelopmentCentre/Chatham, UK: Natural ResourcesInstitute. (unpublished)
Kleih, U., Alam, K, Dastidar, R., Dutta, U.,Solaiman, Md., Chowdhury, I. U., Nurul Kareem,A. N. M. and Ward, A. (2002) Report onconsultation workshops on Fish Distribution
from Coastal Communities – Market and Credit
Access Issues, 22–23 July 2002, Chittagong, and
25 July 2002, Dhaka, Bangladesh.
Marsland, N., Wilson, I., Abeyasekera, S. andKleih, U. (2001) Combining quantitative (formal)and qualitative (informal) survey methods. Socio-
economic Methodologies for Natural Resources
Research. Best Practice Guidelines. Chatham,UK: Natural Resources Institute.
Miles T. (2003) Agribusiness Sub-sector
Assessments. Development Alternatives Inc.Bethesda, MD, USA. (located on World Bankwebsite)
NRI (1996) Participatory Rural Appraisal – AManual on Issues, Principles, and Tools. Chatham,U.: Natural Resources Institute. (unpublished)
Nurul Kareem, A. N. M. (2002) Fish marketingsystem from coastal areas of Bangladesh. Paperpresented at consultation workshops on Fish
Distribution from Coastal Communities – Market
and Credit Access Issues, 22–23 July 2002,
Chittagong, and 25 July 2002, Dhaka, Bangladesh.Kleih et al. (eds).
Oudwater, N. (2001) The sustainable livelihoodsapproach and its relevance for fish marketing.Paper presented at the workshop on Poverty
Alleviation and Livelihood Security Among the
Coastal Fishing Communities – Market and Credit
Access Issues, Chittagong, 27–28 March 2001.
Oudwater, N., Greenhalgh, P. and Clucas, I.(2002) Globalization, Seafood Industry, andLivelihoods; Project Report. Chatham, UK:Natural Resources Institute. (unpublished)
Pretty, J. N., Guijt, I., Thompson, J. and Scoones,I. (1995) Participatory Learning and Action: A
Trainer’s Guide. London: International Institutefor Environment and Development.
Scarborough, V. and Kydd, J. (1992) Economic
Analysis of Agricultural Markets: A Manual.
Chatham, UK: Natural Resources Institute.
Sherington, J. (1997) Statistical Concepts inResearch (prepared for NRI’s Grain StorageManagement Course). Chatham, UK: NaturalResources Institute. (unpublished)
SIFFS (2002) Globalization and Seafood TradeLegislation: The Effect on Poverty in India – ACase Study of Kerala State, India; ProjectReport. Trivandrum: South Indian Federation ofFishermen Societies.
Solaiman, Md. (2002) Fishing communities:credit and gender issues. Paper presented atconsultation workshops on Fish Distribution from
Coastal Communities – Market and Credit Access
Issues, 22–23 July 2002, Chittagong, and 25 July
2002, Dhaka, Bangladesh. Kleih et al. (eds).
Theis, J. and Grady, H. (1991) Participatory
Rapid Appraisal for Community Development.
London: International Institute for Environmentand Development/Save the Children Federation.
Wandschneider, T. (2001) Paddy, Fish andVegetable Marketing Systems in NorthwestBangladesh – Current Situation andOpportunities for Intervention. Consultancyreport prepared for CARE Bangladesh. Chatham,UK: Natural Resources Institute. (unpublished)
32
Appendix 1
(2) Fish Marketing Append.qxd 8/8/03 5:59 pm Page 32
33
Appendix 1
General livelihoods-related websites
Sub-sector analysis-related sites/pages
Selection of general fisheries-related websites
http://www.dfid.gov.ukhttp://www.livelihoods.orghttp://www.undp.org/sl
http://wbln0018.worldbank.org/essd/essd.nsf/Agroenterprise/agro_guidehttp://lnweb18.worldbank.org/essd/essd.nsf/Agroenterprise/subsector_assess
www.globefish.org/index2.htmwww.fao.org/fi/default.aspwww.fis.com
EU Sanitation home page
EU Veterinary Inspections – Reports
EU Sanitation directives
Lists of establishments
Eurostat – Statistical Office of the EuropeanCommission – main access page
Centre for the Promotion of Imports fromDeveloping Countries
europa.eu.int/comm/dg24/
europa.eu.int/comm/food/fs/inspections/vi/reports/index_en.html
forum.europa.eu.int/Public/irc/sanco/vets/home
forum.europa.eu.int/irc/sanco/vets/info/data/listes/table0.html
www.europa.eu.int/comm/eurostat/
www.cbi.nl
International Association of Fish Inspectors
HACCP Training Programs and ResourcesDatabase (USDA)
USFDA – Fish Encyclopedia
National Marine Fisheries Service
US FDA/Center for Food Safety and AppliedNutrition (CFSAN)
Australian Food Safety Web
China Fishery home page
Standards and Regulation in Japan
FishBase – A global information system onfishes
Codex Alimentarius Commission – main page
Southeast Asian Fisheries Development Center
www.iafi.net/
www.nal.usda.gov/fnic/foodborne/haccp/index.shtml
www.cfsan.fda.gov/~frf/rfe0.html
www.st.nmfs.gov/
vm.cfsan.fda.gov/list.html
www.safefood.net.au/index.htm
www.lib.noaa.gov/china/chinafp.htm
www.jetro.go.jp/se/e/standards_regulation/index.html
www.fishbase.org/
www.codexalimentarius.net/
www.seafdec.org/
Selection of websites
(2) Fish Marketing Append.qxd 8/8/03 5:59 pm Page 33

(2) Fish Marketing Append.qxd 8/8/03 5:59 pm Page 34

The Sustainable Livelihoods
Approach and its Relevance
for Fish Marketing5
12Appendix
This appendix provides an overview of the keyelements of the Sustainable LivelihoodsApproach (SLA) from the viewpoint of coastalcommunities and those engaged in the fishdistribution chain.
The ultimate goal of Sustainable Livelihoods(SL) is to maintain an income, to minimize socialexclusion, achieve social equity and a long-termproductivity of natural resources withoutundermining livelihoods or compromisinglivelihood options open to others.
In the White Paper on International Development1997, DFID outlined its commitment to povertyreduction through policies and actions promoting:
� Sustainable Livelihoods
� education, health and opportunities for thepoor
� protection and better management of thenatural and physical environment.
From this policy objective of elimination ofpoverty, DFID has worked towards developing aconceptual and operational framework thatconstitutes the Sustainable LivelihoodsApproach. Promoting the SLA within currentdevelopment thinking is seen as a means ofaddressing the ultimate target of povertyelimination. Many NGOs such as Oxfam andCARE have contributed to the development ofthe SLA by adopting it at an early stage andproviding critical feedback and suggestionsbased on their ideas and field experiences.
Definition and PrinciplesUnderlying the SustainableLivelihoods Approach
A livelihood comprises the capabilities, assetsand activities required for a means of living. Alivelihood is sustainable when it can cope with,and recover from, shocks and maintain or
In sum, there are three dimensions to Sustainable Livelihoods (SL):
� an objective supporting the goal of poverty elimination� a framework for thinking about poverty� an approach for addressing poverty (the most important dimension)
SL is NOT:
� a panacea for poverty eradication� a blueprint to guide implementation of programmes or projects targeting poverty
Box A1: The three dimensions of Sustainable Livelihoods
5 Based on Oudwater (2001).
(2) Fish Marketing Append.qxd 8/8/03 5:59 pm Page 35

enhance its capabilities and assets, both now andin the future, while not undermining the naturalresource base (Carney, 1998).
In this context, poverty-focused developmentactivities should be:
people-centred – the emphasis is on people,not on resources per se: it mainly focuses onpeople and livelihoods at the micro-community level (e.g. coastal fishingcommunities) and at higher policy andplanning levels (e.g. local and centralgovernments and NGOs)
holistic – it is important to look at all thedifferent resources, opportunities andconstraints that people face in pursuing andimproving their livelihood strategies (e.g.fishing, and also other income-generatingactivities)
dynamic – it is important to recognize thatlivelihoods are changing in response toexternal shocks and trends (e.g. declining fishstocks, seasonal fluctuations in supply anddemand), and it is necessary to understandthese changes, how the people themselvesperceive these changes and how they haveadapted their livelihood strategies in responseto these changes
building on strengths – the approach startswith an analysis of strengths and resourcesrather than a list of constraints and needs
linking macro-micro levels – the approachattempts to bridge gaps and makes explicitlinks, for example, on the effects of nationalpolicies on local fishing and tradingcommunities
conducted in partnership – with localorganizations such as NGOs and government,and with donors
sustainable – people should be able to dealwith, and respond to, external shocks,hardships and trends, and not be (entirely)dependent on outside support: there are fourdifferent interrelated dimensions ofsustainability:
i) economic (e.g. supply and demand for fish)
ii) institutional (e.g. a well functioning fishmarketing chain, availability of credit and loan facilities)
iii) social (e.g. support from within the family and the community in general)
iv) environmental (e.g. fish stocks).
36
Appendix 2
What the approach emphasizes:
� a people-centred participatory and responsive approach to development� starting with positives (what people have) and opportunities (what they can make of it)� building on existing development approaches� micro- to macro-policy influencing
What the approach does not emphasize:
� starting with sectors or commodities� starting with needs and problems� replacement of existing development approaches (but sets them in broader context)� a focus only on local development
Box A2: Summary of Sustainable Livelihoods Approach’s principles
(2) Fish Marketing Append.qxd 8/8/03 5:59 pm Page 36
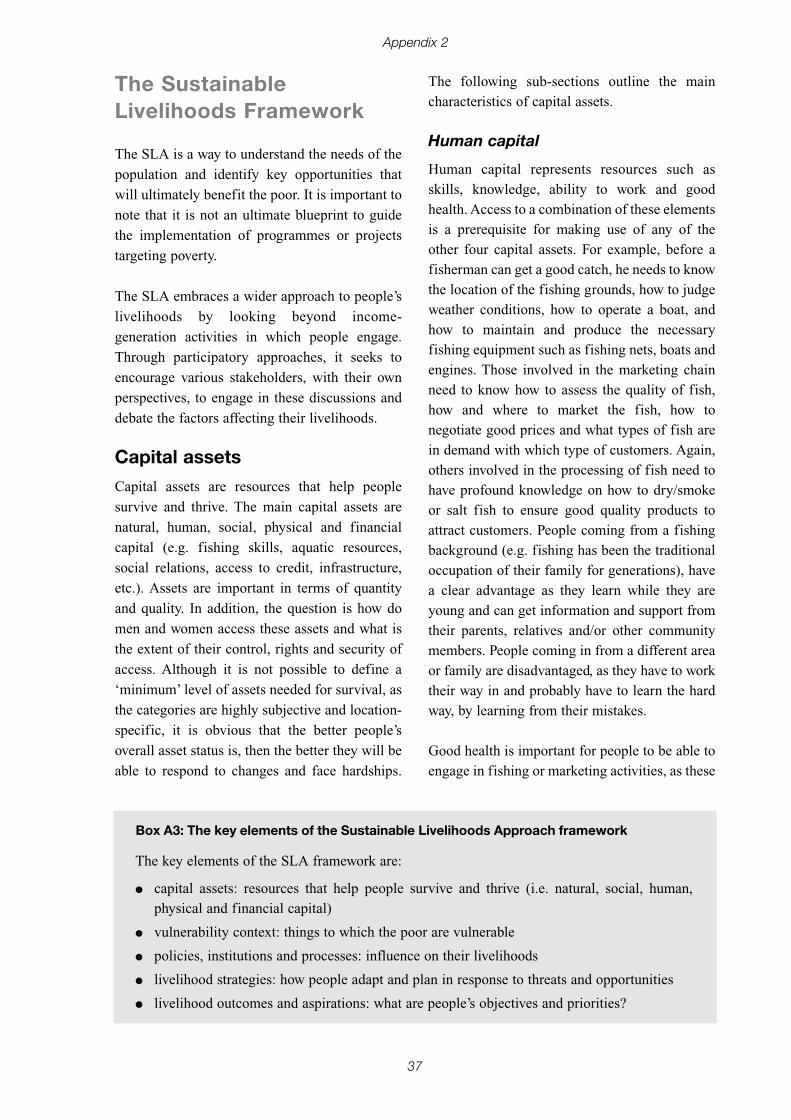
The SustainableLivelihoods Framework
The SLA is a way to understand the needs of the
population and identify key opportunities that
will ultimately benefit the poor. It is important to
note that it is not an ultimate blueprint to guide
the implementation of programmes or projects
targeting poverty.
The SLA embraces a wider approach to people’s
livelihoods by looking beyond income-
generation activities in which people engage.
Through participatory approaches, it seeks to
encourage various stakeholders, with their own
perspectives, to engage in these discussions and
debate the factors affecting their livelihoods.
Capital assets
Capital assets are resources that help people
survive and thrive. The main capital assets are
natural, human, social, physical and financial
capital (e.g. fishing skills, aquatic resources,
social relations, access to credit, infrastructure,
etc.). Assets are important in terms of quantity
and quality. In addition, the question is how do
men and women access these assets and what is
the extent of their control, rights and security of
access. Although it is not possible to define a
‘minimum’ level of assets needed for survival, as
the categories are highly subjective and location-
specific, it is obvious that the better people’s
overall asset status is, then the better they will be
able to respond to changes and face hardships.
The following sub-sections outline the main
characteristics of capital assets.
Human capital
Human capital represents resources such as
skills, knowledge, ability to work and good
health. Access to a combination of these elements
is a prerequisite for making use of any of the
other four capital assets. For example, before a
fisherman can get a good catch, he needs to know
the location of the fishing grounds, how to judge
weather conditions, how to operate a boat, and
how to maintain and produce the necessary
fishing equipment such as fishing nets, boats and
engines. Those involved in the marketing chain
need to know how to assess the quality of fish,
how and where to market the fish, how to
negotiate good prices and what types of fish are
in demand with which type of customers. Again,
others involved in the processing of fish need to
have profound knowledge on how to dry/smoke
or salt fish to ensure good quality products to
attract customers. People coming from a fishing
background (e.g. fishing has been the traditional
occupation of their family for generations), have
a clear advantage as they learn while they are
young and can get information and support from
their parents, relatives and/or other community
members. People coming in from a different area
or family are disadvantaged, as they have to work
their way in and probably have to learn the hard
way, by learning from their mistakes.
Good health is important for people to be able to
engage in fishing or marketing activities, as these
37
Appendix 2
The key elements of the SLA framework are:
� capital assets: resources that help people survive and thrive (i.e. natural, social, human,physical and financial capital)
� vulnerability context: things to which the poor are vulnerable
� policies, institutions and processes: influence on their livelihoods
� livelihood strategies: how people adapt and plan in response to threats and opportunities
� livelihood outcomes and aspirations: what are people’s objectives and priorities?
Box A3: The key elements of the Sustainable Livelihoods Approach framework
(2) Fish Marketing Append.qxd 8/8/03 5:59 pm Page 37

require physical fitness. Formal education mightnot necessarily be important for engaging infishing activities as such, but it is a positive assetas it increases one’s ability to engage inalternative income-generation activities ifneeded. This might be valuable in case theactivity is highly seasonal, or worse, catches aredeclining because of overfishing forcing peopleto look for alternative sources of employment.
Natural capital
Natural capital is the quality and quantity ofnatural resources that are available to people andabove all, the access and control people have overthese natural resources. Examples includeaquatic resources, water, land, forests, air qualityand biodiversity. These resources often form thebasis of most rural economies.
People living in coastal fishing communities, notonly depend on fish but on a combination ofnatural resources for their livelihoods. Fish iscaught for both household consumption and sale,generating a cash income. Waterways are alsoused for transport of persons and produce.Freshwater is used for human consumption and forpreserving fish (e.g. brine). Forests provide bothbuilding materials for housing and boats and alsofuelwood for cooking and smoking fish. In someareas, non-timber forest products can be importantas an alternative source of natural fibres (e.g.traditional net mending, fishing traps and baskets),edible fruits, leaves, fungi and medicinal herbs.Access to land can be important, especially iffishing is a seasonal activity, because agriculturalactivities can supplement the household foodrequirements. Land is also important forprocessing activities such as drying fish.
In general, it can be said that fish is the keyresource for survival. Unfortunately, there aremany examples where fish resources aredeclining, both in quantities and quality(diversity of species). In addition, coastal fishingcommunities often lack access to land and,therefore, they have limited opportunities forseeking alternative livelihood strategies. In
Bangladesh, fishers often belong to a Hinducaste, for example, the Jaladas. The Jaladas
usually do not have land and their traditionaloccupation is fishing. Increasingly, there is aninflux of people who have lost their land andperceive fishing as a kind of last resort (Alam,1996).
Social capital
People are dependent on social resources for theirlivelihood strategies. Social resources aredetermined by relationships and networks, whichexist within nuclear and extended families, and inand among communities and groups. Thesesocial relations influence the way in whichpeople can access and make use of their assets.
Social relations are often based on trust,reciprocity and exchange, and contribute to asense of well-being and belonging. Suchinformal social relations form the basis ofinformal safety nets, which people use to pursuetheir livelihood strategies in times of problemsand emergencies. To enter a fishing business, ayoung man might be taken on board by his fatheror other relatives and be given/loaned fishingnets. In order to ensure a good and regular supplyof fish, fish traders often rely on theirrelationships with fishers or other traders,sometimes based on kinship and/or mutual trust.Having a good relationship with a supplier opensup opportunities for obtaining fish on credit.Alternatively, newcomers to the fish tradingbusiness may need to be introduced to themarket, its suppliers and/or customers by fellowtraders. There are also examples where fishers,fish processors and traders share resources.Fishers who share boats, engines and eventuallyfishing nets are often brothers or father and sons.Fish processors might share the use ofsmoking/drying equipment and rent transport ona joint basis to reduce costs and waiting time.
The type and relevance of social capital can differconsiderably among ethnic groups, gender andage. A woman can have limited opportunities forentering particular income-generating activities.
38
Appendix 2
(2) Fish Marketing Append.qxd 8/8/03 5:59 pm Page 38

In some societies, women are not allowed toengage in activities outdoors but are confined tothe domestic sphere, thereby increasing theirdependence on their husbands or male relatives.Marital status can also influence one’s choice ofopportunities for potential livelihood strategies. Amarried woman often enjoys greater security thana widowed or divorced woman. For example, inHindu fishing communities, the female-headedhouseholds (often widowed) often enter the fishprocessing and trading business as a survivalstrategy, whereas married women are more likelyto be supported by their fishing husbands.
Another important aspect of social capital isethnicity and/or religion. The caste system,which is characteristic of the Hindu religion, isprevalent in many coastal fishing communities inBangladesh. Traditionally, castes are specializedin particular professions, which can be seeneither as protective towards an individual’slivelihood strategy as it hinders outsiders fromentering, for example, the fishing profession.However, it can also be seen as a constraint as itlimits people’s opportunities for seekingalternative employment strategies outside theirtraditional occupation (Alam, 1996; Blowfieldand Haque, 1995). However, there seems to be agrowing tendency towards overcoming confinedtraditional caste boundaries and outsidersentering new occupations, for example, landlessMuslim families, originally farmers, becominginvolved in fishing-related activities (Campbell,2000; Alam, 1996).
From previous examples, it is clear that there arealso negative aspects of social relations, such asexclusivity, hierarchy, obligations andenforcement of power that can affect anindividual’s access to social capital negatively.Belonging to a lower caste can marginalizeparticular groups, leaving them more vulnerable tothe more powerful castes and/or socio-economicgroups within the community or wider society.
Social capital can also manifest itself in moreformal ways through organized groups, such astrading or fishing associations, membership of
religious groups or groups initiated by externalfacilitators like NGOs focusing on communitydevelopment. If formally organized groups buildupon strong informal social relations, they canlay an important foundation for influencingpolicies beyond community levels, knowledgesharing, community-based managementinitiatives or improving individual access tofinancial services.
Financial capital
Financial capital refers to the financial resourceswhich are available to people (savings–liquid/illiquid, supplies of credit and regularremittances/pensions), and which provide themwith different livelihood options. It also includesilliquid resources that can be quickly convertedinto cash and more liquid means. In somesocieties, there is a preference for saving in kindas that is perceived as having a higher value orbeing less risky than cash. Examples arejewellery (gold) and cattle, which are oftendisposed of in emergencies such as illness,marriage or death.
Financial capital is the most versatile type ofasset as it can be used to acquire other types ofcapital such as:
� natural capital – access to land or purchase offish for trade/processing
� physical capital – access to fishingequipment, modes of transport, house, etc.
� human capital – access to education and/orvocational training to support access toalternative sources of income.
Financial capital can also improve one’s socialcapital as a high socio-economic status oftencorrelates with having power and beingrespected/feared by others. For example, havinggood financial assets could enable a person togive loans/credits to those less endowed, therebycreating obligations for these dependants.Moneylenders are often feared/respected withinthe village because the poor depend on them forsurvival. Thus, the more wealthy people can usetheir higher level of social capital to their benefit,
39
Appendix 2
(2) Fish Marketing Append.qxd 8/8/03 5:59 pm Page 39

for example, access to free labour or political
power (vote buying).
Financial capital can also be used for supporting
livelihood outcomes directly as people can use
cash to buy food for meeting household
consumption requirements.
Credit, both informal and formal, is an integral
part of financial capital although, of course,
raising credit always corresponds to a
neutralizing debit. Informal credit, such as
assistance from financially better-off relatives
and friends, loans with local moneylenders or
credit in kind, especially important for traders,
can improve one’s ability to pursue livelihood
strategies. As fishing is a highly seasonal
income-generating activity, incomes for both
fishers and traders tend to be irregular and
season-based. Therefore, fisherfolk face
occasional shortages of cash to meet their
household requirements, particularly during the
lean season. Access to informal credit for both
production and consumption purposes can be an
important coping strategy as that allows people to
prepare, invest and work in their preferred
occupation. Formal credit institutions, such as
banks and NGOs, seem to stipulate requirements
that sometimes do not recognize and meet the
need and priorities of fishing communities, for
example, a regular income, ownership of
collateral, targeted at production purposes and
favourable to group membership.
Although, informal credit through local
middlemen is often seen as exploitative, it has the
advantage of being flexible (no discrimination
between consumption and production credit),
timely and easily accessible as it is locally
available with little bureaucratic hassle. In
addition, fishers are secured of buyers for their
daily catch without having to spend a lot of time
trying to sell to several smaller buyers. Alam
(1996) mentions that moneylenders also provide
an element of social security by protecting the
often socially marginalized groups against
violence from other more powerful groups, (e.g.
due to religious or trade rivalries).
However, it is often perceived as exploitative as
fishermen are obliged to sell the major share of
their daily catch to the moneylender below the
market price, therefore, it is almost impossible to
get out of the vicious circle of indebtedness. This
also hinders other groups such as traders and fish
processors who wish to enter the market as fish
supply might be limited at times and they have to
compete against large-scale operators (Campbell,
2000; Blowfield and Haque, 1995).
Physical capital
Physical capital is the basic infrastructure such as
transport, shelter, sanitation, water, energy and
communications, and the production equipment
and means which enable people to pursue their
livelihoods. It includes public goods such as
health care, education and infrastructure, like
roads, for which people often do not have to pay
directly or partly contribute (e.g. payment of
school or hospital fees). Having good access to
infrastructure can be especially important for
traders as it increases their potential marketing
area. Access to health services, safe water supply
and sanitation will make a positive contribution
to people’s health, thereby increasing people’s
human capital and ability to work.
Also private goods, such as fishing gear, boats,
engines, fishing nets, fish processing equipment
(ice boxes, smoking ovens, drying racks/slabs)
and modes of transport are crucial to support
livelihood strategies. Not all fishermen have their
own fishing gear, and they might depend on
borrowing or using others’ equipment in return
for payment of rent or lower cash returns for their
catch. Having a lot of physical capital does not
necessarily mean that someone is better-off. For
example, a fisherman owning a motorized boat
might be heavily indebted because of outstanding
loans, and he might actually have a lower return
on his investment than those who own nets but no
boats and, therefore, pay for the use of a boat.
Livelihood assets pentagon
A pentagon is sometimes used as a visual tool to
present information about people’s access to
40
Appendix 2
(2) Fish Marketing Append.qxd 8/8/03 5:59 pm Page 40

assets and the interrelationships. The differenttypes of assets are presented in the shape of apentagon. Access by different groups orhouseholds to each different type of asset can beplotted in a schematic way along the five axisgraph (see Boxes A4 and A5 below). Asdiscussed earlier, access can imply anything fromindividual ownership of private goods tocustomary rights for groups. Values or length ofaxis are not quantified, as values for each assetbase are highly subjective, because they arelocation- and context-specific. It is used as astarting point for thinking about how and in whatcombinations, assets translate into sustainablelivelihoods. It can also provide an analytical toolfor tracking changes in people’s asset base overtime and/or drawing comparisons betweengeographic areas.
Further, it highlights the interrelationshipsbetween the different capital assets and the extentto which they are interchangeable. For example,natural capital may be the basis for financialcapital (land as collateral that can be used toobtain a loan). Or natural capital might be linkedto social capital. In many societies, investment ina large number of livestock is associated withsocial prestige and provides a basis for kinshipsupport. Financial capital correlates often with
socio-economic status and the ability to developdependency relations, creating both obligationsand benefits, thereby increasing the individualpower base and decision-making power.Financial capital can be converted into physicalcapital through purchase of fishing nets and fishprocessing equipment, etc. Access to physicalassets again links to human capital, such as beingable to invest in human health and education,increasing a person’s ability to seek alternativeemployment opportunities.
A simplified example is presented in Box A5,and illustrates how a fisherman’s balance ofassets can change over time as a result ofdeclining catches.
Natural capital is reduced due to a decline in fishresources causing reduced catches per unit andreduced supply of fish to the markets. Due to anincrease in pressure on nearby forest resources,access to firewood has become scarce and,therefore, less available for household use andfish processing. Human capital has remainedrather consistent as the person is still physicallyfit and has all the knowledge and skills neededfor fishing. Financial capital has decreased,because incomes from fishing have gone downdue to the decline in catches, even though the
41
Appendix 2
Box A4: Livelihoods assets pentagon
Social capital
Natural capital
Physical capital
Human capitalFinancial capital
(2) Fish Marketing Append.qxd 8/8/03 5:59 pm Page 41

prices may have increased. Therefore, the person
depends more on informal loans to meet
household needs, thereby reducing his social
capital, as he has become more dependent on
other people for assistance, rather than being able
to assist others in return for favours beneficial for
him. His physical assets have declined as his
fishing nets were damaged in the previous
fishing season and he does not have sufficient
cash to replace them with good quality ones.
Instead he relies on mending his old nets, which
become even more prone to damage, thereby
reducing the volume of fish caught and
increasing the time spent repairing the nets after
coming back from sea.
The above example gives an idea of the changes
over time and how the asset status is affected. Has
it improved or decreased? What changes in asset
status can be predicted given the current changes
and the impact on the asset status as identified in
the above case? What are the main causes of
change and how does it vary for the different social
groups (e.g. in terms of socio-economic status,
gender, age and ethnicity)? Such an analysis of
causes of change can help in identifying the factors
that enable people to move out of poverty, and
develop an understanding about the combination
and sequencing of assets and livelihood strategies
which allow them to do so.
VulnerabilityNext to an understanding of people’s strengths
and access to assets, it is important to understand
the vulnerability context in which these assets
exist. What are the external factors that influence
the levels of assets and how these assets can be
used? These external factors are often related to
the causes of poverty, which make poor people,
in particular, vulnerable. For many poor rural
people, changes in natural capital can particularly
affect their vulnerability, as they are heavily
dependent on natural resources. Three major
types of external factors can be recognized:
trends, shocks and seasonality.
Trends
There is a major long-term negative trend in
relation to the quantity and quality of natural
resources. Over the past decades, fish resources
have declined and particular species have
become extinct or prone to extinction. The loss in
biodiversity may have negative drawbacks on the
remaining resources as the marine ecosystem has
been disturbed. The underlying causes for the
increased pressure on natural resources are rather
complex, but two important ones are rapid
population growth and urbanization. A few
examples of interrelated sub-trends are:
42
Appendix 2
Box A5: Example of how changes in assets can be analysed and presented
Social capital
Natural capital
Physical capital
Human capitalFinancial capital
(2) Fish Marketing Append.qxd 8/8/03 6:00 pm Page 42

� pollution of water resources, for example,
industry, mining, urban development,
agriculture and aquaculture (use of pesticides
and fertilizers)
� habitat destruction through aggressive fishing
methods and clearing of natural vegetation
such as mangroves, land loss through
inappropriate watershed management
� growth of export market: increased demand
for high value fish has resulted in extractive
fishing methods and a greater uptake of
mechanized fishing technologies, thereby
adding pressure on natural resources. It also
pushes out the already marginalized, poor
fisherfolk, who are not able to invest in
capital-intensive fishing technologies.
Other institutional-related trends include
liberalization of trade, introduction or lifting of
trade bans, and change in consumer preferences.
For example, the demand for fresh fish has
increased significantly, stimulating the use of
preservation technologies such as the
introduction of ice. This may have a negative
impact on the livelihoods of small-scale fish
processors who rely on traditional low cost
preservation technologies, such as sundrying,
salting and smoking.
Shocks
Shocks are unpredictable events affecting
livelihoods such as war, natural disasters such as
floods, droughts, cyclones, earthquakes,
landslides, disease epidemics and sudden
economic changes (e.g. currency devaluation). In
the fishery context, cyclones and floods have a
devastating effect on people’s lives and
properties. Many lives are lost (loss in human
capital), and physical infrastructure and assets
are wiped out, such as loss of fishing gear, roads,
bridges and transport linkages being washed
away, thereby again limiting access to health and
education services and employment
opportunities in other sectors. A decline in the
availability of natural resources and loss of
biodiversity makes events such as cyclones and
floods unpredictable, more common and worst of
all, the effects on people’s livelihoods have
become more severe. Loss in biodiversity has
negatively affected nature’s ability to resist
natural disasters. Due to deforestation of
mangrove forests, the natural protection against
floods has become minimal. In addition, the loss
of biodiversity reduces people’s ability to cope
with disasters as building materials become
scarce and income from fishing declines,
therefore limiting people’s capacities to build up
a buffer zone against such calamities.
Seasonality
Seasonality includes recurrent changes
throughout the year that influence people’s access
to assets and livelihood outcomes. Seasonal
change in weather is such an example. The major
fishing season may occur during the rainy
season, thereby limiting cash income to a few
months a year, imposing a strain on the
household cash flow and food security during the
lean season. Because most of the fish may be
caught during the rainy season, there is a greater
risk for those involved in fish processing due to
higher humidity and higher prevalence of insect
attack on the processed fish. Also transport of
fresh fish might be more unreliable in the rainy
season as roads may become flooded. Other
aspects of seasonality include changes in prices,
marketing opportunities, health (e.g. higher risk of
malaria during the rainy season) and availability of
alternative employment opportunities.
In sum, if people are unable to deal with these
trends, shocks and/or seasonal changes, they will
become increasingly vulnerable. It is important
to keep in mind that the vulnerability context can
differ among the different social groups as the
levels of vulnerability are related to their
individual combination of assets available and
accessible to them. The vulnerability context can
be best explored through an examination of
perceived risk factors, key problems, changes,
potential solutions and the coping strategies that
people have developed. Policy interventions may
43
Appendix 2
(2) Fish Marketing Append.qxd 8/8/03 6:00 pm Page 43
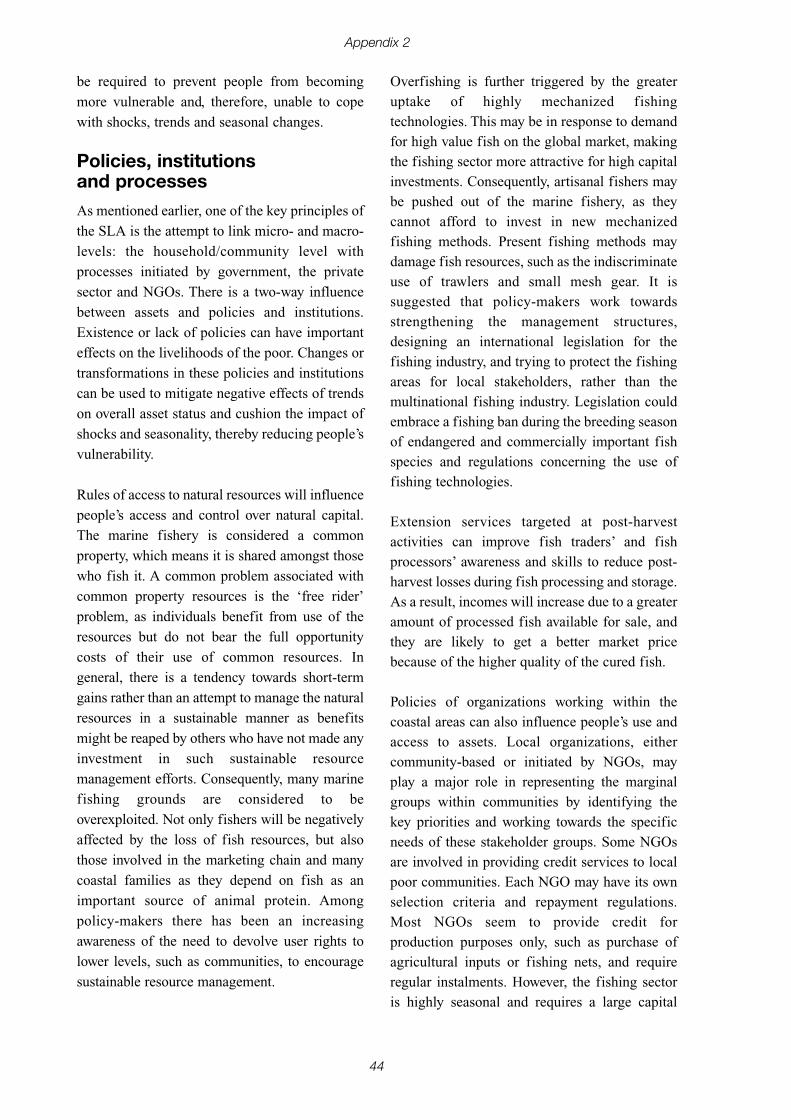
be required to prevent people from becoming
more vulnerable and, therefore, unable to cope
with shocks, trends and seasonal changes.
Policies, institutions and processes
As mentioned earlier, one of the key principles of
the SLA is the attempt to link micro- and macro-
levels: the household/community level with
processes initiated by government, the private
sector and NGOs. There is a two-way influence
between assets and policies and institutions.
Existence or lack of policies can have important
effects on the livelihoods of the poor. Changes or
transformations in these policies and institutions
can be used to mitigate negative effects of trends
on overall asset status and cushion the impact of
shocks and seasonality, thereby reducing people’s
vulnerability.
Rules of access to natural resources will influence
people’s access and control over natural capital.
The marine fishery is considered a common
property, which means it is shared amongst those
who fish it. A common problem associated with
common property resources is the ‘free rider’
problem, as individuals benefit from use of the
resources but do not bear the full opportunity
costs of their use of common resources. In
general, there is a tendency towards short-term
gains rather than an attempt to manage the natural
resources in a sustainable manner as benefits
might be reaped by others who have not made any
investment in such sustainable resource
management efforts. Consequently, many marine
fishing grounds are considered to be
overexploited. Not only fishers will be negatively
affected by the loss of fish resources, but also
those involved in the marketing chain and many
coastal families as they depend on fish as an
important source of animal protein. Among
policy-makers there has been an increasing
awareness of the need to devolve user rights to
lower levels, such as communities, to encourage
sustainable resource management.
Overfishing is further triggered by the greater
uptake of highly mechanized fishing
technologies. This may be in response to demand
for high value fish on the global market, making
the fishing sector more attractive for high capital
investments. Consequently, artisanal fishers may
be pushed out of the marine fishery, as they
cannot afford to invest in new mechanized
fishing methods. Present fishing methods may
damage fish resources, such as the indiscriminate
use of trawlers and small mesh gear. It is
suggested that policy-makers work towards
strengthening the management structures,
designing an international legislation for the
fishing industry, and trying to protect the fishing
areas for local stakeholders, rather than the
multinational fishing industry. Legislation could
embrace a fishing ban during the breeding season
of endangered and commercially important fish
species and regulations concerning the use of
fishing technologies.
Extension services targeted at post-harvest
activities can improve fish traders’ and fish
processors’ awareness and skills to reduce post-
harvest losses during fish processing and storage.
As a result, incomes will increase due to a greater
amount of processed fish available for sale, and
they are likely to get a better market price
because of the higher quality of the cured fish.
Policies of organizations working within the
coastal areas can also influence people’s use and
access to assets. Local organizations, either
community-based or initiated by NGOs, may
play a major role in representing the marginal
groups within communities by identifying the
key priorities and working towards the specific
needs of these stakeholder groups. Some NGOs
are involved in providing credit services to local
poor communities. Each NGO may have its own
selection criteria and repayment regulations.
Most NGOs seem to provide credit for
production purposes only, such as purchase of
agricultural inputs or fishing nets, and require
regular instalments. However, the fishing sector
is highly seasonal and requires a large capital
44
Appendix 2
(2) Fish Marketing Append.qxd 8/8/03 6:00 pm Page 44

input at the onset of the major fishing season.The amount of money needed might be morethan the maximum amount of credit. Further,fishers might not be able to meet the regularinstalments as their income is highly seasonaland subject to considerable fluctuation. Inaddition, most fishers need credit to coverhousehold consumption needs during the leanseason when their incomes are non-existent orinsufficient. Most financial service providersappear not to allow credit for consumptionpurposes, therefore excluding fisherfolk fromaccess to financial resources. Consequently,fisherfolk are dependent on informal loanarrangements with local moneylenders and/orlocal business men. This often means lowerincomes during the fishing season, as they areobliged to sell a major share of their catches tothe moneylender to repay the loan in ‘kind’. IfNGOs and/or financial service providers wereable to adjust their credit policies to suit thespecific requirements of the fisherfolk, then thefisherfolk might be able to free themselves froma vicious circle of indebtedness.
Given the context of such bond credit relationswithin the fish marketing chain, marketinformation might be distorted as market pricesare relatively fixed and set by moneylenders,which often do not reflect the real market value.This has a negative impact on other fish traderswho have to buy at a higher price, but are forcedto sell again at a relatively low price as they haveto compete with traders obtaining goods belowthe actual market price. In case they arecompeting for the same market, a marketconcentration will occur with moneylenderscontrolling bigger shares of the market.
The above examples mainly relate to the wayformalized institutions and policies areinfluenced by, and affect people’s asset status.However, informal processes such as culturalpractices, power relations and (traditional) beliefscan also play a significant role in the way inwhich assets are transformed into livelihoodoutcomes, for example, in a Hindu society, the
type of occupations is closely related to casteboundaries.
Livelihood strategiesLivelihood strategies are the range of outcomesdepending on how people combine and use theirassets to make a living given the factors thatmake them vulnerable and the policy andinstitutional context within which they live. Inthe past, development efforts often sought toimprove services and opportunities available tocategories of people, such as fisherfolk.However, the SLA seeks to develop anunderstanding of the factors behind people’schoice of livelihood strategy and to reinforce thepositive aspects and mitigate the constraints ornegative influences. In sum, the SLA seeks toidentify ways of building on the strengths thepeople have, while at the same time trying toreduce the level of vulnerability.
Inherent to its holistic principle, the SLArecognizes the importance and prevalence of adiversity of livelihood strategies that anindividual and/or household pursues. Poor peopleand their households have often diversified theirrange of livelihood strategies in order to reducetheir vulnerability and to be able to cope withuncertainties or lack of sufficient income fromone major income-generating activity.
Through a social stakeholder analysis, it iscrucial to identify the different socialgroups/communities as they might each havetheir own opportunities and constraints thatdetermine their livelihood strategies. Within thefish distribution and marketing chain, theremight be different groups of traders, eachinvolved in a particular part of the marketingchain given their ability to combine the assetsavailable to them. For example, women, whohave little trading capital and are dependent on anirregular supply of fish, are mainly involved inbuying leftovers and low quality fish brought tothe landing sites, which they sell in the localneighbourhood. Others with a higher operationalcapital and better supply channels of higher value
45
Appendix 2
(2) Fish Marketing Append.qxd 8/8/03 6:00 pm Page 45

fish might sell at regional markets or in nearbyurban markets.
Poor people’s livelihood strategies may be moreor less based on natural resources. Access tonatural resources become increasingly limited,especially because of urbanization, and peoplehave to seek alternative non-natural resource-based livelihoods. It is obvious that the range oflivelihood choices is more restricted for the asset‘poor’ than for those who have good access to allsources of capital. The fact that many fisherfolkare tied up in informal loans, which they need torepay, reduces their opportunities to move toalternative preferred livelihood strategies.Further, the prevailing culture, gender and casterestrictions can reduce people’s choices ofpotential income-generation activities. In order todevelop an understanding of why particularlivelihood strategies might be followed andothers not, it is useful to examine the constraintsthe poor people face in achieving local livelihoodobjectives.
Livelihood outcomesPeople often aim for a range of preferredoutcomes based on their perceived priorities andobjectives, for example, income, well-being,food security, sustainable use of naturalresources, reduced vulnerability and decision-making power. Through participatory povertyassessments, it is possible to develop anunderstanding of local perceptions anddefinitions of poverty, and what peoplethemselves see as pathways out of or intopoverty. Individual livelihood strategies mightdeal with different dimensions of poverty andaim for different outcomes. In the case offisherfolk, access to consumption credit is animportant mechanism to ensure food security andthe ability to go fishing when the main seasonstarts. In addition to exploring people’slivelihood goals and preferred outcomes, it isalso worthwhile getting an insight into the waypeople rank the outcomes of their livelihoodstrategies. Some fisherfolk, tied to localmoneylenders through outstanding loans, might
perceive it as exploitation and as a factorpreventing them moving out of poverty as theycannot invest in alternative income-generatingactivities. Others might value the social securityprovided by the more powerful group within theircommunity and accept the fact that they arelimited in developing alternative livelihoodstrategies.
Further, social groups and/or individuals mightvalue the trade-offs between immediatelivelihood gains and longer-term lossesdifferently, depending on the range of choicesthey have. Large-scale fishers might not beconcerned by the decline in fish resources as theywill have sufficient resources to invest in otherlivelihood strategies if required. However,artisanal fishers might have a stronger incentiveto work towards sustainable management offishery resources, as they are limited in taking upalternative livelihood strategies due to lack ofaccess to assets and their vulnerability.
ConclusionThe focus of this section has been to summarizeand explain the core elements of the SLA withspecific references to the coastal fishingcommunities and their role in the fishdistribution and marketing chain. The SLAframework can be a useful tool for analysing andunderstanding the broader context andsustainability of the livelihoods of people incoastal fishing communities. Only if an in-depthknowledge is generated of the complexity anddynamics of poor people’s livelihoods in coastalfishing communities, can recommendations bemade to strengthen people’s livelihoodopportunities, specifically focusing on improvingaccess to markets and credit.
A wide range of tools can be used for datacollection to support an analysis based on theSLA. It is suggested that a combination ofparticipatory, qualitative and quantitative tools beused, such as:
46
Appendix 2
(2) Fish Marketing Append.qxd 8/8/03 6:00 pm Page 46

� participatory methods borrowed fromparticipatory rural appraisals (PRA)
� sample surveys including structured andsemi-structured questionnaires
� institutional appraisal, including formal andinformal access to credit
� identification and analysis of fish distributionchannels
� market analysis and risk assessment
� social analysis
� gender analysis
� stakeholder analysis and conflict assessment
� participatory poverty assessment techniques
� case studies.
47
Appendix 2
(2) Fish Marketing Append.qxd 8/8/03 6:00 pm Page 47

Fig
ure
A1:
SLA
fra
mew
ork
H
N
FP
S
Liv
elih
ood
Ass
ets
IN ORDER TO ACHIEVE
Vul
nera
bilit
yC
onte
xt
•S
hock
s
•T
rend
s
•S
easo
nali
ty
Liv
elih
ood
Out
com
es
•M
ore
inco
me
•In
crea
sed
wel
l-be
ing
•R
educ
ed v
ulne
rabi
lity
•Im
prov
ed f
ood
secu
rity
•M
ore
sust
aina
ble
use
of N
R b
ase
Tra
nsfo
rmin
gSt
ruct
ures
and
Pro
cess
es
Stru
ctur
es
•L
evel
s of
go
vern
men
t
•P
riva
te
sect
or
• L
aws
• Po
lici
es
• C
ultu
re
• In
stit
utio
ns
Pro
cess
es
Liv
elih
ood
Stra
tegi
esIn
flue
nce
and
acce
ss
Sou
rce:
DF
ID
48
Key
H =
Hum
an C
apit
al
N =
Nat
ural
Cap
ital
F =
Fin
anci
al C
apit
al
S =
Soc
ial
Cap
ital
P =
Phy
sica
l C
apit
al
(2) Fish Marketing Append.qxd 8/8/03 6:00 pm Page 48
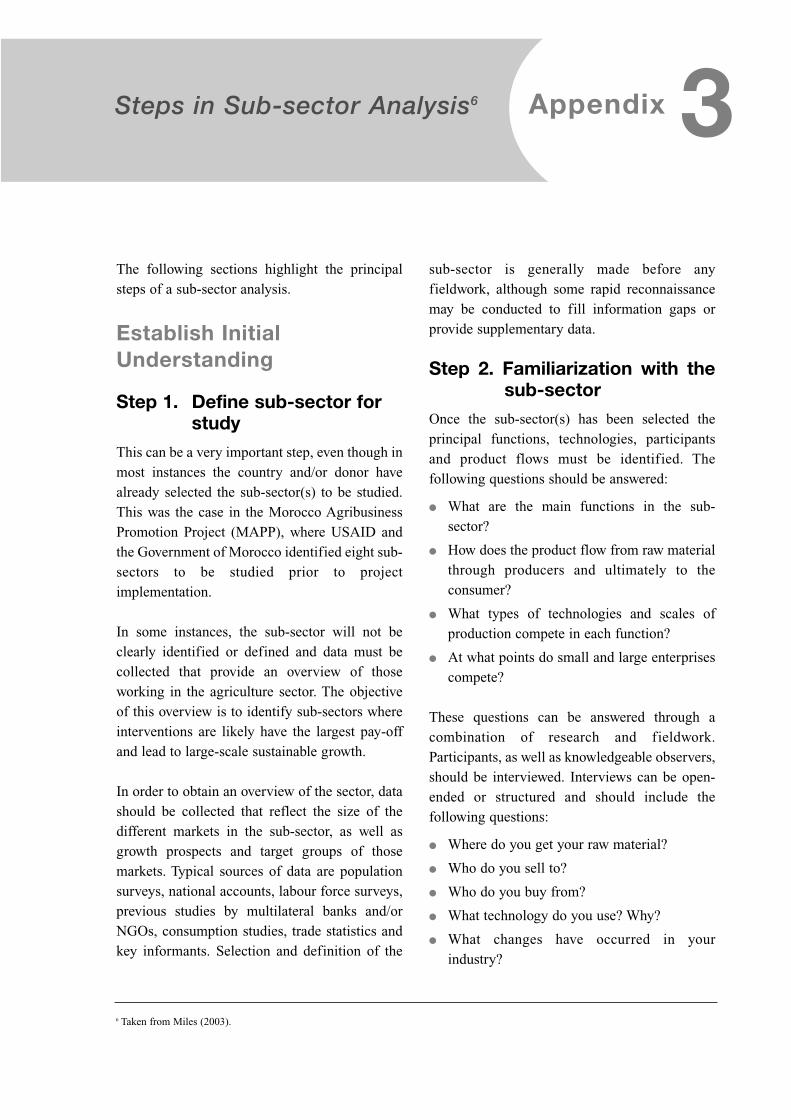
The following sections highlight the principalsteps of a sub-sector analysis.
Establish InitialUnderstanding
Step 1. Define sub-sector for study
This can be a very important step, even though inmost instances the country and/or donor havealready selected the sub-sector(s) to be studied.This was the case in the Morocco AgribusinessPromotion Project (MAPP), where USAID andthe Government of Morocco identified eight sub-sectors to be studied prior to projectimplementation.
In some instances, the sub-sector will not beclearly identified or defined and data must becollected that provide an overview of thoseworking in the agriculture sector. The objectiveof this overview is to identify sub-sectors whereinterventions are likely have the largest pay-offand lead to large-scale sustainable growth.
In order to obtain an overview of the sector, datashould be collected that reflect the size of thedifferent markets in the sub-sector, as well asgrowth prospects and target groups of thosemarkets. Typical sources of data are populationsurveys, national accounts, labour force surveys,previous studies by multilateral banks and/orNGOs, consumption studies, trade statistics andkey informants. Selection and definition of the
sub-sector is generally made before anyfieldwork, although some rapid reconnaissancemay be conducted to fill information gaps orprovide supplementary data.
Step 2. Familiarization with thesub-sector
Once the sub-sector(s) has been selected theprincipal functions, technologies, participantsand product flows must be identified. Thefollowing questions should be answered:
� What are the main functions in the sub-sector?
� How does the product flow from raw materialthrough producers and ultimately to theconsumer?
� What types of technologies and scales ofproduction compete in each function?
� At what points do small and large enterprisescompete?
These questions can be answered through acombination of research and fieldwork.Participants, as well as knowledgeable observers,should be interviewed. Interviews can be open-ended or structured and should include thefollowing questions:
� Where do you get your raw material?
� Who do you sell to?
� Who do you buy from?
� What technology do you use? Why?
� What changes have occurred in yourindustry?
Steps in Sub-sector Analysis6 13Appendix
6 Taken from Miles (2003).
(2) Fish Marketing Append.qxd 8/8/03 6:00 pm Page 49

In addition, questions about prices, profits andreturns can be asked. In Morocco, importantinformation was obtained about the olive sub-sector by interviewing local participants, Spanishand French processors, the World Olive Councilin Madrid and British and German brokers.
It may be useful here to roughly sketch a diagramof the sub-sector. First, it can be a useful tool forgetting information. Many people may not bewilling to give personal information, however,most will be more than willing to tell you whereyou are making incorrect assumptions. Secondly,it will provide a foundation for the preliminarysub-sector map.
Step 3. Draw preliminary sub-sector map
The map offers a useful overview by clearlyillustrating the operational framework of the sub-sector. The information obtained during theresearch and interviews are diagrammed and thedesired result is a graphic summary of theprincipal sub-sector functions, participants andchannels. The map should illustrate the analyst’sinitial understanding of the sub-sector and serve asa guide through the next steps of the assessment.
The functions are listed down the left side, thefinal markets across the top, and the participantsand alternative technologies for each function aredrawn in according to the functions they perform.Arrows illustrate the product flows among theparticipants and three principal channels andenterprise boundaries are clearly defined.
Step 4. Specify environmentOnce the sub-sector map has been diagrammed,the environment in which it exists and operatesmust be investigated. The environment consistsof the formal and informal rules that affect thesub-sector, as well as the organizations thatsupport them. Rules include labour regulations,trade policies, other macro-economic issues, and
socio-cultural factors. Support organizationsinclude trade associations, export agencies,ministries, chambers of commerce and NGOs.An improved understanding of how theenvironment affects the dynamics andcompetitiveness of the sub-sector can be obtainedthrough dialogue with sub-sector participants andsupport organizations, as well as through thestudy of the formal and informal rules.
All interviews and research in this step shouldseek to answer one question: How does theenvironment affect the different channels in thesub-sector? For example, MAPP’s 1993 olivesub-sector study found that Moroccan olive oilprocessors mixed extra virgin and virgin olive oilwith acidic ‘lampante’ oil. Because of stronglocal market prices and a preference for higheracidity, the extra virgin and virgin olive oil wasblended with the more-acidic lampante oil toextend lampante volume. Extra virgin and virginolive oils were exported only in the years whenthere was a bumper crop. It was suggested that,rather than extend local lampante supplies bymixing with lower acidity oil, Morocco couldimport the less expensive grades of olive oil fromcountries such as Tunisia, freeing extra virgin andvirgin olive oils for export on an annual basis. Atthe time, the Moroccan import policy keptforeign olive oil out of the market. Project staffdetermined that if the government let in foreignoil, Moroccan consumers could benefit fromlower olive oil prices, and Moroccan producerscould become regular suppliers to theinternational virgin olive oil market.7 In 1995, thelaw was changed, granting licenses for theimportation of lampante oil and eventuallyenabling the increased export of higher qualityoil, thereby benefiting both domestic consumersand exporters.
50
Appendix 3
7 Exporting The Right Stuff. Agribusiness Marketing Investment/Development Alternatives Inc. Marketing Materials.
(2) Fish Marketing Append.qxd 8/8/03 6:00 pm Page 50

Refine your Understanding
Step 5. Refine sub-sector map
The objective here is to refine and simplify the
map, by making appropriate changes and
integrating the details obtained from step 4. If
necessary, additional interviews can be carried
out where there are unclear or insufficient data.
This second round of mapping interviews should
be conducted in concert with step 6; in addition
to seeking clarifications and filling information
gaps, a more concentrated effort should be made
to collect reliable quantitative data.
The channels and sub-sector participants in the
Moroccan strawberry sub-sector are clearly
identified. Channel one shows large vertically
integrated Northern growers that sell fresh and
frozen berries. These growers have a minimum of
30 ha, producing 40–50 t/ha. About 50% of
production is exported fresh, 25% is exported
frozen and the remainder is sold in local markets.
Channel two shows small growers, who produce
almost exclusively for the domestic fresh fruit
market. In channel three, large vertically
integrated growers sell mostly fresh berries for
export. While production in this channel is
similar to channel one, 50% is exported fresh and
30–40% sold locally with the remainder sold to
processors of jams and other products.
Step 6. Quantify ‘overlays’ of particular interest
As the map becomes more refined, it may be
necessary to add detailed information to illustrate
more clearly the dynamics of the sub-sector.
Quantitative, as well as qualitative, detail can be
added to the map through the use of overlays. An
overlay, as defined by Haggblade et al. is
information superimposed on to a basic sub-sector
map to describe differences among participants
and channels. The most common overlays used
relate to size, income and its distribution,
efficiency, leverage and target groups. When
assessing the strawberry sub-sector in Morocco, it
was decided that volume and values were the most
important overlays to include.
There is no clear-cut method for determining
which overlays to use. If information is important
to the study and it has not been clearly reflected
in the basic map, then it should be added as an
overlay. Once the relevant overlays are
determined, data must be collected in order to
quantify them. Quantification at times will be
approximate due to the accuracy of key
informant estimates and their uneasiness about
sharing this information. Data should be cross-
checked with government, shippers and trade
association sources to ensure consistency and
minimize errors.
Identify LeveragedInterventions
Step 7. Analyse dynamics
At this point in the process, it is necessary to
understand how the sub-sector is changing. The
first step in analysing the dynamics of the sub-
sector is to determine which channels are
growing and which are declining. Once the
growing and waning channels are identified, key
driving forces and constraints can be examined to
determine which are responsible for the growth
or decline. Key forces that affect change in the
sub-sector include: market demand,
technological change, profitability of different
niches, risk, barriers to entry, large firm
behaviour, input supply and policies. Finally, the
consequences of the growth or decline must be
determined. Identification and understanding of
the key forces driving change in the sub-sector
and the consequences of that change will often
reveal opportunities for growth.
In the strawberry sub-sector three key driving
forces were identified.
i) The plants for planting. About 80–90% of
strawberry plants were provided by Spain,
the remaining 10–15 million plants were
51
Appendix 3
(2) Fish Marketing Append.qxd 8/8/03 6:00 pm Page 51

provided by domestic growers. TheMoroccan strawberry industry was overlydependent on Spain. Shortage or poorquality plants from Spain could seriouslyimpair the industry. A clear opportunityexisted for Moroccan growers to expandtheir sales of strawberry plants.
ii) Transport. Truck size was clearly a majorforce in the sub-sector. It took at least 30 haof production to fill a refrigerated truck.Opportunities will be available for increasedtransport access to small farmers, if thetransport system is modified to includesmaller trucks.
iii) The markets. Higher prices are available forproducts that are ready earlier in the season.In Morocco, opportunities still exist for evenearlier harvests by using improvedtechnologies and strawberry varieties.
Step 8. Identify sources of leverage
Leverage is the ability to affect large numbers ofsub-sector participants with a single, preferablylow-cost, action. Points of leverage can beidentified through system nodes, geographicconcentration and policy constraints. Systemnodes are points where large amounts of theproduct pass through the hands of a small numberof sub-sector participants. In the strawberry sub-sector, a clear system node existed between theproduction of strawberry plants and strawberryproduction. Increased domestic seedlingproduction would assist Morocco to producehigher quality berries. A useful overlay used torepresent system nodes is the ‘gearing ratio’,which illustrates the average number ofparticipants in one function purchasing inputsfrom the function below it. Geographicconcentration offers the opportunity for targetedinterventions that reach many participants in thesame region. Finally, policy constraints offer apowerful point of leverage. Policy reforms canhave a large impact, although they can be difficultand time consuming to achieve.
Step 9. Explore opportunitiesfor leveragedintervention
The objective of this step is to determine whereopportunities for intervention (identified in step7) and points of leverage (identified in step 8)converge. The following question should beanswered: Which opportunities offer the bestchance of reaching the largest number ofparticipants within the sub-sector? Afterperforming the assessment it may be determinedthat such opportunities do not exist; if so, effortsshould be focused elsewhere. However, ifopportunities for leveraged intervention do exist,they constitute the skeleton of the project design.
In the Moroccan strawberry sub-sector, plantseedling production was identified as anopportunity and the fact that most of the plantswere provided by Spain was determined to be asource of leverage. The first step taken toleverage this opportunity was a Moroccanstrawberry industry tour to the United States in1995. A direct result of this trip was a jointventure between a Californian firm and aMoroccan company that created a high-altitudestrawberry plant nursery for certified plantproduction. One million plants were shipped toMorocco and in the 1995/96 season they out-produced the Spanish plants at a lower cost.
Sample Sub-sector Report Outline
Executive SummaryIntroductionDynamics in the Sub-sectorOpportunities and ConstraintsRecommendations for Project Actions
I. Overview of Commodity ProductionII. Markets and Consumer DemandIII. Structure of the Sub-sector/Sub-sector MapIV. EnvironmentV. Driving Forces and Points of LeverageVI. Opportunities and ConstraintsVII Conclusions and Recommendations/
Opportunities for Intervention
52
Appendix 3
(2) Fish Marketing Append.qxd 8/8/03 6:00 pm Page 52

Positive and NegativeImpacts of Globalizationand International SeafoodLegislation on the FishingSector Participants8
The following two sections review some of thepositive and negative impacts that globalizationand international seafood legislation can have onfishing sector participants in developingcountries, with a particular focus on India. Notonly are the issues complex, but also the range ofexperiences between countries, regions,individuals and fish types is diverse. Forexample, major opportunities have been createdto increase incomes through export-led growthand the benefits of expanded international trade,as well as improved access to information, newideas, technologies and institutional designs.However, there has often been a downside interms of increased risks and greater economicand social instability at both the micro- andmacro-levels, which may result in increasedvulnerability of some stakeholders. These canhave a profound impact on the livelihoods ofsmall artisanal fishermen and processors, a largeproportion of whom are already very poor.
Positive impactsExpanded market opportunities
Globalization and liberalization offerparticipants in the fishing sector expandedmarket opportunities, but also require a more
India and Bangladesh
Project Case Study Material14Appendix
Overview of globalization issues
Summary of findings from the India project
Summary of findings from the Bangladeshproject
Commodity chain – Bangladesh
Seasonal diagram – Bangladesh
Calculation of costs and margins –Bangladesh
Positive and negative sides of dadan
(informal loans) in the fish marketingsystem
Examples of tables produced by theUniversity of Chittagong usingquestionnaire data
8 Taken from Oudwater et al. (2002).
(2) Fish Marketing Append.qxd 8/8/03 6:00 pm Page 53

commercial approach in pursuing marketopportunities. Market liberalization of the sectorpredominantly favours producers who havecompetitive advantages (i.e. natural resources,skills and capital) that allow them to compete inboth international and domestic markets.Alongside efficiency and redistribution effects,the change in price signals has led to longer-termchanges to physical and human capital formation.This is often difficult to quantify since the fullimpact and consequences of the changes occurover the long term (and are influenced by a rangeof additional factors). Some of the more readilyobservable consequences of market reformsinclude a direct impact on production, trade andfinance, particularly in export-orientated sectors.Frequently there is greater participation by privatesector organizations, greater producerresponsiveness to market needs – partly the resultof improved market efficiencies and an increasedproducer’s share of the fob price. We do not knowat present how producer prices for seafood havechanged in India as a result of market reforms andglobalization, but there are many examples ofexport-orientated producers (e.g. coffee, cocoaand cotton) throughout the developing world thathave substantially increased their share of the fobexport price, although on occasions the fob exportprice has fallen as a result of increased output.
Increased capital flows
A positive impact of globalization has been theincrease in international capital and technologyflows. Moreover, these flows, which are oftenassociated with direct foreign investments, are nolonger restricted to North-South flows, but areincreasingly taking place within and betweencountries in the developing world. However, thiscan be something of a two-edged sword,particularly for smaller producers, processorsand traders, since not only can they lead togrowing concentration, but also increasedvolatility and uncertainty. Hence there is the needfor adequate regulation and appropriateinvestment and technology codes to protect bothsmall-scale players and investors in the sectorsand countries concerned.
Improved transport andcommunication infrastructure
Improvements in international transport (sea, airand road links) bring small-scale producerscloser to the global market. Obviously, transportcosts will invariably face fluctuating fuel prices,but the trend in recent decades has been thatfreight capacities have increased continuouslyalongside technological improvements. Thisenables exporters to bring larger quantities ofbetter quality produce in a shorter time on toretailers’ shelves in industrialized countries.Those involved in the trade in fish and othercommodities are embracing the global revolutionin information technology. E-mail, internet andmobile phones are increasingly replacing the lessreliable and slower means of communicationsuch as mail, fax and printed trade literature.Although resource-poor fish producers andprocessors may not be able to directly benefitfrom new information technology, they are boundto benefit from the improved flow of knowledge.More efficient trading practices are beingadopted while research and extension serviceshave better access to internationally heldknowledge, information and databases.
Negative impactsIncreased market risk and pricevolatility
While globalization and liberalization may haveincreased market opportunities and smallproducers may receive a larger share of theexport price, they have also resulted in greatermarket risk and increased price uncertainty andvolatility. Small producers and variousintermediaries are much more vulnerable tomarket risks. The balance between increasedmarket opportunities and greater market risk willbe situation-specific and impossible to predict.The degree to which liberalization/globalizationhas affected price volatility is still being debated.Increased price uncertainty and volatility hascreated difficulties as regards production andprocessing decisions, as well as the ability topurchase inputs and to obtain credit. Price risk is
54
Appendix 4
(2) Fish Marketing Append.qxd 8/8/03 6:00 pm Page 54

only one of several risks faced by producers and
other market participants. There are production
risks, arising from seasonality of supplies,
ecological stability (i.e. current decline in fish
stocks worldwide) and diseases (i.e. shrimp
aquaculture), and the lack of liquidity with which
to buy fishing equipment and poor post-harvest
management. On the marketing side, there are
risks with regard to price, quality and quantity
caused by price volatility, demand variations, and
stringent sanitary and phytosanitary standards
(SPS) requirements imposed by major buyers,
particularly the EU, USA and Japan. Markets are
becoming more resilient to price volatility in part
because of the faster response to production and
demand shocks. Nevertheless, volatility does
create difficulties for producers and processors as
regards production and processing decisions, the
ability to purchase inputs and to obtain credit. It
requires a high degree of flexibility and
adaptability, thus those not able to adapt may lose
out and be adversely affected. However, many
small producers and processors are unaware of the
wider nature of globalization and liberalization
processes that are underway. Their perceptions are
limited to the more immediate impact in terms of
greater price uncertainty and volatility, and
changes in demand and quality requirements. The
impact of these changes depends on the extent to
which small producers are capable of reacting to
the new challenges they face.
Increased competitiveness
Competitiveness has invariably increased for
producers selling to both international and
domestic markets. Small-scale producers that
lack comparative advantages are coming under
increasing pressure in export markets from other
regions that are better endowed with production
factors. Policy changes and the reduction of
international transport costs are contributing to
this. At this stage, there is little information on
the extent to which Indian fish producers are
facing growing competitive pressures from local
producers within India or from other producers
both in Asia and elsewhere. Current SPS, as
imposed by the EU, USA, Japan, the main
importers of shrimp, have a significant impact onthe competitiveness of producers as to who isable to invest in hygienic processing proceduresto comply with these requirements.
Concentration and polarization
In line with increased competitiveness, there is ashift from small-scale production to larger-scaleoperations. For compliance with current SPS,companies need to invest considerable sums inupgrading fishing equipment, and processing andmarketing facilities to ensure current and futureexport markets. Consequently, the scale offishing has become more capital intensive, forexample, large trawlers suitable for deep-seafishing, specialized fishing gear and on boardpreservation facilities. Local small-scaleprocessing plants in rural areas have closeddown, and processing for export markets (i.e.peeling and deheading of shrimps) isincreasingly done in large-scale, centralizedprocessing plants. Polarization has intensifiedboth within communities (as some producers aremore successful than others) and within regionsand countries. Globalization is likely toaccentuate this polarization between thoseincluded in the process and those excluded.
Stringent quality requirements
In addition to export quality control, anincreasing proportion of the costs associated withmaintaining quality (e.g. drying, grading,sorting, packaging) have had to be borne by theexport trade. The development of the exportmarket seems to have produced a two-tier qualityassurance system. The demands of importingcountries have required massive efforts toimplement quality and food safety systems thatmeet these needs. The domestic markets aregenerally less stringent and investments inquality systems for these markets have beenreduced or have stagnated. The identification ofstrategies and options to improve and maintainhigher quality products to ensure marketabilityand the best available prices is an important issueresulting from liberalization.
55
Appendix 4
(2) Fish Marketing Append.qxd 8/8/03 6:00 pm Page 55

Access to finance as a production constraint
Access to finance has become more important ashigh levels of investment are required to respondto international market demands includingquality control. In developing economies, fishproducers and processors, especially thoseoperating on a small scale, face a perennialproblem in gaining access to credit, due to thenature of their requirements, seasonality of theactivity, high risks involved, and their lack ofmeaningful collateral acceptable to financialinstitutions. The lack of alternative employmentand income opportunities for many smallproducers and processors further intensifiesthese problems. Fishers usually need a large loanbefore the start of the main fishing season toenable investments in fishing equipment, etc.,and consumption credit to cover operation costs(i.e. crew salaries, maintenance, ice, fuel, etc.).Similarly for post-production, credit is needed toease cash flow constraints, assist in the timing ofsales and generally accelerate development. Asmentioned earlier, the introduction andimplementation of quality control systems tomeet SPS require large investments. Banks andother credit lending institutions are oftenunwilling to provide loans to the small-scalefishing industry because of lack of collateral,high transaction costs, the relatively largeamounts involved, high perceived risk and thehighly seasonal nature of the fishing industry. Itis not clear whether the provision of affordablecredit to producers and processors is an issue ofmajor importance to the maintenance oflivelihoods, income generation and the futuredevelopment of the fisheries sector in India.There have been studies to quantify thecomparative profitability of mechanized andnon-mechanized fishing units. Findings suggestthat artisanal fishing units were relatively moreefficient due to lower investment requirements(Sathiadas, 1997; Salagrama, 2001).
With greater price uncertainty, there is anincreased reluctance to advance loans. Withincreased competition in the marketing chain andgreater default risk, not only has the level of pre-finance to traders and producers often declined,but also foreign companies handle an increasingproportion of the market. The latter tend to havebetter access to finance as well as better marketcontacts and risk management techniques. Thiscan make it difficult for local enterprises tocompete.
Availability of physical andinstitutional infrastructure
In many countries Structural AdjustmentProgrammes of the World Bank/IMF have oftenled to deterioration in physical and institutionalinfrastructure as governments have reducedexpenditure in an effort to balance budgets.Market reforms have led to a considerableemphasis on creating an enabling environmentfor private sector development – particularly inthe export sector. In some cases the provision ofsome facilities (e.g. landing stages and cheapfinance/grants to companies to improve theirfacilities) has assisted the fishing sector.However, continued poor physical infrastructure(e.g. rural roads, port, airport andtelecommunication links, and cold storefacilities) have increased production andmarketing costs. This has been a seriousimpediment to seafood exports not only byreducing the availability of inputs and servicesbut also by making it more difficult to marketproduce, including the satisfying of importrequirements.
56
Appendix 4
(2) Fish Marketing Append.qxd 8/8/03 6:00 pm Page 56

Summary of SelectedFindings of the ProjectGlobalization and SeafoodTrade Legislation: TheEffect on Poverty in India9
The research highlights the importance that theexports of seafood from India and from the threestates studied in particular (i.e. Andhra Pradesh,Kerala and Orissa), play in earning foreignexchange and providing employment opportunities.The main products for export are shrimp andcephalopods from Kerala, mainly shrimp fromOrissa and almost entirely shrimp from AndhraPradesh. The states vary in their export destinationsbut the EU, Japan, USA and Asian countries areimportant. Because of the dominance of EUlegislation in framing Indian export regulations, itseems that even though many exporters do notexport to the EU, the way in which the EU developsfood safety legislation will affect most of those inthe export industry.
Andhra PradeshSince the early 1970s, there has been a rapidreorientation of fish production systems inAndhra Pradesh towards harvesting of exportablevarieties. Andhra Pradesh has taken the lead inproduction of shrimp from brackish wateraquaculture (for export markets) and carp fromfreshwater sources (for out of state markets suchas West Bengal). Capture fishing has undergonechanges to reflect the emphasis on exports:fishing systems that traditionally depended on amix of different species have begun toconcentrate on fewer varieties with good exportvalues. New fishing gear such as trammel netsand long lines facilitated the process, whiletrawlers continued to capture shrimp by usingnets with smaller mesh sizes.
While there have been efforts to diversify bychanging fishing grounds into deeper waters
through the introduction of deep-sea trawling, bytargeting alternative species such as tuna, byusing new fishing gear such as high-openingbottom trawls, these have largely remainedunsuccessful, and shrimp has continued to be thefocus of fishing and export operations.
Correspondingly, there has been a rapid growth inthe infrastructure to facilitate exports of seafood.Freezing plants, ice plants and cold storages havebeen installed in areas that haveproduction/processing/export facilities, rapidtransport became possible as a result of good roadslaid to connect most of the remote fishing villages,telecommunication systems facilitated efficientexchange of information between producers andbuyers, and all these changes have had an impacton the way fish are caught, processed and traded.
The composition of exports from VisakhapatnamPort reflects the general ‘low-volume-high-value’ trend of the east coast. The volume andvalue of exports from Visakhapatnam Port haveshown a consistently increasing trend throughoutthe 1990s. Japan is the most important importerof seafood from Visakhapatnam Port, its importsaccounting for 75% by volume and 86% by valueof the total exported from Visakhapatnam. TheUSA is the second largest importer of seafoodfrom Visakhapatnam Port, followed by China, anumber of South East Asian countries and theEU. Thus the impact of the EU ban on seafoodexports from Visakhapatnam was only minimal.
With respect to shrimp, the cultured varietieshave come to dominate exports constitutingnearly two-thirds of the quantity and 75% of thevalue of the total shrimp exports from the state.There has been a corresponding decrease inexports of captured shrimp in real as well aspercentage terms. There has been a steadyincrease in the quantity of finfish exportsthroughout the 1990s. There are indications thatthe finfish share of exports is continuing toincrease in overall state exports.
57
Appendix 4
9 Based on Ashok et al. (2003).
(2) Fish Marketing Append.qxd 8/8/03 6:00 pm Page 57

Increased exports have meant the establishmentof long chains of product flow and intricatenetworking between the various players involvedin the activities both directly and indirectly.Alongside the change in the market channels fordifferent seafood items, came a wide range ofnew players in the marketing systems.Commission agents, middlemen, carriers andtransporters, truck operators, peelers andprocessors, packers and handlers, exporters andprocessing plant operators, ice makers and icesellers, besides technicians, crate and basketmakers, etc., have all found a place forthemselves in the rapidly evolving export chains.One consequence of the existence of a largenumber of intermediaries is that the pricingmechanisms are influenced by them, oftendepriving the fishers of their rightful share.
There are no serious indications that increasingexports have taken away traditional livelihoodson a large scale. The increased emphasis onshrimp may have meant that many traditionalfishing operations that were facing problemscaused by poor catches of fish could manage toremain viable for a period.
Activities such as shrimp peeling by women,though practised are, however, confined toimportant port areas like Visakhapatnam,Kakinada, Machilipatnam and Nizampatnam,and where they have been closed over the lastdecade, it was for reasons other than changes inthe seafood trade legislation.
The poor in the export sector mostly fall into the‘invisible poor’ category, with little known abouttheir roles, numbers and the impact of anychanges on their livelihoods. Even the apparentlywell-off categories of poor are seen to fall intothe category of ‘potential poor’ or ‘tomorrow’spoor’. Unfortunately, there is little quantitative orqualitative information on the various categoriesof people working in the export sector,particularly in relation to the impact of changingexport trends, seasonality and shocks, such as aban on exports, on their livelihoods. Most ofthem are not recognized as being direct
stakeholders in the export sector, or even in thefishing sector in general and, being unorganized,current policy-making largely bypasses them.Consequently, their capacity to accessinstitutional support remains weak. There areindications that their vulnerability is increasingas a result of changing seafood legislation (whichemphasizes the need for more formalizedsystems of operation) and, more importantly,decreasing availability of shrimp from naturalsources.
The changed seafood legislation in late 1990s didnot have an apparent direct impact upon manypeople outside the processing and exportcategories, but there is evidence that there werelong-term, indirect, trickle-down effects at alllevels. Currently, the quality control systems donot extend beyond the processing plants, and theexisting conditions at the landing, handling andpre-processing areas leave much to be desired.Similarly, the use of potentially harmfulsubstances – such as antibiotics in theaquaculture sector – remain largely uncontrolled.
There are, however, indications that qualityconsciousness has been growing amongstdifferent stakeholder groups. Use of ice, betterhandling, packing and transportation systems areinstrumental in meeting the quality requirementsof the processing plants.
The government’s efforts to promote and sustainthe export sector are felt to be appropriate insome areas, but inadequate in others. That theseafood industry is variously covered under themandates of different central and stategovernment ministries makes things difficult toimplement. Most processing plants haveupgraded their production and processingsystems to meet international requirements. Thegovernment has extended support – technicalexpertise, technology and subsidies – to theprocessors in this respect.
It is possible that legislation will become morestringent and widespread in due course in whichcase the impact upon the various stakeholders
58
Appendix 4
(2) Fish Marketing Append.qxd 8/8/03 6:00 pm Page 58

would be serious. Coupled with the problem of
declining productivity in both the capture and
culture systems, which is offset to a large extent
by increases in the value of exports, the
application of more stringent quality parameters
would have serious consequences for the
producer groups. It is possible that the production
and processing systems would become more
streamlined, and in the process, the seafood
export industry could become more concentrated
into fewer hands than before. The effect of such
changes on the poor would be serious, because it
is the informal nature of several of the systems,
i.e. production, pre-processing, etc., that provides
a livelihood for them.
It is suggested that a more people-friendly,
people-empowering programme be adopted to
ensure that the various stakeholders in the export
commodity chain play a more productive role in
improving the quality of the seafood exports
without adversely affecting their own interests. In
the short term, it is recommended that more
emphasis be placed on raising awareness about
quality amongst the different stakeholders, that
efforts be made to make the seafood legislation
less obscure and user-friendly and more
uniformly implemented in different countries,
and that options for diversifying the seafood
exports from the state be explored, in terms of
increasing the commodities exported, in order to
overcome the constraints to which sole emphasis
on shrimp could give rise.
OrissaThe study identified certain groups in the export
supply chain as poor, i.e. traditional fishermen
and their crew, crew in the mechanized sector,
head loaders and other labourers in the chain, and
unskilled workers in processing plants.
Although the contribution of the traditional
fishing sector to overall volumes of exports
appears small, the contribution of export species
to individual household incomes of fishermen is
far from insignificant. The most important export
species for traditional fishermen are pomfret, seer
fish and small shrimps followed by prawn.
Overall, there is low involvement in the export
supply chain by the traditional sector. The
mechanized sector on the other hand depends
almost exclusively on the export market of a
single species – prawn; other species are treated
as by-catch. Similarly, brackish water aquaculture
depends on a monoculture of black tiger prawn,
almost exclusively for the export market.
Labourers play a role in the processing of
seafood for exports and hence are affected by
changes in the industry, mainly in terms of wage
rates and working conditions.
International quality regulations have forced the
industry to undertake process improvements.
This has definitely improved standards in
processing plants, but not necessarily beyond.
The quality assurance mechanism beyond the
plants remains weak, especially at the landing
centres and procurement points. This limits
competitiveness of the industry as a whole in
international markets, with possible effects on
the poor downstream, although the last is not
clearly established. The response of the
government in regulating the seafood export
industry has been reactive rather than proactive.
Improvement of facilities for on-board handling
and at the landing centres is clearly important.
Improved information flow (on demand, supply
and prevailing prices) to the stakeholders,
especially those at the bottom end of the supply
chain, would increase their bargaining power vis-
à-vis the traders and dealers. Lack of availability
and accessibility to formal sources of credit is
another impediment resulting in increased
dependence of poor fishermen on middlemen
and traders.
Present levels of enforcement of regulations do
not seem to have had any visible or discernible
adverse impact on livelihoods of the poor
involved in the export supply chain. This study
seems to indicate that livelihoods of poor people
in the chain are currently only marginally
59
Appendix 4
(2) Fish Marketing Append.qxd 8/8/03 6:00 pm Page 59

affected by international legislation, mostly in a
negative way. These effects are, however, likely to
be accentuated if EU type legislation becomes
more stringent or enforced more stringently. In
particular, stricter regulations and enforcement,
especially with regard to traceability, could have
significant impact on the poor.
KeralaKerala is one of the major maritime states in
India accounting for 20.5% of the total marine
fish landings in India in 1999–2000. The major
species landed are oil sardine (14% by volume)
and shrimp (13% by volume). Kerala is also one
of the prominent exporters of seafood from India.
During 2000–01, Kerala accounted for 20.6% in
volume terms and 16.0% in value terms of Indian
seafood exports. The major export species from
Kerala are shrimp (59% by value, 32% by
volume), frozen cuttlefish (15% by value, 16%
by value) and frozen squid (13% by value, 17%
by volume). Finfishes, which account for 28% by
volume, are a relatively low value item
accounting for just 9% of the total export value.
The EU is the main destination for seafood
exported from Kerala with 33% of the volume
(and 36% of value) during the year 2000–01
going to this market. Japan (11% by volume and
18% by value) and the US (15% by volume and
22% by value) are the other major markets. South
East Asia (mainly China), which accounts for
34% by volume, accounts for only 16% by value,
indicating that this market mainly buys lower
value species, such as frozen ribbon fish and
frozen mackerel from Kerala.
Kerala was one of the states worst affected by the
EU ban imposed on shrimp imports from India in
1997. This was mainly because most of the
processing plants in Kerala were catering
exclusively to EU markets. Within a short span of
4 months, six processing plants in Kerala
upgraded their plants to meet EU standards and
obtained licenses to export to the EU. At the time
of the ban, there was a sharp fall in beach prices
of export species such as shrimp, cuttlefish and
squid. After the ban was lifted on the six units
that complied with EU norms, the beach prices
did not rise much because there were large
numbers of sellers and few buyers. This ensured
that the prices remained lower than the pre-ban
period. The early movers procured raw material
at very cheap rates and tapped into the EU
market. The other processing plants followed suit
and invested heavily in upgrading their plants.
Over the next 2 years, several plants obtained EU
approval and re-entered the EU market. This
resulted in increased competition for raw
material, which drove up beach level prices. In
2002, beach prices were higher than the pre-ban
price mainly because of the increased
competition and scarcity of raw material.
The EU ban had both a short-term direct impact
and a long-term indirect impact on the peeling
shed industry. The short-term impact was such
that overnight most of the processing plants, the
sole customers of the peeling sheds, stopped
purchases. Thus many peeling sheds found
themselves without many of their traditional
customers. The numbers of buyers fell sharply
and competition among the peeling sheds for the
limited market intensified, with those able to
provide material on liberal credit arrangements
preferred. Thus the smaller sheds, which were
unable to provide material on credit, were
gradually pushed out of the industry. This led to
a consolidation of sorts in the industry. There has
been a decline in the number of peeling sheds in
the aftermath of the EU ban. In place of the large
number of individual small-scale peeling sheds,
there are now larger peeling sheds and peeling
shed networks. Most of the small-scale peeling
sheds that currently operate work as sub-
contractors to the larger peeling sheds. The larger
peeling sheds have been able to survive mainly
on account of enlarging their raw material
procurement base and the ability to provide
peeled material on credit to processing plants.
The implementation of EU legislation regarding
pre-processing and processing of seafood has
been varied at different levels of the industry.
60
Appendix 4
(2) Fish Marketing Append.qxd 8/8/03 6:00 pm Page 60

Since the number of processing plants are few andthey are required to be registered, thegovernmental bodies in charge of implementinglegislation have a greater level of control overthem. Processors complain that governmentofficials have been too stringent in theirinterpretations of the EU directives and this hasresulted in higher costs for upgrading plants.However, a key aspect of the EU directives is thatpre-processing activity should be carried out onthe same premises as the processing. The degreeto which this aspect of the directive has beenenforced is questionable. Many of the processingplants which supply the EU market continue toprocure peeled material from independent peelingsheds in direct violation of this requirement of thedirective. This is mainly because given theuncertain supply of raw material and thedispersed nature of raw material availability, it isadvantageous for processing plants to rely on thepeeling shed industry to aggregate raw materialand supply it to them. This reduces the cost ofprocurement and the risks attached (mainly therisk of spoilage) for the processing plants. EU-approved processing plants have pre-processingfacilities attached to them, but in most cases,these facilities are mere showpieces during plantinspections by the relevant authorities.
The fact that the peeling shed industry is stilloperational is itself testimony to the degree ofimplementation of EU directives. Not only arethey functional (which they should not be if EUdirectives are strictly enforced), there are fewpeeling sheds that conform to the process andinfrastructure requirements as laid down in theEU guidelines.
One of the main complaints thatprocessors/exporters have about the EUlegislation is that it is more in the nature of a non-tariff trade barrier than an effort to ensure foodsafety. Many processors are of the opinion thatthe quality and process standards with which theyare required to comply are expensive toimplement and in addition, processing plants inEurope are not required to maintain the same
high standards. This in turn negatively impacts onthe cost competitiveness of Indian exporters vis-à-vis their EU counterparts. The widely heldview in the Kerala industry is that the EUdirectives are mainly to protect the local industryfrom cheaper imports.
One of the long-term effects of the EU ban is theemergence of a small group of powerful playersin the processing industry. It is estimated that in1999–2000, 8 out of the approximately 80seafood processors in Kerala handled around80% by volume and value of the total seafoodprocessed in the state. There are concerns thatthis same group could exercise greater controlover the supply chain in the years to come,manipulate prices and thus hurt the other playersin the industry.
The implementation of the EU legislation has atbest been patchy. That explains to a large extent thelack of any significant impact on the livelihoods ofpeople who depend on this industry. However, thesituation could be very different if implementationis carried through thoroughly. The first casualty ofa thorough implementation could be the peelingshed industry, as EU legislation requires all pre-processing activities to be carried out in approvedpre-processing facilities attached to the mainprocessing plant. If the farm to fork principle,which requires traceability, is carried out, it couldhave cost implications for all players in the supplychain. It remains to be seen how the various playerswill cope with any such strict implementation ofinternational seafood legislation.
61
Appendix 4
(2) Fish Marketing Append.qxd 8/8/03 6:00 pm Page 61

Main Findings of theProject Fish Distributionfrom Coastal Communitiesin Bangladesh – Creditand Market Access Issues
Access to sea and river fishery resources is thetraditional livelihoods asset of households in acoastal fishing community in Bangladesh. This iscomplemented by gear such as boats and nets.Other assets include land and means ofagricultural production, transport, health,education and financial resources in the form ofsavings, cash or credit.
Different wealth categories exist within thefishing villages. According to the villagers’ ownjudgement, the proportion of the poor (i.e.moderate poor to very poor) within the fishingcommunities is about 50–70% in thecommunities where the research took place. Ithas been observed that the number of householdsbelonging to the hardcore poor is relatively lessin villages which have direct access to the opensea. This may be related to the development ofnearby tourist spots (i.e. Cox’s Bazaar andKuakata Beach, respectively), which offeralternative income opportunities. In addition, theavailability of shrimp seeds and other less valuedspecies in the adjacent Bay of Bengal providepoor people with comparatively better livelihoodopportunities than other places. At the same time,it needs to be borne in mind that there is oftenlittle difference in the living standards betweenthe so-called middle classes in the villages andthe poor.
Landless households, widows or divorcedwomen, households with either no children orlarge numbers of children (i.e. especially girls,who will require dowry to get married), andfamilies without regular income represent themost vulnerable households.
Factors that cause poverty in the communitiesinclude declining fish catches, lack of security
(mainly in the fishing grounds due to piracy),natural disasters such as cyclones or floods, lackof capital, lack of employment opportunities, andlack of health and education/skills.
Both fishermen and traders state declining fishsupplies and piracy in the sea and on the rivers astheir main problems. Some stakeholders, such asaratdars, predict that only deep-sea fishing willsurvive in the long-run. Also, more concentrationis likely to occur within fishing communities (i.e.fewer people will own bigger boats).
Where catches will decline beyond a certainlevel, it may well lead to uncompetitive situationsto the extent that traders and moneylenders willleave affected locations. This will most likelyresult in a less efficient marketing system in thattrading competition will decrease.
In addition to the demand for seafood products inoverseas markets, certain marine fish species(e.g. hilsha, jewfish) are exported to India, HongKong and other countries. This appears to putupward pressure on domestic prices.
The decline in supplies of domestic marine fishis at least partly compensated for by increasedproduction of freshwater fish (i.e. mostly fromaquaculture), and imports of fresh and dried fishfrom Myanmar and India.
Although there is scope for improvement,marketing is less of a constraint according to thestakeholders consulted. Areas which canpotentially be targeted for marketing-relatedimprovements include more emphasis onmarketing training at community level,improvements of market infrastructure (i.e. oftenonly small improvements are required), better post-harvest handling practices (including reduction ofchemical use in dried fish processing), and betterexploitation of export opportunities.
Overall, the marine fish marketing system isquite efficient in that physical and qualitativelosses are small. The marketing margins appearreasonable given the highly perishable nature of
62
Appendix 4
(2) Fish Marketing Append.qxd 8/8/03 6:00 pm Page 62

the product, particularly in the case of freshmarine fish marketing. The dried fishdistribution system is also efficient, however,fishermen supplying the processing industryreceive low prices for their fish when there is aglut in the main season, especially in the moreremote areas.
If fishermen are ‘exploited’ in their loanarrangements with traders, this reflectsinefficiencies of the credit system (theopportunity cost of capital is very high inBangladesh, i.e. 5–15% interest per month).Nevertheless, there are variations in the informalcredit system and changes are taking place. Thecredit conditions are more favourable in certainlocations compared to others. In particular, lowerinformal interest rates have been observed whereNGOs are active with micro-finance programmes.
The production and marketing of dried fish willsee changes. Although dried fish processing andtrading will still provide employment for largenumbers of people in the foreseeable future, inthe long term, it is expected that less fish will beprocessed, even in remote areas, as a result of:
� declining fish catches
� increased demand for fresh fish (due toincreases in population and purchasingpower)
� better transport links
� ice supply, and other means of preservation.
At the same time, some fish, such as ribbon fish,will continue to be consumed mainly in driedform. Also, there is a demand for good qualitydried fish for export, which according to tradersis currently not being met.
Some of the traders will be squeezed out; forexample, there will be more concentration atwholesaler level. The contradiction betweenmarket efficiency and equity will remain at theretailer level. On the one hand, many retailers andvendors including women (about 10–20% ofretail traders are female) depend on fishmarketing for their livelihoods, on the other hand,
this considerably adds to the marketing margin.Ultimately, it will be the consumers who willhave to bear this cost.
Due to declining fish supplies, parts of coastalfishing communities will be forced out of thefishery to seek other employment. As aconsequence, alternative income-generatingactivities need to be urgently identified andcreated.
Results of wealth rankingexercises in the BangladeshstudyWealth ranking exercises were carried out in allof the six fishing communities as part of theparticipatory rural appraisals. Depending on thevillages, 3–5 wealth categories were identified.
Ownership of assets, such as land, fishing boatsand nets, house (and its condition), financialresources and animals, have been identified bythe villagers as key criteria for wealth. Inaddition, access to education and health services,as well as social influence and types of job orbusiness were mentioned.
63
Appendix 4
(2) Fish Marketing Append.qxd 8/8/03 6:00 pm Page 63
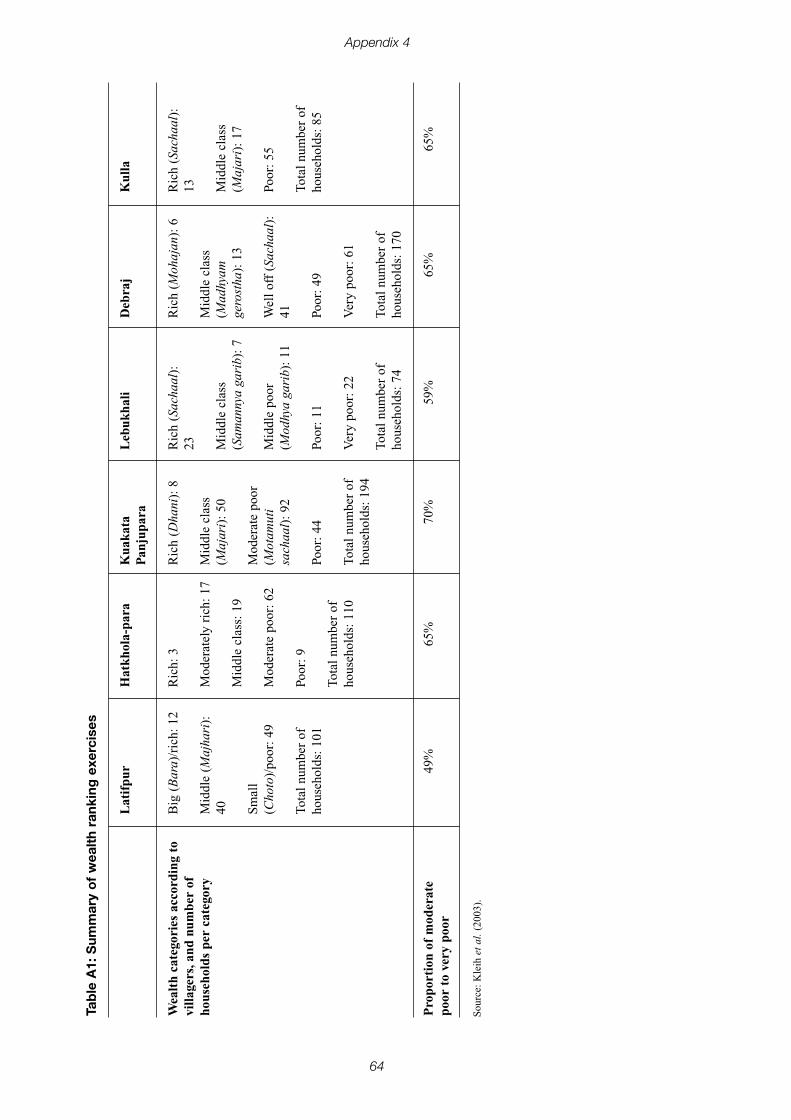
64
Appendix 4
Tab
le A
1: S
umm
ary
of
wea
lth
rank
ing
exe
rcis
es
Wea
lth
cate
gori
es a
ccor
ding
to
villa
gers
,and
num
ber
ofho
useh
olds
per
cat
egor
y
Pro
port
ion
of m
oder
ate
poor
to
very
poo
r
Lat
ifpu
r
Big
(B
ara)
/ric
h: 1
2
Mid
dle
(Maj
hari
):40
Sm
all
(Cho
to)/
poor
: 49
Tota
l nu
mbe
r of
hous
ehol
ds:
101
49%
Hat
khol
a-pa
ra
Ric
h: 3
Mod
erat
ely
rich
: 17
Mid
dle
clas
s: 1
9
Mod
erat
e po
or:
62
Poor
: 9
Tota
l nu
mbe
r of
hous
ehol
ds:
110
65%
Kua
kata
Pan
jupa
ra
Ric
h (D
hani
): 8
Mid
dle
clas
s(M
ajar
i):
50
Mod
erat
e po
or(M
otam
uti
sach
aal)
: 92
Poor
: 44
Tota
l nu
mbe
r of
hous
ehol
ds:
194
70%
Leb
ukha
li
Ric
h (S
acha
al):
23
Mid
dle
clas
s(S
aman
nya
gari
b):
7
Mid
dle
poor
(Mod
hya
gari
b):
11
Poor
: 11
Ver
y po
or:
22
Tota
l nu
mbe
r of
hous
ehol
ds:
74
59%
Deb
raj
Ric
h (M
ohaj
an):
6
Mid
dle
clas
s(M
adhy
amge
rost
ha):
13
Wel
l of
f (S
acha
al):
41 Poor
: 49
Ver
y po
or:
61
Tota
l nu
mbe
r of
hous
ehol
ds:
170
65%
Kul
la
Ric
h (S
acha
al):
13 Mid
dle
clas
s(M
ajar
i):
17
Poor
: 55
Tota
l nu
mbe
r of
hous
ehol
ds:
85
65%
Sou
rce:
Kle
ih e
t al
.(20
03).
(2) Fish Marketing Append.qxd 8/8/03 6:00 pm Page 64

65
Appendix 4
Fig
ure
A2:
C
om
mo
dit
y ch
ain
of
fres
h m
arin
e fis
h, B
ang
lad
esh
Tra
diti
onal
fis
herm
enM
echa
nize
d/N
on-m
echa
nize
dbo
ats
Impo
rts
(mos
tly f
resh
wat
erfi
sh s
uch
as r
ui)
Fis
h su
pplie
s
Ass
embl
ing
Pri
mar
y w
hole
sale
mar
keti
ng
Seco
ndar
y w
hole
sale
mar
keti
ng
Ret
ail m
arke
ting
Dom
esti
cco
nsum
ptio
n/ex
port
Woo
den
traw
lers
(sem
i-in
dust
rial
)
Ara
tdar
e.g.
Chi
ttag
ong,
Cox
’s B
azaa
r, K
huln
aPa
tuak
hali
, Bar
isal
Ara
tdar
e.g.
Dha
ka, R
ajsh
ahi,
Nor
th B
enga
l
Paik
er/d
adan
dar
Smal
l ara
tdar
Ret
aile
rR
etai
ler
Ani
mal
fee
d in
dust
ryD
omes
tic
cons
umer
Indu
stri
al t
raw
lers
Age
nte.
g. b
ased
in
Mya
nmar
Fis
h pa
rtie
s(n
ot n
eces
sari
lytr
adit
iona
lly i
nvol
ved
in f
ish
trad
ing)
Exp
orts
to,
e.g.
Indi
a,
Tha
ilan
d, U
SA
, UK
, M
iddl
e E
ast,
Japa
n
Fis
h pr
oces
sing
pla
nt
Dis
trib
utor
Sou
rce:
Kle
ih e
t al
.(20
02).
NB
: A
rata
dars
are
who
lesa
le t
rade
rs a
nd/o
r co
mm
issi
on a
gent
s.Pa
iker
sar
e in
term
edia
ry t
rade
rs.
Dad
anda
rstr
adit
iona
lly a
ct a
s m
oney
lend
ers
cum
tra
ders
.
(2) Fish Marketing Append.qxd 8/8/03 6:01 pm Page 65
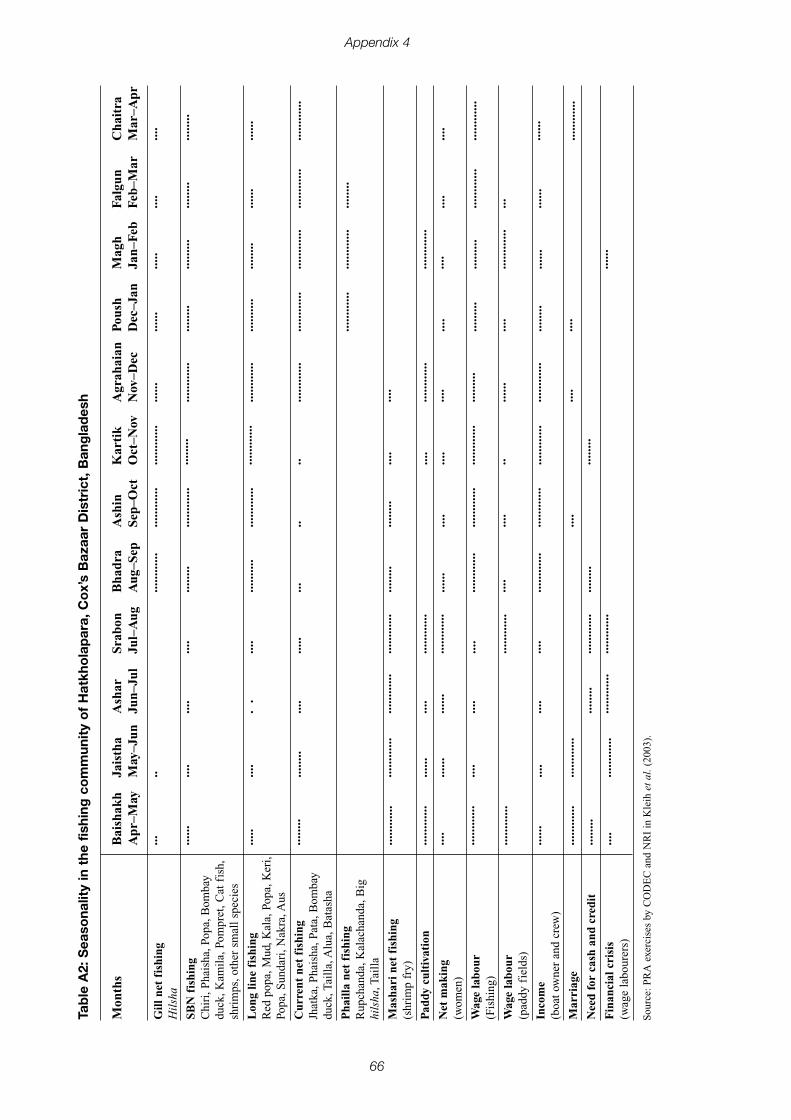
66
Appendix 4
Tab
le A
2: S
easo
nalit
y in
the
fis
hing
co
mm
unit
y o
f H
atkh
ola
par
a, C
ox’
s B
azaa
r D
istr
ict,
Ban
gla
des
h
Mon
ths
Gill
net
fis
hing
Hil
sha
SBN
fis
hing
Chi
ri, P
hais
ha, P
opa,
Bom
bay
duck
, Kam
ila,
Pom
pret
, Cat
fis
h,sh
rim
ps, o
ther
sm
all
spec
ies
Lon
g lin
e fi
shin
gR
ed p
opa,
Mud
, Kal
a, P
opa,
Ker
i,Po
pa, S
unda
ri, N
akra
, Aus
Cur
rent
net
fis
hing
Jhat
ka, P
hais
ha, P
ata,
Bom
bay
duck
, Tai
lla,
Alu
a, B
atas
ha
Pha
illa
net
fish
ing
Rup
chan
da, K
alac
hand
a, B
ighi
lsha
, Tai
lla
Mas
hari
net
fis
hing
(shr
imp
fry)
Pad
dy c
ulti
vati
on
Net
mak
ing
(wom
en)
Wag
e la
bour
(F
ishi
ng)
Wag
e la
bour
(p
addy
fie
lds)
Inco
me
(boa
t ow
ner
and
crew
)
Mar
riag
e
Nee
d fo
r ca
sh a
nd c
redi
t
Fin
anci
al c
risi
s (w
age
labo
urer
s)
Bai
shak
hA
pr–M
ay
···
······
·····
······
··
······
······
······
······
····
······
······
······
······
······
······
······
······
··
····
Jais
tha
May
–Jun
·· ····
····
······
··
······
······
······
······
····
····
······
······
······
······
Ash
arJu
n–Ju
l
····
· ·
····
······
······
····
······
····
····
······
·····
······
···
Srab
onJu
l–A
ug
····
····
·····
······
······
······
······
······
······
····
······
······
····
······
······
······
······
Bha
dra
Aug
–Sep
······
······
······
··
······
····
··· ······
··
······
······
······
····
······
······
······
··
Ash
inSe
p–O
ct
······
······
······
······
······
······
·· ······
··
····
······
······
····
······
······
····
Kar
tik
Oct
–Nov
······
······
······
··
······
······
·· ····
····
····
······
······
·· ······
······
······
··
Agr
ahai
anN
ov–D
ec
······
······
······
······
······
······
······
····
······
······
····
······
···
······
······
······
····
Pou
shD
ec–J
an
······
······
··
······
····
······
······
······
······
····
······
···
····
······
··
····
Mag
hJa
n–Fe
b
·····
······
···
······
··
······
······
······
······
······
······
····
······
···
······
······
······
······
Falg
unFe
b–M
ar
····
······
··
······
······
······
······
··
····
······
······
··· ······
Cha
itra
Mar
–Apr
····
······
··
······
······
······
····
······
······
······
······
······
Sou
rce:
PR
A e
xerc
ises
by
CO
DE
C a
nd N
RI
in K
leih
et
al.(
2003
).
(2) Fish Marketing Append.qxd 8/8/03 6:01 pm Page 66

67
Appendix 4
Table A3: Calculation of marketing margins: marketing of Hilsha from a landing centre near
Chittagong to Dhaka markets, July 2001
Selling prices and marketing costs
Assembling
Selling price: Fisherman to paiker at landing centre
Transport to assembly/wholesale market (by small boat or rickshaw)
Ice
Labour
Packaging
Commission (5% of sales; this goes to aratdar)
Net income for Chittagong paiker
Wholesale marketing
Selling price: Chittagong paiker to Dhaka aratdar
Transport from Chittagong to Dhaka by truck
Ice
Packaging and handling
Miscellaneous
Opportunity cost of capital (5% of wk capital)
Net income for Dhaka aratdar
Retailing
Selling price: Dhaka wholesaler to retailer
Retail marketing costs
Net income to Dhaka retailer
Selling price: Dhaka retailer to consumer
Taka/kg
60.00
1.50
1.00
2.50
0.25
4.00
10.75
80.00
1.50
1.50
1.30
0.50
4.24
5.96
95.00
13.00
12.00
120.00
%
50%
67%
79%
100%
Source: Kleih et al. (2003).
Assumptions: • no dadan (i.e. informal loan) involved between fisherman and paiker (intermediary trader)
• part of commission paid by paiker to aratdar (wholesale trader/commission agent) represents interest on loan
• transport is by truck
• prices are for small to medium sized fish (300–600 g)
(2) Fish Marketing Append.qxd 8/8/03 6:01 pm Page 67
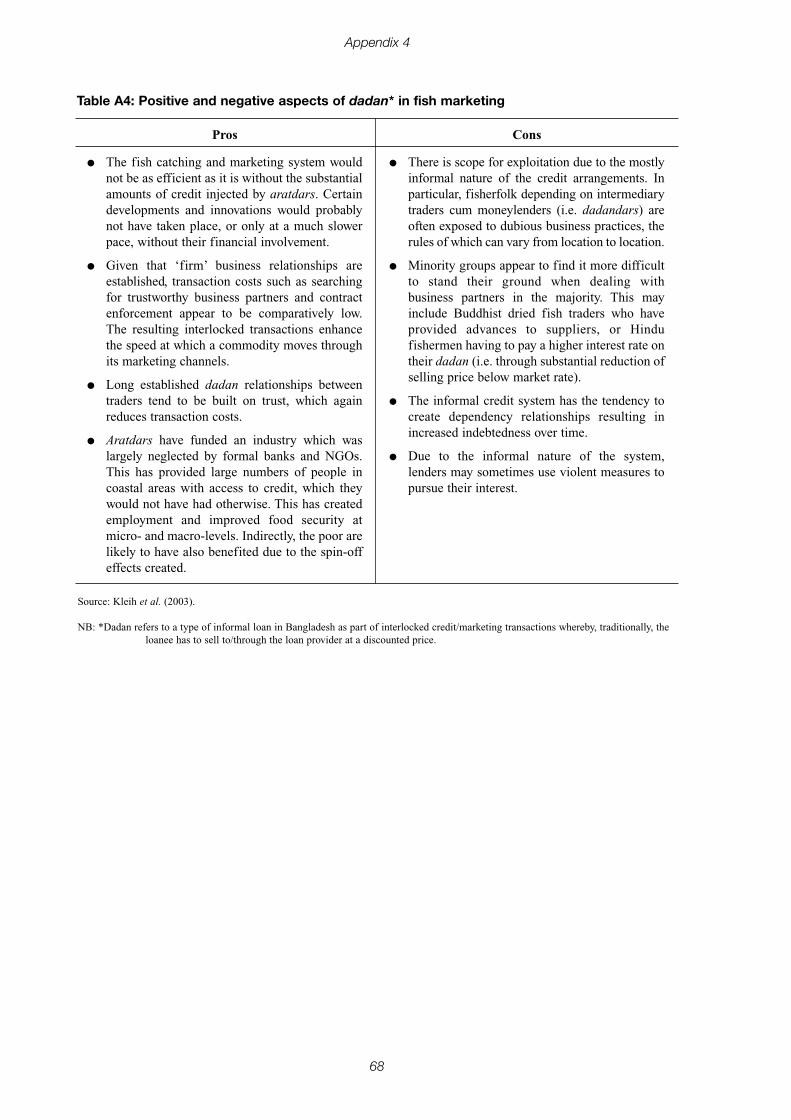
68
Appendix 4
Table A4: Positive and negative aspects of dadan* in fish marketing
Pros
� The fish catching and marketing system wouldnot be as efficient as it is without the substantialamounts of credit injected by aratdars. Certaindevelopments and innovations would probablynot have taken place, or only at a much slowerpace, without their financial involvement.
� Given that ‘firm’ business relationships areestablished, transaction costs such as searchingfor trustworthy business partners and contractenforcement appear to be comparatively low.The resulting interlocked transactions enhancethe speed at which a commodity moves throughits marketing channels.
� Long established dadan relationships betweentraders tend to be built on trust, which againreduces transaction costs.
� Aratdars have funded an industry which waslargely neglected by formal banks and NGOs.This has provided large numbers of people incoastal areas with access to credit, which theywould not have had otherwise. This has createdemployment and improved food security atmicro- and macro-levels. Indirectly, the poor arelikely to have also benefited due to the spin-offeffects created.
Cons
� There is scope for exploitation due to the mostlyinformal nature of the credit arrangements. Inparticular, fisherfolk depending on intermediarytraders cum moneylenders (i.e. dadandars) areoften exposed to dubious business practices, therules of which can vary from location to location.
� Minority groups appear to find it more difficultto stand their ground when dealing withbusiness partners in the majority. This mayinclude Buddhist dried fish traders who haveprovided advances to suppliers, or Hindufishermen having to pay a higher interest rate ontheir dadan (i.e. through substantial reduction ofselling price below market rate).
� The informal credit system has the tendency tocreate dependency relationships resulting inincreased indebtedness over time.
� Due to the informal nature of the system,lenders may sometimes use violent measures topursue their interest.
Source: Kleih et al. (2003).
NB: *Dadan refers to a type of informal loan in Bangladesh as part of interlocked credit/marketing transactions whereby, traditionally, theloanee has to sell to/through the loan provider at a discounted price.
(2) Fish Marketing Append.qxd 8/8/03 6:01 pm Page 68
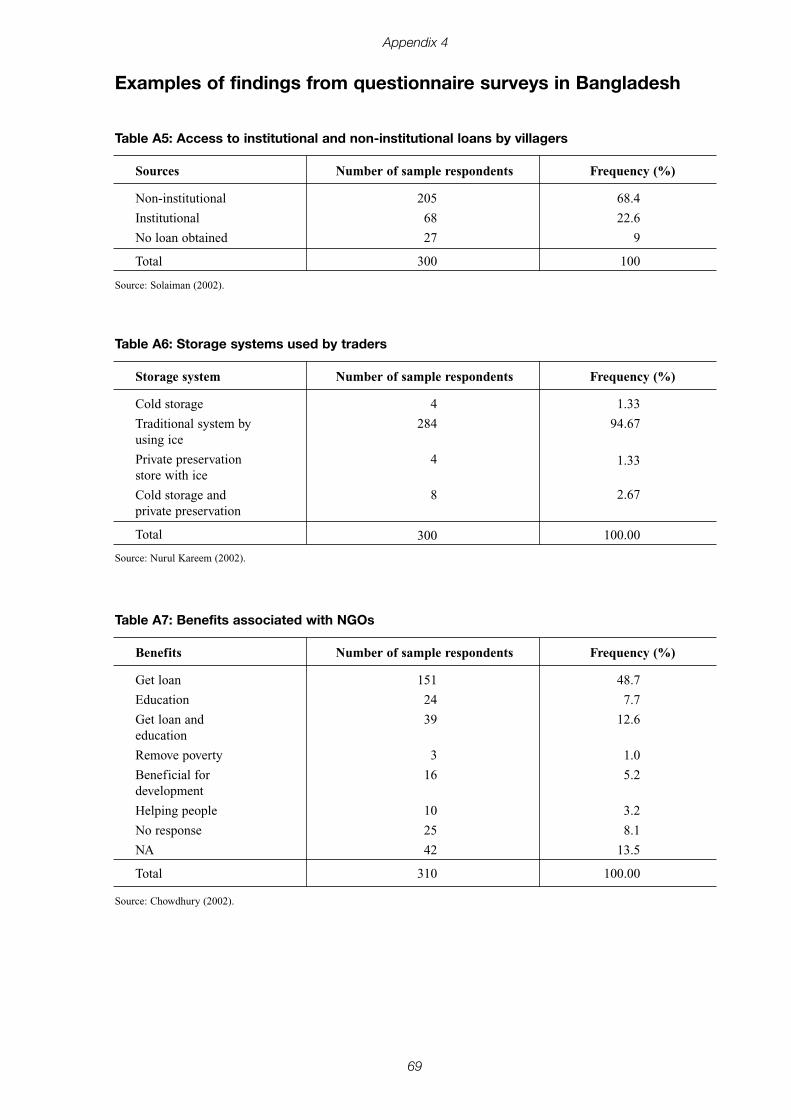
69
Appendix 4
Table A5: Access to institutional and non-institutional loans by villagers
Sources
Non-institutional
Institutional
No loan obtained
Total
Number of sample respondents
205
68
27
300
Frequency (%)
68.4
22.6
9
100
Examples of findings from questionnaire surveys in Bangladesh
Source: Solaiman (2002).
Table A6: Storage systems used by traders
Storage system
Cold storage
Traditional system byusing ice
Private preservationstore with ice
Cold storage andprivate preservation
Total
Number of sample respondents
4
284
4
8
300
Frequency (%)
1.33
94.67
1.33
2.67
100.00
Source: Nurul Kareem (2002).
Table A7: Benefits associated with NGOs
Benefits
Get loan
Education
Get loan andeducation
Remove poverty
Beneficial fordevelopment
Helping people
No response
NA
Total
Number of sample respondents
151
24
39
3
16
10
25
42
310
Frequency (%)
48.7
7.7
12.6
1.0
5.2
3.2
8.1
13.5
100.00
Source: Chowdhury (2002).
(2) Fish Marketing Append.qxd 8/8/03 6:01 pm Page 69

(2) Fish Marketing Append.qxd 8/8/03 6:01 pm Page 70
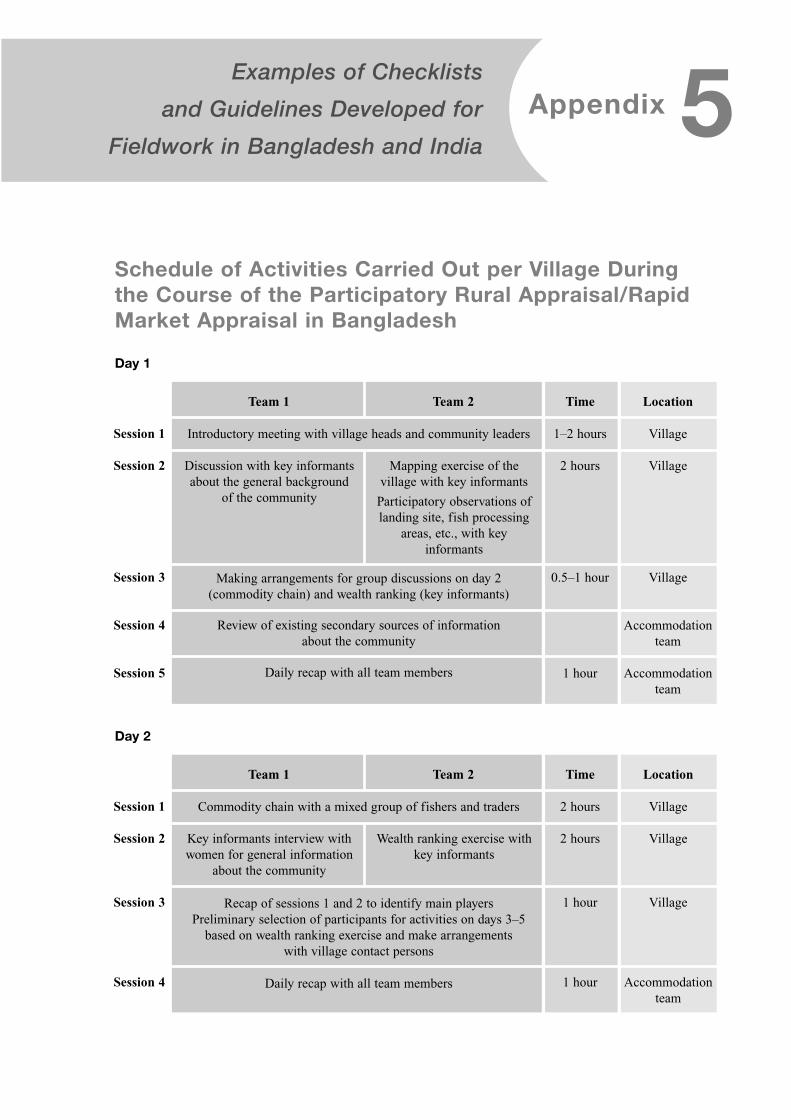
Examples of Checklists
and Guidelines Developed for
Fieldwork in Bangladesh and India
15Appendix
Session 1
Session 2
Session 3
Session 4
Session 5
Team 1 Team 2 Location
Village
Village
Village
Accommodationteam
Accommodationteam
Time
1–2 hours
2 hours
0.5–1 hour
1 hour
Introductory meeting with village heads and community leaders
Making arrangements for group discussions on day 2 (commodity chain) and wealth ranking (key informants)
Review of existing secondary sources of information about the community
Daily recap with all team members
Discussion with key informantsabout the general background
of the community
Mapping exercise of thevillage with key informants
Participatory observations oflanding site, fish processing
areas, etc., with keyinformants
Day 1
Session 1
Session 2
Session 3
Session 4
Team 1 Team 2 Location
Village
Village
Village
Accommodationteam
Time
2 hours
2 hours
1 hour
1 hour
Commodity chain with a mixed group of fishers and traders
Daily recap with all team members
Recap of sessions 1 and 2 to identify main playersPreliminary selection of participants for activities on days 3–5
based on wealth ranking exercise and make arrangements with village contact persons
Key informants interview withwomen for general information
about the community
Wealth ranking exercise withkey informants
Day 2
Schedule of Activities Carried Out per Village Duringthe Course of the Participatory Rural Appraisal/RapidMarket Appraisal in Bangladesh
(2) Fish Marketing Append.qxd 8/8/03 6:01 pm Page 71

72
Appendix 5
Session 1
Session 2
Session 3
Session 4
Team 1 Team 2 Location
Village
Village
Village
Accommodationteam
Time
2 hours
2 hours
0.5–1 hour
1–2 hours
Seasonal calendar with a group of men
Focus group discussion oncommodity chain with separatekey player groups (i.e. fishers)
Making arrangements for day 4 (focus group discussions with defined groups of key players)
Daily recap with all team members
Focus group discussion oncommodity chain with separate
key player groups (i.e. fish processors)
Ranking exercise
Day 3
Session 1
Session 2
Session 3
Session 4
Team 1 Team 2 Location
Village
Village
Village
Accommodationteam
Time
2 hours
2 hours
1 hour
1–2 hours
Participatory povertyassessment with men
Focus group discussion oncommodity chain with separatekey player groups (i.e.paikers)
Feedback to village heads and farewell
Daily recap with all team members
Focus group discussion oncommodity chain with separate
key player groups (i.e. hawkers – beparies)
Participatory poverty assessment with women
Day 4
Session 1
Session 2
Session 3
Team 1 Team 2 Location
Main fishmarket
Main fishmarket
Accommodationteam
Time
2 hours
2 hours
1–2 hours
Focus group discussion on commodity chain with paikers/aratdars at a nearby main fish market
Market interviews withindividual fish traders (fresh)
Daily recap with all team members
Market interviews withindividual fish traders (dry)
Day 5
Team 1 Team 2 LocationTime
Additional field day if required
Day 6
(2) Fish Marketing Append.qxd 8/8/03 6:01 pm Page 72

Checklist for ParticipatoryPoverty Assessments(Focus GroupDiscussions)
ObjectiveDiscussions to be held with groups of men andwomen separately. The focus of the discussion isabout the changes occurring within the fishingcommunities and how these relate to poverty.Note changes in access to social, physical,natural, human and financial capital and bothpositive and negative consequences.
Poverty � What are the visible signs of poverty?
How can you see someone is poor?
� What makes people poor?
What are the circumstances in which peoplefall into poverty. Ask first in general terms.Then probe to see if they can think of aspecific example of someone in theircommunity who used to be well-off and hasbecome poor.
� What are the ways of getting out of poverty?
If the group has come up with rather generalissues such as improved access to educationand skill training, creation of jobopportunities, ask if they can think of specificpeople within their community who havemanaged to move out of poverty and how theymanaged it.
� What makes it difficult for poor people toimprove their well-being/to move out ofpoverty?
� Are some groups more vulnerable thanothers?
If the group finds it difficult to think ingeneral terms (i.e. ill people, old age orwidows), ask if they can think of anyonewithin their community who they believe ismore vulnerable than them and ask thereasons why.
� If poor people experience hardship due tochanges in living conditions or shocks, howdo they cope with it?
Again if people find it difficult to answergenerally ask for examples within theircommunities and/or nearby communities.
Physical� Has the number of nets and/or boats increased
or decreased within the community?
� Has it become easier or more difficult forpoor people to access fishing nets and/orboats/engines? Why?
� Has the provision of transport improved? Dopeople feel it is sufficient?
� How is the access to markets, are both tradersand consumers’ needs catered for?
Social� Have there been changes in the way extended
families support each other in times ofdifficulties? If yes, how has it changed?
� Do they feel that rich community membersrespect and/or try to help the poor?
� Do they feel that the thana union issupporting or tries to help the poor? If no,why not? And the government?
� Has the number of people migrating from thevillage increased/decreased over the pastyears?
� What are the main reasons why peoplemigrate? Where do they migrate to?
� If increased migration, does it have a positiveor negative impact on the community/families? How?
Human� Has access to health services changed over the
past 20 years? If yes, how, has it becomebetter/worse for the poor?
� Have there been changes in access toeducation and skills training opportunities? Ifyes, how? Has it become better/worse for thepoor?
73
Appendix 5
(2) Fish Marketing Append.qxd 8/8/03 6:01 pm Page 73
Financial� In case of unexpected cash requirements, what
are the most important sources of capital?
� If people want to start a new activity, how dothey get the start-up capital?
� What are the most important sources of credit(probe for informal, NGO and bank services)?
� Are there people who have limited or noaccess at all to these sources of credit? If yes,who and why not?
� Compared to the past, has access to creditimproved, decreased or remained the same? Ifyes, explain?
Natural� Have there been changes in the
environment/natural resources such as fishstocks, weather, water supply, air, forests andland?
� What has changed?
� Who has been affected in particular?
Livelihood strategies� What are the occupations/main sources of
income of the poor men of the community?
� What are the main sources of income of thepoor women of the community?
� What types of occupations would the groupmembers prefer to have?
� List the preferred occupations and rank themand explore the reasons for the ranking.
� Compared to other sources of income, has theimportance of fishing-based occupationschanged (increased, decreased or remainedthe same)? Reasons?
74
Appendix 5
(2) Fish Marketing Append.qxd 8/8/03 6:01 pm Page 74

Checklist for MappingCommodity Chains
ObjectiveTo develop an understanding of the commoditychain, the produce, the key players, opportunitiesand challenges. This exercise can be done both inthe village and the fishing terminal.
Material neededLarge sheets of paper, markers, pens and tape.
What to doHave a mixed group of traders, fishers andprocessors. Make sure that the exercise is notdominated by one individual.
Explain purpose of exercise. We would like tolearn from them:
� Who is involved in the marketing of fish?
� Where and how the fish is sold?
� What the constraints are and perceivedsolutions?
Start with identifying how many differentmarketing channels there are, i.e. related tofish technology and/or fish species. Forexample, there may be a different commoditychain for hilsa and Bombay duck. Afteridentification of the main commodity chains,discuss and map each one separately, by goingthrough the following steps.
Identify the players in the commodity chain atvillage and trader level, and write them on thepaper or use symbols suggested byparticipants (especially if some of them areilliterate). Ask the following questions:
� Who is involved in fish catching andprocessing in the village?
� Who buys the fresh/processed fish?
� Where does the fresh/processed fish go tothen, for as many stages in the marketingchain of which the participants are aware?
� The number of traders per category? Howmany are community members and/oroutsiders?
� The scale of their business and whether theyprovide credit or take credit (to whom/fromwhom)?
� Extent of competition between the traders?
� Draw arrows representing commodity flowbetween players, use thicker arrows for moreimportant volumes.
Additional questions
� How is the fish transported, to where, and isice used?
� ‘How’ fish is sold, i.e. pricing mechanisms?
� Flow of information in the commodity chain,for example, are fishers and/or villagers awareof prices in the main fish markets (i.e. theregional or national markets, i.e. Dhaka,Chittagong, Cox’s Bazaar and Khulna)?
� Are there barriers of entry into the market atcommunity level (e.g. can fisherfolk sell theirfish directly at the local market, or inChittagong/Cox’s Bazaar?
� The relationship between selling of fish andcredit. How many traders and moneylendersprovide credit, i.e. the proportion of peoplewho provide/take credit? Why? What are thepractices involved (e.g. conditions andterms)?
� Changes and dynamics in the system over thelast three decades?
� Physical and qualitative losses in the chain?
� Means of preservation used for fresh andprocessed fish (e.g. what chemicals)?
� Main problems in the marketing system?
Suggestions by the participants?
75
Appendix 5
(2) Fish Marketing Append.qxd 8/8/03 6:01 pm Page 75

Checklist for Focus Group Discussion with Fishermen
ObjectiveTo obtain better understanding of the activities,opportunities, challenges and changes they haveexperienced. It also seeks to explore therelationship they have with other key playersfrom their perspective.
Points to discussRemember this should be a discussion, so do notfollow rigidly the outline.
First ask the participants to introduce themselvesand talk about the type and number of boats andnets they have. How did they acquire these? Havethere been any changes in the number/type ofboats they have?
� How is the fishing organized? For eachspecific fishing technology ask:
– number of crew required
– salary arrangements and/or sharing arrangements for the catch
– length of working agreement (seasonal/dayto day), continuity of crew composition?
– do boat owners assist the fishing crew in anyother way (i.e. food, part of the catch, loans, support for family in times of emergencies, etc.)
– have there been any changes in the way fishing is organized?
� Constraints faced regarding fish catching?List constraints according to priority?
� How much fish is sold, and how much isconsumed by the family?
� In what form is fish sold, i.e. fresh orprocessed?
� If fish is processed, what techniques are used(e.g. sundrying, salting)?
� Who is in charge of processing in the village?(If it turns out that some of the fishermen alsoprocess, use separate checklist forprocessors.)
The following questions are for fresh fish only.
� Constraints faced regarding marketing offresh fish. List constraints according topriority?
� How much time passes between catching thefish and landing, how many stages areinvolved? What preservation techniques areused?
� How much time passes at the landing sitebefore fish is sold?
� Are they able to sell all the fish they catch?Do they ever have to discard fish or throw itaway? If so, why?
� Is ice used at all. If yes, by whom? Is iceeasily available if needed? What type of ice isavailable – block, flake or plate? How muchdoes it cost, and where does it come from?
� How is fish transported from the landing siteto the market? Vehicles used? Means ofpreservation? Costs involved?
� Is fish sold according to different grades andif so what criteria are used? And how does theprice vary according to the different grades?
� Range of prices obtained for main fish speciesduring main season and off-season?
� What sort of quantities of fish aredowngraded on average, per season?
� How is fish marketing organized in thevillage? Who are the buyers?
� How much of the fish enters which marketingchannel? And where do these channels lead to?
� Are they aware of fish prices in major marketsof the country? If yes, source of informationand what are the prices at the moment? If not,do they think it would help them if they knewthe prices, and how would it help them?
� Is it possible for individual fishermen to sellfish in Chittagong market or other markets? Ifyes, how many are doing it, and who? If no,why are they not doing it?
76
Appendix 5
(2) Fish Marketing Append.qxd 8/8/03 6:01 pm Page 76

� What is the link between credit andmarketing? How does it affect the price? (It isimportant to obtain objective answers in thiscontext!)
� If they have obtained loans and are nowobliged to sell fish to the moneylender/trader,why did they enter this relationship? What arethe conditions?
� For what do they need credit? Ask them toprioritize.
� What are the possibilities for obtaining creditfrom semi-formal or formal sources of credit(i.e. NGOs, banks)? What are the conditions?
� Is there a fishermen association/co-operativein the village? If yes, what are its functions,and how many members does it have? Whoare the members?
� Have they ever thought about creating anassociation and selling the fish as a group inthe Chittagong market? What are the potentialdifficulties/costs associated with this?
� Do they have any other issues they would liketo discuss?
� What suggestions do they have to solve theproblems discussed during the course of themeeting, related to fish catching, marketing,and credit?
Thank the group for time and information!
77
Appendix 5
(2) Fish Marketing Append.qxd 8/8/03 6:01 pm Page 77

Checklist for Interviewswith Traders
ObjectiveTo obtain a better understanding of the activities,opportunities, challenges and changes, tradersexperience(d) with the trade in export species(shrimp, squid, cuttlefish and lobster), with aparticular focus on post-harvest issues andinternational quality and hygiene requirements.
ToolsFocus group discussions or individual interviewsas it may prove difficult to organize focus groupdiscussions with traders. Pay attention to differenttypes of traders involved in the export trade (scaleand nature of operation, i.e. small traders versuslarge independent traders and local agents linkedto processing plants/export house, gender).
Introduction� Introduce the team, explain research activities
and purpose of interview.� Ask people to introduce themselves – name,
type of trader and for how long they have beentrading export species.
Trading as a livelihood� What species of domestic and export fish do
you trade?
� Are there any seasonal changes in the type ofspecies in which you trade?
� For what species do you get the highest andlowest margins?
� Which is the most important species for yourincome, in terms of value and volume?
� Do you and your family members have anyother fisheries-related sources of income?
� Do you and your family members have anynon-fisheries-related sources of income?
� Which source is the most important forsupporting your family?
Marketing� Where and from whom do you buy your fish
(e.g. small fishermen, trawlers)?
� Which is the most important source ofsupply?
� Do you provide seasonal advances tofishermen?
� Who do you sell to? Map the commoditychain (export house/peeling shed/processingplant, wholesaler).
� What are your main marketing and operationcosts (i.e. transport, storage, handling, ice,finance)?
� Have particular types of costs increased overthe past years?
� If yes, which ones and why?
If (s)he supplies peeling sheds
� How many peeling sheds do you provide withfish?
� Do you also run your own peeling sheds or areyou employed by peeling sheds?
� Is the number of peeling sheds rising, fallingor amalgamating?
� Are processing plants and/or export housesinvesting in peeling sheds?
� Have you observed any changes in thestructure and organization of peeling sheds?
Price setting� How do you decide at which price to buy?
� What are your sources of price information?
� Does the quality of supply affect the price youoffer?
� If the quality is not 100%, do you still buy oropt out?
Post-harvest and quality requirements� Do you do anything to the product before
selling? If yes, what (e.g. ice, packaging)?
� How do you store and package your supplybefore and during transport?
78
Appendix 5
(2) Fish Marketing Append.qxd 8/8/03 6:01 pm Page 78

� How are your goods transported?
� Have there been any changes in the way theexport species are handled, stored, packagedand transported (i.e. mode of transport, use ofcrates/baskets, use of ice, time betweenlanding, auction and further)?
� Are you satisfied with current landing site andtransport facilities? If not, why not?
� How do you ensure the quality of yourpurchased supply before you sell it on?
� What is the basic minimum quality youexpect from fishermen?
� What is the basic minimum quality requiredby the export house, processing plants orpeeling sheds?
� Have there been any changes in qualityrequirements from processing plants, peelingsheds and export houses?
� If yes, in what way and why?
� Do you find it difficult to meet these qualityrequirements? If yes, why? Do you feel theserequirements are unrealistic?
� Do you get advice/extension about qualityissues and marketing? If yes, by whom andwhat type of advice? (Example)
� Do you feel the level of advice/extension issufficient?
� Was there any crisis in the industry about 5years back? If yes, what was the reason andhow did it affect you and the other players inthe industry? If no, have you heard of the EUban in 1997? How did it affect you?
� Are you aware of Indian legislation regardingquality and food safety? If yes, what does itstipulate?
� What do you know about internationallegislation? Are there any differences inquality requirements from Japan, USA andEurope? If yes, in what way and how does itaffect your business?
� Have there been any changes in theirrequirements? If yes, in what way and howhas it affected your business?
Problems and perceptions� Has the number of traders in your area
changed, increased, decreased or remained thesame? If increased, how and how does it affectyour business? If decreased, how and did itaffect your business?
� Are you planning to expand your business? Ifnot, why not?
� What are the problems you face in yourbusiness? Which is the most important?
� Have there been any major external eventsthat affected your business in a negative way(i.e. EU ban of fish exports from India,decline in catches)?
79
Appendix 5
(2) Fish Marketing Append.qxd 8/8/03 6:01 pm Page 79

Checklist for Interviewswith Peeling Shed Owners
ObjectiveTo obtain a better understanding of the activities,
opportunities, challenges and changes, peeling
sheds owners experience(d) in the trade of export
species (shrimp, squid, cuttlefish and lobster),
with a particular focus on post-harvest issues,
pre-processing activities and international quality
and hygiene requirements.
ToolsFocus group discussions or individual interviews
as it may prove difficult to organize focus group
discussions with peeling shed owners. Pay
attention to different types of peeling sheds
involved in the export trade (scale and nature of
operation, and species pre-processed,
individually owned or corporate owned).
IntroductionIntroduce the team, explain the research activities
and purpose of interview.
Ask people to introduce themselves – name, and
for how long they have been involved in the
peeling shed business.
Operation� What species, both export and domestic, do
you handle?
� Which species is most important to your
income in terms of volume/value?
� What type of peeling activities do you carry
out?
� How do you decide which pre-processing
activities are required?
� Have there been any changes in the type of
peeling activities carried out in your peeling
shed? If yes, in what way and how has it
affected your business?
� What are your sources of supply (purchased,
delivered by local traders, local agents on
behalf of processing plants/export houses)?
Rank according to importance (value and
volume).
� Have there been any changes in your main
sources of supply over the past 10 years?
� Do you mainly provide services to local
agents/processing plants or do you buy and
sell, or mix?
� If you sell, who do you sell to – number and
structure of export trade and their role in the
trade?
� What is the maximum daily capacity? Is it
flexible?
� Is your peeling shed used by other peeling
sheds in case of insufficient capacity?
� Do you use other peeling sheds in case of
insufficient capacity?
� What is the annual volume you handled last
year?
� Did it change from the previous 5–10 years?
� In the past 5–10 years, which was the
best/worst year, and why?
� If you want to start a peeling shed, what type
of infrastructure and services do you need?
� Do you see any deficiency, which hampers
your pre-processing activities? If yes, what?
� What are your main operation costs
(breakdown of items but not the costs, i.e.
labour, infrastructure, running costs)?
� Which is your main operation cost?
� Do you expect any changes in operation costs
for the near future? If yes, in what way and
why?
� What are your sources of finance for
establishing/running peeling sheds?
� Do you take advances from processing plants?
Labour
� How do you recruit your labour force?
� Do your family members also contribute to
labour in your peeling sheds?
� Can anyone become a peeler?
� How are they paid?
� Are they employed throughout the season?
80
Appendix 5
(2) Fish Marketing Append.qxd 8/8/03 6:01 pm Page 80
� Do they work shifts? Working hours?� Do you experience problems in ensuring a
reliable and good labour force?� Any changes in origin and type of labour
force (migration and employment in otherstates)?
Post-harvest and quality requirements� How is the fish packaged from and to your
peeling sheds (i.e. use of ice, crates/baskets)?
� How is the fish transported from and to yourpeeling shed?
� Have there been any changes in the way thefish is packaged/transported over the past 20years?
� What are the basic minimum qualityrequirements you expect from suppliers(traders, agents, fishermen)?
� What are the basic minimum qualityrequirements required by processingplants/export houses?
� Have there been any changes in qualityrequirements from the processing plants/export houses? If yes, in what way and why?
� Do you find it difficult to meet these qualityrequirements? If yes, why? Do you feel theserequirements are unrealistic?
� Do you get advice/extension about qualityissues? If yes, by whom and what type ofadvice? (Example)
� Do you feel the level of advice/extension issufficient?
� Are you aware of Indian legislation aboutquality and food safety? If yes, what does itstipulate?
� What do you know about internationallegislation? Are there any differences inquality requirements from Japan, USA andEurope? If yes, in what way and how does itaffect your business?
� Have there been any changes in theirrequirements? If yes, in what way and howhas it affected your business?
Institutional context� Is there a peeling shed owners’ association? If
yes, how active? What are the objectives andactivities? Are you a member?
� Are there any regulations as stipulated bygovernment for operating a peeling shed?
� Do you need to be registered with anygovernment institutions, i.e. MPEDA? If yes,are you registered? If not, why not?
� Did you face any problems in registering withMPEDA?
� Has the process of registration with MPEDAbecome more or less stringent in the pastyears? If more, why?
� Do you need to pay for registration?
� Do you have regular inspections? If yes, bywhom? What do they look for andrecommend?
� What do you think of the inspections(impractical/practical)?
� When was the last time your plant wasinspected?
� Have there been any changes in inspectionprocedures/frequencies?
Problems and perceptions� Has the number of peeling sheds in your area
changed, increased, decreased, amalgamatedor remained the same? If increased, how andhow does it affect your business? If decreased,how and did it affect your business?
� Are processing plants or export housesinvesting in peeling sheds?
� Are you planning to expand your business? Ifnot, why not?
� What are the problems you face in yourbusiness? Which is the most important?
� Have there been any major external eventsthat affected your business in a negative way(i.e. EU ban of fish exports from India,decline in catches)? If yes, which and how?
� In what ways have other stakeholders of theseafood industry been affected, for example, thefishermen, traders, peeling shed operators, etc.?
81
Appendix 5
(2) Fish Marketing Append.qxd 8/8/03 6:01 pm Page 81

Step-by-step Guides for Selected Data Collection Tools
Some of the PRA-related materials are based onTheiss and Grady (1991).
82
Appendix 5
Before the survey
� Select multi-disciplinary survey team.
� Analyse secondary data.
� Prepare checklist for the interview. This should be a team exercise.
� Prepare the logistical side of the survey.
� Inform villagers through NGO or government extension officers that you are coming.
� Establish note-taking procedures within the group before you enter the village.
� Decide whether a group discussion or individual in-depth interviews are more appropriate.
During the meeting
� Be aware of the local culture and language.
� Respect villagers as equal partners. Listen to what they have to say.
� Do not use the checklist as a questionnaire but as a means of stimulating discussion andparticipatory dialogue.
� Build the questions to be asked around a list of sub-topics, existing information on thecommunity, or visual material such as diagrams, photographs or maps.
� Use the ‘six little helpers’ for probing – who? why? what? when? where? how?
� Take notes during the interview but make sure this is not overdone. Sometimes it is better tocomplete notes immediately after the discussions.
After the meeting
� Finish the meeting politely.
� Have evening brain-storming sessions with the team to complete your notes and to preparethe following day.
� Establish report-writing procedures with the team. Make sure enough time is allocated.
Box A6: Steps to consider for semi-structured interviewing
(2) Fish Marketing Append.qxd 8/8/03 6:01 pm Page 82
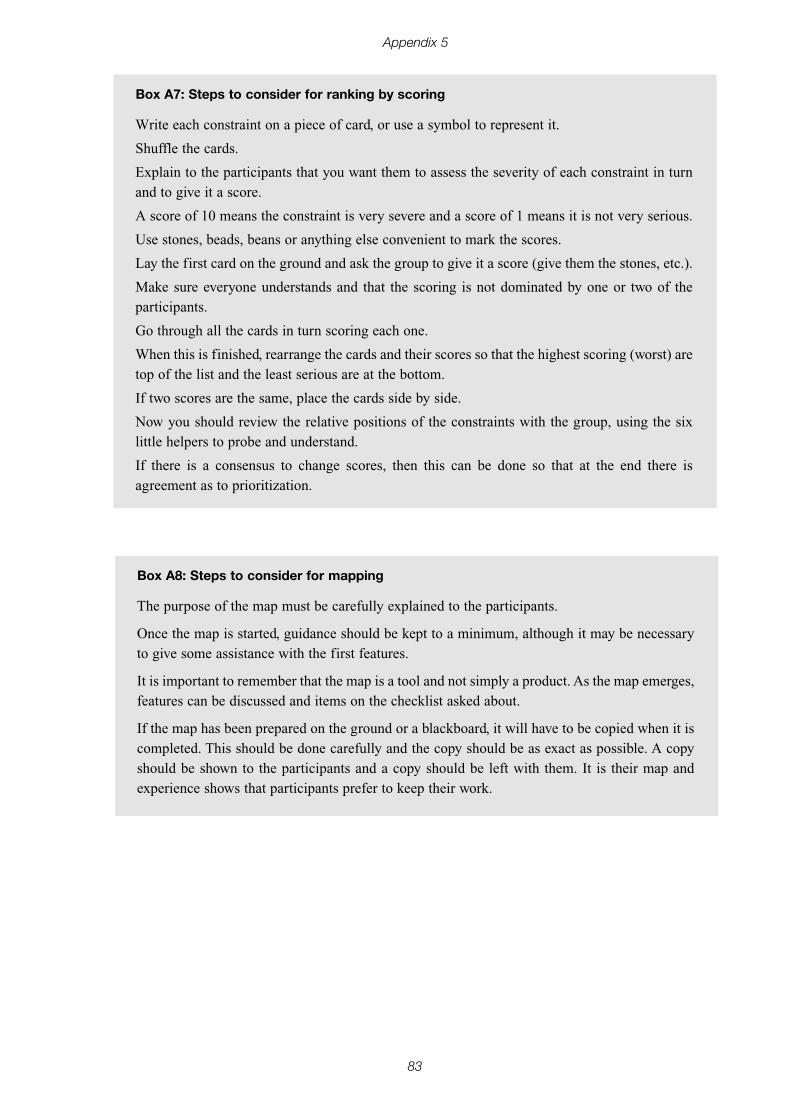
83
Appendix 5
Write each constraint on a piece of card, or use a symbol to represent it.
Shuffle the cards.
Explain to the participants that you want them to assess the severity of each constraint in turnand to give it a score.
A score of 10 means the constraint is very severe and a score of 1 means it is not very serious.
Use stones, beads, beans or anything else convenient to mark the scores.
Lay the first card on the ground and ask the group to give it a score (give them the stones, etc.).
Make sure everyone understands and that the scoring is not dominated by one or two of theparticipants.
Go through all the cards in turn scoring each one.
When this is finished, rearrange the cards and their scores so that the highest scoring (worst) aretop of the list and the least serious are at the bottom.
If two scores are the same, place the cards side by side.
Now you should review the relative positions of the constraints with the group, using the sixlittle helpers to probe and understand.
If there is a consensus to change scores, then this can be done so that at the end there isagreement as to prioritization.
Box A7: Steps to consider for ranking by scoring
The purpose of the map must be carefully explained to the participants.
Once the map is started, guidance should be kept to a minimum, although it may be necessaryto give some assistance with the first features.
It is important to remember that the map is a tool and not simply a product. As the map emerges,features can be discussed and items on the checklist asked about.
If the map has been prepared on the ground or a blackboard, it will have to be copied when it iscompleted. This should be done carefully and the copy should be as exact as possible. A copyshould be shown to the participants and a copy should be left with them. It is their map andexperience shows that participants prefer to keep their work.
Box A8: Steps to consider for mapping
(2) Fish Marketing Append.qxd 8/8/03 6:01 pm Page 83

84
Appendix 5
Make a list of all the households in the community and assign each household a number. Thename of the head of the household and the number from the master list should be written on aseparate card or piece of paper.
Ask a number of key informants, who have lived in the community for a long time and whoknow all the households, to sort the cards into piles, independently of each other, according towealth categories in the community (using their own criteria). If the informant is not literate,read the name on the card, hand it to him, and let him choose the pile on which to place it.
Use numbered baskets or small boxes. This helps the sorter to remember which is which andmakes it easier to record the scores without mixing the baskets. Shuffle the cards betweensortings so that each sorter starts with a random pile of unsorted cards.
After sorting, ask the informant what wealth criteria he chose for each pile and what thedifferences are between the piles. Assure the sorters of confidentiality and, to avoid bad feelingswithin the community, do not discuss the ranks of individual families. List local criteria andindicators derived from the ranking exercise and examine differences between informants.
When the informant has sorted all the cards into piles, record the score for each household ona score sheet according to the number of the pile. If a household cannot be placed because thefamily is unknown to the sorter or the sorter cannot decide to which group it belongs, leave ablank by the household’s name for that informant. Ask at least three informants to sort all thehouseholds in the community independently to ensure that the results are reliable.
If the number of wealth categories used by the informants differs, divide each household's scoreby the number of wealth categories used by the particular sorter and multiply by 100. Forexample, a household in the third of five piles would receive a score of 60 (3/5 * 100 = 60). Thisprocedure is necessary for comparing the scores of different sorters with each other (unless theyall use the same number of wealth categories).
When the scores of each informant have been recorded on the form, add them and divide thetotal by the number of sorters. For example, if one of four sorters could not place one of thehouseholds, that household's total score is divided by three instead of four. Check the sorters’scores for consistency. If one sorter’s results differ widely from the others, he may havemisunderstood his instructions or reversed the baskets. In this case, disregard that sorter’s scoresand ask another informant to do the sorting.
Finally, arrange households according to wealth categories. If the sorters used different numbersof piles, take the average number of wealth categories (e.g. if four informants have four, four,seven and six piles, respectively, divide the community into five wealth groups). Using thissystem, rich households in the community will have low scores and the poorest households willhave high scores.
Box A9: Steps to consider for wealth ranking
(2) Fish Marketing Append.qxd 8/8/03 6:01 pm Page 84

85
Appendix 5
The purpose of the exercise should be carefully explained to the participants.
The first thing to be established and drawn is the horizontal axis. This represents time and mustbe divided into the different seasons. In most rural societies, the seasons are not thought of ascalendar months, but have their own names. These should be used for the diagram, but if seasonsdiffer in length, then they should occupy roughly proportionate lengths on the horizontal axis.
The calendar should be drawn for more than one year, to ensure that the cyclical nature of eventsis correctly understood. Calendar months can be added after the calendar has been completedor after the horizontal axis is agreed.
Now the variables to be included can be placed on the calendar one by one. There are two mainways of representing variables. One is when only the timing is required, the other is when aquantitative estimate is made.
When only the timing is required, a horizontal line covering the relevant period is all that isrequired.
Quantitative measurement can be displayed in several ways. Continuous lines, histograms,scoring or vertical lines can be used for each season. However, quantities are always relative toone another rather than absolute and there is no scale on the vertical axis. It is often useful toask at what time of year the variable is most evident and at which times it is least and fill in therest of the calendar from that start.
It is important to remember that the seasonal calendar is a tool and not simply a product. Onceit is completed it should be used as the basis for discussion on the variables included within it.
Seasonal calendars are easy to record. Notes on the discussions associated with them shouldalso be made.
Box A10: Steps to consider for seasonal calendars
(2) Fish Marketing Append.qxd 8/8/03 6:01 pm Page 85

86
Appendix 5
Decide on objectives of survey.
Identify what data are exactly needed.
Decide on target population.
Determine techniques for obtaining an unbiased sample of the target population.
Decide the statistical measures to be used, and how the results should be presented.
Prepare data recording forms/questionnaires.
Test the questionnaires.
Identify and train enumerators.
Carry out the data collection exercise; supervision is important if enumerators are to collect thedata.
After the completion of fieldwork, check the questionnaires and code the responses.
Transfer the data to processing medium (i.e. computer).
Check for errors and validate data.
Carry out the actual analysis (e.g. calculation of measures, test of hypotheses).
Interpret and present the results.
Box A11: Steps to consider for quantitative surveys
(2) Fish Marketing Append.qxd 8/8/03 6:01 pm Page 86

A Guide to the Analysis ofFish Marketing Systems Usinga Combination of Sub-sectorAnalysis and the Sustainable
Livelihoods Approach
U. Kleih, P. Greenhalgh and N. Oudwater
The integration of wider development approaches in the fisheries sector is essential for the
sector to be fully involved in the development process. A Guide to the Analysis of Fish
Marketing Systems Using a Combination of Sub-sector Analysis and the Sustainable
Livelihoods Approach discusses the main elements to be considered when analysing a fish
marketing chain from a livelihoods perspective. This analysis uses both the Sustainable
Livelihoods Approach and sub-sector analysis and argues that this combination of
methodologies delivers the most reliable results.
Although the guide can be used for the analysis of any fish marketing chain in developing
countries, the focus is on the marine fisheries sector using two DFID-funded research
projects in India and Bangladesh as case studies. It is primarily aimed at researchers and
development practitioners investigating fisheries-based communities or sub-sectors with the
intention of preparing project interventions or policy recommendations.
POST-HARVEST FISHERIESRESEARCH PROGRAMME