1 emission: the birth of photons - wiley-vch · 1 emission: the birth of photons ... even the basis...
TRANSCRIPT

1 Emission: The Birth of Photons
This is the first of three foundation chapters supporting those that follow. The themes of theseinitial chapters are somewhat fancifully taken as the birth, death, and life of photons, or, moreprosaically, emission, absorption, and scattering.
In this chapter and succeeding ones you will encounter the phrase “as if”, which can beremarkably useful as a tranquilizer and peacemaker. For example, instead of taking the stancethat light is a wave (particle), then fiercely defending it, we can be less strident and simply saythat it is as if light is a wave (particle). This phrase is even the basis of an entire philosophypropounded by Hans Vaihinger. In discussing its origins he notes that “The Philosophy of‘As If’ . . . proves that consciously false conceptions and judgements are applied in all sci-ences; and . . . these scientific Fictions are to be distinguished from Hypotheses. The latterare assumptions which are probable, assumptions the truth of which can be proved by furtherexperience. They are therefore verifiable. Fictions are never verifiable, for they are hypotheseswhich are known to be false, but which are employed because of their utility.”
1.1 Wave and Particle Languages
We may discuss electromagnetic radiation using two languages: wave or particle (photon)language. As with all languages, we sometimes can express ideas more succinctly or clearly inthe one language than in the other. We use both, separately and sometimes together in the samebreath. We need fluency in both. Much ado has been made over this supposedly lamentableduality of electromagnetic radiation. But no law requires physical reality to be describedby a single language. We may hope for such a language, but Nature often is indifferent toour hopes. Moreover, we accept without protest or hand-wringing the duality of sound. Wedescribe sound waves in air as continuous while at the same time recognizing that air, andhence sound, is composed of discrete particles (molecules) in motion.
How do we choose which language to use? Simplicity. Life is short. To understand naturewe take the simplest approach consistent with accuracy. Although propagation of sound in aircould be described as the motions of molecules, had this approach been taken acoustics wouldhave floundered in a mathematical morass.
In the photon language a beam of radiation is looked upon as a stream of particles calledphotons with the peculiar property that they carry energy, linear momentum, and angularmomentum but not mass. The mass of the photon often is said to be identically zero. But giventhe near impossibility of measuring zero in the face of inevitable errors and uncertainties, itwould be more correct to say that the upper limit of the photon mass keeps decreasing, itspresent value being about 10−24 times the mass of the electron. If it bothers you that a particle
Fundamentals of Atmospheric Radiation: An Introduction with 400 Problems. Craig F. Bohren and Eugene E. Clothiaux
Copyright © 2006 Wiley-VCH Verlag GmbH & Co. KGaA, WeinheimISBN: 3-527-40503-8

2 1 Emission: The Birth of Photons
without mass can carry momentum this is because you are stuck on the notion that momentumis mass times velocity. Sometimes this is true (approximately), sometimes not. Momentum ismomentum, a property complete in itself and not always the product of mass and velocity.
Photons are of one kind, differing only in their energy and momenta, whereas waves areof unlimited variety and often exceedingly complex, the simplest kind a plane harmonic wavecharacterized by a single (circular) frequency ω and direction of propagation (see Secs. 3.3and 3.4). The dimensions of circular frequency are radians per unit time. You may be morefamiliar with just plain frequency, often denoted by ν (sometimes f ), which has the dimen-sions of cycles per unit time. The unit of frequency is the hertz, abbreviated Hz, one cycleper second. Because one cycle corresponds to 2π radians, the relation between frequency andcircular frequency is simple:
ω = 2πν. (1.1)
All electromagnetic waves propagate in free space (which does not strictly exist) with thesame speed c, about 3 × 10⁸ m s−1. A plane harmonic wave in free space can just as well becharacterized by its wavelength λ, related to its frequency by
λν = c. (1.2)
You sometimes hear it said that frequency is more fundamental than wavelength. In a sense,this is correct, but wavelength is often more useful. When we consider the interaction of elec-tromagnetic waves with chunks of matter, the first question we must ask ourselves is how largethe waves are. Big and small have no meaning until we specify a measuring stick. For elec-tromagnetic radiation the measuring stick is the wavelength. The mathematical expressionsdescribing the interaction of such radiation with matter can be quite different depending onthe size of the matter relative to the measuring stick.
How do we translate from wave to photon language? A plane harmonic wave with circularfrequency ω corresponds to a stream of photons, each with energy
E = hν = �ω, (1.3)
where h is Planck’s constant (6.625 × 10⁻³⁴ J s) and � = h/2π. The frequency of visibleelectromagnetic radiation (light) is about 1014 Hz, and hence the photons that excite the sen-sation of vision have energies around 10−20 J. This isn’t much energy; the kinetic energy of agolf ball as it slices through air is about 1013 times greater.
Understanding what happens when an electromagnetic wave is incident from air on thesmooth surface of glass, say, is not especially difficult if one uses the wave language. Theincident wave excites molecules in the glass to radiate secondary waves that combine to form(approximately) a net reflected wave given by the law of reflection and a net transmitted wavegiven by the law of refraction. There is no such thing as an absolutely smooth surface, so whatis meant is smooth on the scale of the wavelength.
All this makes intuitive sense and causes no perplexity. But now consider what happenswhen we switch to photon language. If we look upon reflection as the rebound of photons at asurface and transmission as their penetration through it, then why, if all photons are identical,are some reflected and some transmitted? This is indeed puzzling; even more so is why

1.1 Wave and Particle Languages 3
photons should be specularly (by which is meant mirror-like) reflected, because for photonsimagined as particles of vanishingly small dimensions, all surfaces are rough.
This is not to say that one couldn’t describe reflection and transmission at smooth inter-faces in photon language, only that to do so would be exceedingly costly in mental effort. Andthe reverse sometimes is true. Many years ago one of the authors attended a colloquium enti-tled “The photoelectric effect without photons.” By the photoelectric effect is usually meantthe emission of electrons by a surface (often metallic) because of illumination by radiation(often ultraviolet). In photon language the photoelectric effect is simple to describe. When aphoton of energy hν is absorbed by the surface, the maximum kinetic energy E of the elec-trons thereby set free is
E = hν − p, (1.4)
where p is the minimum energy an electron loses in breaking free of the surface. A singlephoton interacting with a single electron gives up its entire energy to that electron, which ifsufficient enables the electron to break free of the forces binding it to the metal. Accordingto this equation the energies of the emitted electrons are independent of the incident powerwhereas the photocurrent (rate and number of emitted electrons) is proportional to it, whichaccords with experiment. This simple equation, first written down by Einstein in 1905, isone of the keystones of the modern theory of radiation and matter. Yet the speaker at thatcolloquium years ago, in an effort to describe and explicate the photoelectric effect withoutphotons, assailed the audience with dozens of complicated equations. And even at that, partway through his mathematical tour de force his mind and tongue betrayed him and he blurtedout the forbidden word “photon”. At that point, your author who was there leapt up from hisseat and shouted, “Photons! Photons! You promised no photons.”
A mirror illuminated by an incident beam gives rise to a reflected beam. Is this reflectedbeam redirected incident photons? Alas, we cannot do an experiment to answer this question.To determine if reflected photons are the same as incident photons would require us to be ableto identify them. But photons are indistinguishable. We cannot tell one from another. Wecannot tag a photon and follow its progress. Thus if you want to believe that reflected photonsare the same as incident photons, you may do so. No one can prove you wrong. But you cannotprove you are right. When faced with an undecidable proposition, you may believe whateveryou wish. Note that in the wave language we would not likely even ask if the reflected waveis the same as the incident wave.
It is not often acknowledged that there is a third language for talking about light, whatmight be called the who-gives-a-hoot-what-light-is? language. This is geometrical or ray op-tics, in which the nature of light isn’t addressed at all. Fictitious rays are imagined to be pathsalong which the energy carried by light is transported, and these paths meander and bifurcateaccording to simple geometrical laws.
But which language is the more useful? In a letter to American Journal of Physics, M. Psi-mopoulos and T. Theocharis ask the rhetorical questions: “What new discoveries have (i)the particle or photon aspect of light, and (ii) the wave aspect of light, given rise to? Answer:(i) we are not aware of any; (ii) holography, laser, intensity interferometry, phase conjugation.”To this list we add radar, all of interferometry, on which much of the science of measurementis based, and interference filters, which have many applications. The view of these authors is

4 1 Emission: The Birth of Photons
extreme, but they also quote the more measured words of Charles Townes, a pioneer in masersand lasers: “Physicists were somewhat diverted by an emphasis in the world of physics on thephoton properties of light rather than its coherent aspects.” That is, the photon language hasbeen the more fashionable language among physicists, just as French was the fashionablelanguage in the Imperial Russian court. When prestigious and munificent prizes began to beawarded for flushing “ons” (electron, positron, neutron, meson, and so on) from the jungle,shooting them, and mounting their stuffed heads on laboratory walls, the hunt was on, andslowed down only with the demise of the Superconducting Supercollider.
Although the wave language undoubtedly has been and continues to be more fruitful ofinventions, the photon language is perhaps more soothing because photons can be incarnated,imagined to be objects we can kick or be kicked by. Waves extending through all spaceare not so easily incarnated. We can readily conceive of the photon as a thing. And yet anelectromagnetic wave is just as much a thing as a photon: both possess energy and momentum(linear and angular) but not, it seems, mass.
1.2 Radiation in Equilibrium with Matter
We often are told that when bodies are heated they radiate or that “hot” bodies radiate. Trueenough, but it is just as true that when bodies are cooled they radiate and that “cold” bodiesradiate. All matter – gaseous, liquid, or solid – at all temperatures emits radiation of allfrequencies at all times, although in varying amounts, possibly so small at some frequencies,for some materials, and at some temperatures as to be undetectable with today’s instruments(tomorrow’s, who knows?). Note that there is no hedging here: all means all. No exceptions.Never. Even at absolute zero? Setting aside that absolute zero is unattainable (and muchlower than temperatures in the depths of the Antarctic winter or in the coldest regions of theatmosphere), even at absolute zero radiation still would be associated with matter becauseof temperature fluctuations. Temperature is, after all, an average, and whenever there areaverages there are fluctuations about them.
Radiation emitted spontaneously, as distinguished from scattered radiation (see Ch. 3),is not stimulated by an external source of radiation. Scattered radiation from the walls ofthe room in which you read these words may be stimulated by emitted radiation from anincandescent lamp. Turn off the lamp and the visible scattered radiation vanishes, but the wallscontinue to emit invisible radiation as well as visible radiation too feeble to be perceptible.
We are interested in the spectral distribution of radiation – how much in each wavelengthinterval – emitted by matter. Consider first the simpler example of an ideal gas in a sealed con-tainer held at absolute temperature T (Fig. 1.1). When the gas is in equilibrium its moleculesare moving in all directions with equal probability, but all kinetic energies E are not equallyprobable. Even if all the molecules had the same energy when put into the container, theywould in time have different energies because they exchange energy in collisions with eachother and the container walls. A given molecule may experience a sequence of collisions inwhich it always gains kinetic energy, which would give it a much greater energy than average.But such a sequence is not likely, and so at any instant the fraction of molecules with kineticenergy much greater than the average is small. And similarly for the fraction of molecules withkinetic energy much less than the average. The distribution of kinetic energies is specified by

1.2 Radiation in Equilibrium with Matter 5
Figure 1.1: At equilibrium, ideal gas molecules in a closed container at absolute temperature T
have a distribution of kinetic energies (Fig. 1.2) determined solely by this temperature.
a probability distribution function f(E) which, like all distribution functions, is defined by itsintegral properties, that is,
∫ E2
E1
f(E) dE (1.5)
is the fraction of molecules having kinetic energies between any two energiesE1 andE2. Notethat f does not specify which molecules have energies in a given interval, only the fraction, orprobability, of molecular energies lying in this interval. If f is continuous and bounded thenfrom the mean value theorem of integral calculus
∫ E2
E1
f(E) dE = f(E)(E2 − E1), (1.6)
where E lies in the interval (E1, E2). If we denote E1 by E and E2 by E + ∆E we have
f(E) = lim∆E→0
1∆E
∫ E+∆E
E
f(x) dx. (1.7)
Because of Eq. (1.7) f(E) is sometimes called a probability density. When the limits ofthe integral in Eq. (1.5) are the same (interval of zero width) the probability is zero. Theprobability that a continuous variable has exactly a particular value at any point over theinterval on which it is defined is zero, as it must be, for if it were not the total probabilitywould be infinite.
A distribution function such as f(E) is sometimes defined by saying that f(E) dE is thefraction (of whatever) lying in the range between E and E + dE. This is sloppy mathematicsbecause althoughE represents a definite number dE does not. Moreover, this way of defininga distribution function obscures the fact that f is defined by its integral properties. As weshall see, failure to understand the nature of distribution functions can lead to confusion and
6 1 Emission: The Birth of Photons
error. It would be better to say that f(E) ∆E is approximately the fraction of molecules lyingbetween E and E + ∆E, where the approximation gets better the smaller the value of ∆E.
You also often encounter statements that f(E) is the fraction of molecules having energyE per unit energy interval. This can be confusing unless you recognize it as shorthand forsaying that f(E) must be multiplied by ∆E (or, better yet, integrated over this interval) toobtain the fraction of molecules in this interval. This kind of jargon is used for all kinds ofdistribution functions. We speak of quantities per unit area, per unit time, per unit frequency,etc., which is shorthand and not to be interpreted as meaning that the interval is one unit wide.
Gases within a sealed container held at constant temperature evolve to an equilibrium statedetermined solely by this temperature. In this state the distribution function for molecularkinetic energies is the Maxwell–Boltzmann distribution
f(E) =2√E√
π(kBT )3/2exp (−E/kBT ), (1.8)
where kB, usually called Boltzmann’s constant, is 1.38 × 10⁻²³ J K−1, and f is normalized
∫ ∞
0
f(E) dE = 1. (1.9)
The limits of integration are symbolic: molecules have neither infinite nor zero kinetic ener-gies; by zero is meant � kBT and by infinite is meant � kBT . Because of Eq. (1.9) f(E) isa probability distribution function.
The most probable kinetic energy Em is that for which f is a maximum, the energy atwhich its derivative with respect to E is zero:
Em = kBT/2. (1.10)
As the temperature of the gas increases so does the most probable kinetic energy of itsmolecules. Figure 1.2 shows f relative to its maximum as a function of E relative to Em,a universal curve independent of temperature.
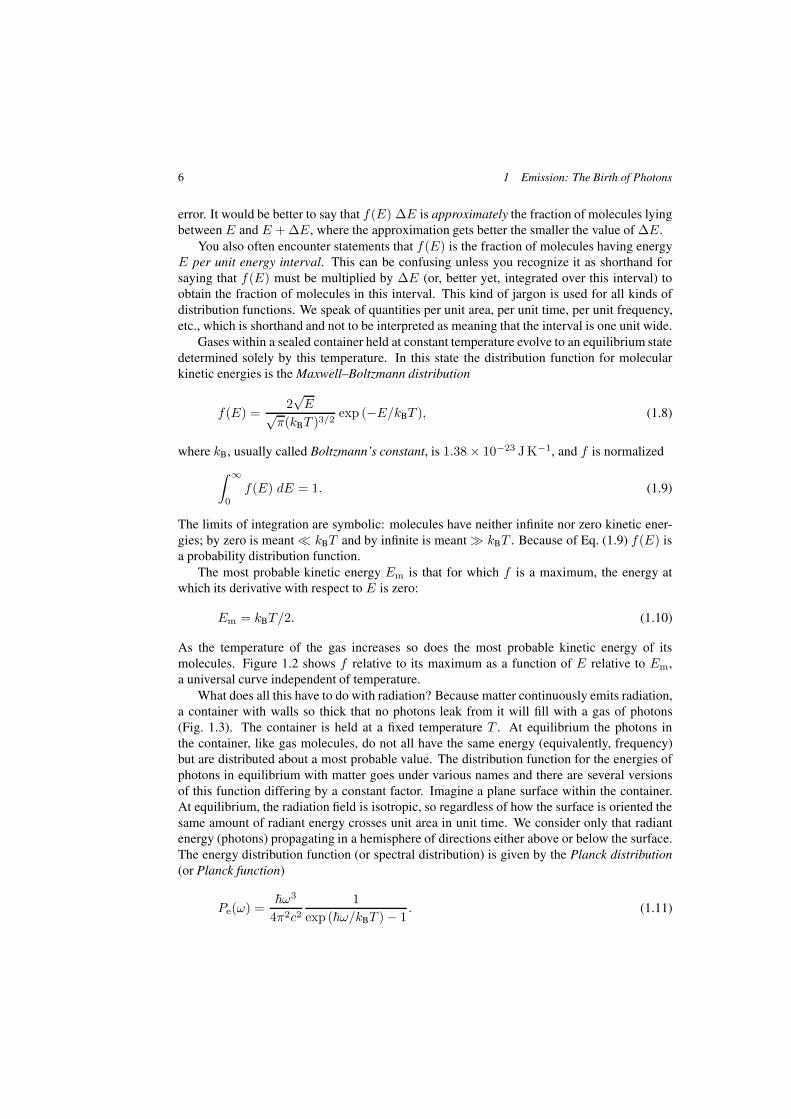
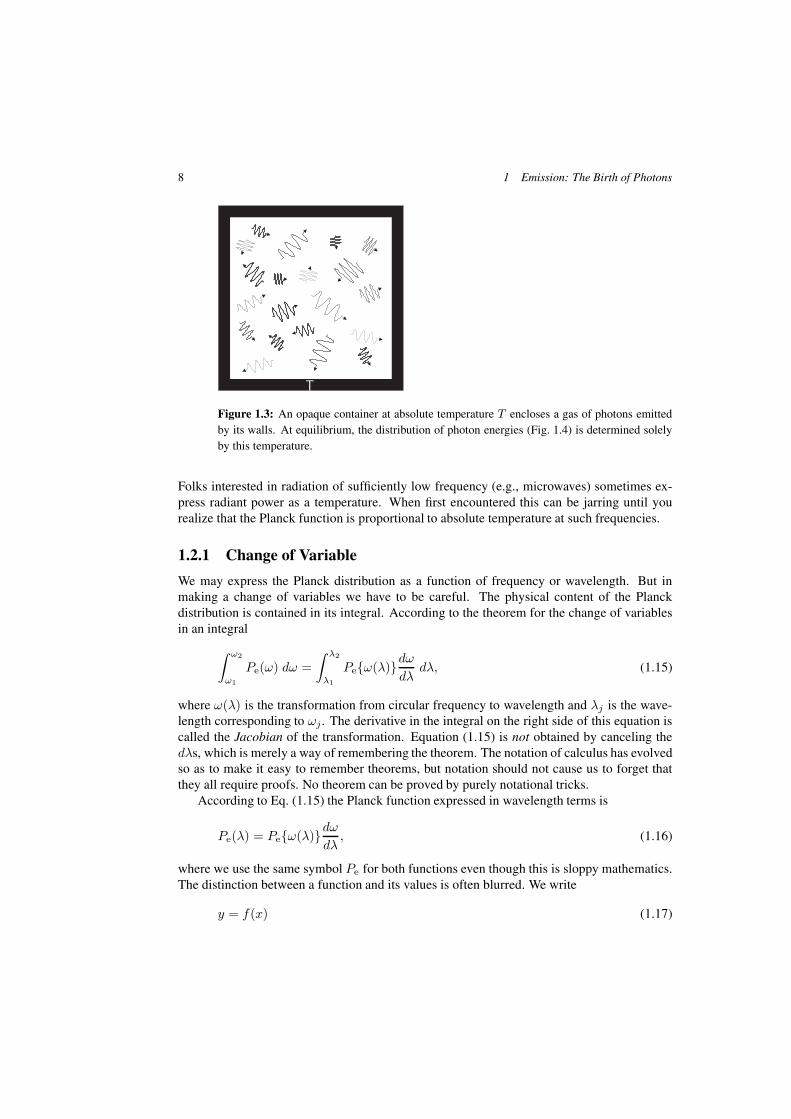
What does all this have to do with radiation? Because matter continuously emits radiation,a container with walls so thick that no photons leak from it will fill with a gas of photons(Fig. 1.3). The container is held at a fixed temperature T . At equilibrium the photons inthe container, like gas molecules, do not all have the same energy (equivalently, frequency)but are distributed about a most probable value. The distribution function for the energies ofphotons in equilibrium with matter goes under various names and there are several versionsof this function differing by a constant factor. Imagine a plane surface within the container.At equilibrium, the radiation field is isotropic, so regardless of how the surface is oriented thesame amount of radiant energy crosses unit area in unit time. We consider only that radiantenergy (photons) propagating in a hemisphere of directions either above or below the surface.The energy distribution function (or spectral distribution) is given by the Planck distribution(or Planck function)
Pe(ω) =�ω3
4π2c21
exp (�ω/kBT ) − 1. (1.11)

1.2 Radiation in Equilibrium with Matter 7
0 2 4 6 8 10 12 14 16Energy/Energy at Peak
0.0
0.2
0.4
0.6
0.8
1.0
Fra
ctio
n of
Pea
k
Figure 1.2: Distribution of kinetic energies of an ideal gas at equilibrium shown as a universalfunction independent of temperature. The kinetic energy relative to that at the peak of thedistribution function, however, does depend on temperature.
The integral of this function over any frequency interval is the total radiant energy in thatinterval crossing unit area in unit time, called the irradiance (discussed in more detail inSec. 4.2).
The Planck function is worthy of respect, if not awe, in that it contains not one, not two,but three fundamental (or at least believed to be so) constants of nature: the speed of lightin a vacuum c, Planck’s constant h, and Boltzmann’s constant kB. You can’t get much morefundamental than that.
The most probable photon energy is obtained by setting the derivative of Pe with respectto ω equal to zero; the result is the transcendental equation
3(ex − 1) = xex, (1.12)
where x = �ω/kBT , the solution to which (obtained quickly with a pocket calculator) isx = 2.819. Thus the most probable photon energy is
�ωm = 2.819kBT. (1.13)
Note the similarity of Eq. (1.11) to Eq. (1.8) and Eq. (1.13) to Eq. (1.10), which is not sur-prising given that both are distribution functions for gases, although of a different kind. Themost striking difference between a gas of molecules and a gas of photons is that the number ofmolecules in a sealed container is conserved (barring chemical reactions, of course) whereasthe number of photons is not. As the temperature of the container, which is the source of thephotons, increases, the number of photons within it increases. Photons are not subject to thesame conservation laws as gas molecules, which are endowed with mass.
At frequencies for which �ω � kBT Eq. (1.11) can be approximated by
Pe(ω) ≈ kBTω2
4π2c2. (1.14)
8 1 Emission: The Birth of Photons
Figure 1.3: An opaque container at absolute temperature T encloses a gas of photons emittedby its walls. At equilibrium, the distribution of photon energies (Fig. 1.4) is determined solelyby this temperature.
Folks interested in radiation of sufficiently low frequency (e.g., microwaves) sometimes ex-press radiant power as a temperature. When first encountered this can be jarring until yourealize that the Planck function is proportional to absolute temperature at such frequencies.
1.2.1 Change of Variable
We may express the Planck distribution as a function of frequency or wavelength. But inmaking a change of variables we have to be careful. The physical content of the Planckdistribution is contained in its integral. According to the theorem for the change of variablesin an integral
∫ ω2
ω1
Pe(ω) dω =∫ λ2
λ1
Pe{ω(λ)}dωdλ
dλ, (1.15)
where ω(λ) is the transformation from circular frequency to wavelength and λj is the wave-length corresponding to ωj . The derivative in the integral on the right side of this equation iscalled the Jacobian of the transformation. Equation (1.15) is not obtained by canceling thedλs, which is merely a way of remembering the theorem. The notation of calculus has evolvedso as to make it easy to remember theorems, but notation should not cause us to forget thatthey all require proofs. No theorem can be proved by purely notational tricks.
According to Eq. (1.15) the Planck function expressed in wavelength terms is
Pe(λ) = Pe{ω(λ)}dωdλ, (1.16)
where we use the same symbol Pe for both functions even though this is sloppy mathematics.The distinction between a function and its values is often blurred. We write
y = f(x) (1.17)

1.2 Radiation in Equilibrium with Matter 9
to indicate that y is the value the function f assigns to x. Suppose that f is the function“square it”: y = x2. If we transform from the variable x to x =
√u, we obtain the new
functional relation y = u. This is now a different function, and hence merits its own name(symbol). But to save having to invent more and more symbols, we are sloppy and writey = f(x) = f{x(u)} = f(u), when we should write y = f(x) = g(u). We often areeven sloppier by confusing the value of the function with the function itself. That is, we writey = y(x) = y{x(u)} = y(u). The fundamental rule of mathematical sloppiness is that youare allowed to be sloppy as long as you know how to do things correctly.
Although the Jacobian in Eq. (1.15)
dω
dλ= −2πc
λ2(1.18)
is negative, this does not mean that the radiant energy in the wavelength interval is negative.The upper limit on the right side of Eq. (1.15) is smaller than the lower limit, which by itselfwould make the integral negative, but the negative Jacobian makes the integral positive. Sowe write the Planck function as
Pe(λ) = Pe{ω(λ)}∣∣∣∣dωdλ
∣∣∣∣ = Pe{ω(λ)}2πcλ2
(1.19)
and remember to reverse the limits of integration on the right side of Eq. (1.15). The Planckfunction expressed in wavelength terms is therefore
Pe(λ) =2πhc2
λ5
1exp (hc/λkBT ) − 1
. (1.20)
For hc/λkBT � 1, Eq. (1.20) is approximately
Pe(λ) ≈ 2πckBT
λ4. (1.21)
At temperatures around 300 K this equation is a good approximation (within about 1% orless) for wavelengths greater than about 250 µm. As we show in Section 8.1 the spectrumof skylight is approximately proportional to 1/λ4. As temperature increases without limit,therefore, the Planck function at visible wavelengths has approximately the same spectraldependence as the blue sky. So much for the notion that an exceedingly hot body is “whitehot” or that blue is a “cold” color whereas red is a “warm” color.
The two forms of the Planck function presented here have the peculiar property that al-though the integral over any wavelength interval is equal to the integral over the correspondingfrequency interval, the two functions do not peak at the same place. That is, if we find thefrequency at which Pe(ω) is a maximum and transform that frequency into a wavelength, wedo not obtain the wavelength at which Pe(λ) is a maximum. To find this wavelength, differen-tiate Eq. (1.20) with respect to λ and set the result equal to zero. This yields the transcendentalequation
5(ex − 1) = xex, (1.22)

10 1 Emission: The Birth of Photons
0.01 0.1 1 10 100 1000Wavelength (µm)
10−110 0
10 1
10 2
10 3
10 4
10 5
10 6
10 7
10 810 9
Irra
dian
ce (
W m
−2 µ
m−
1 )6000 K300 K
Figure 1.4: Planck function for 6000 K and 300 K. The dashed curve is the irradiance at the topof the atmosphere from a 6000 K blackbody at the Earth–sun distance, which approximates thesolar irradiance.
where x = hc/λkBT , the solution to which is x = 4.961. From this we obtain Wien’sdisplacement law relating temperature to the wavelength λm at which Pe(λ) is a maximum:
λmT = 2902 µm K. (1.23)
For T = 273 K (0 ◦C), λm = 10.6 µm. Equation (1.23) is called a displacement law because itdetermines how the Planck function is displaced as temperature increases. This displacementis evident in Fig. 1.4, which shows Eq. (1.20) for two temperatures, 6000 K and 300 K. Notealso the huge difference in the amount of radiation emitted at these two temperatures.
But if we transform Eq. (1.13) into wavelength terms we obtain a different displacementlaw
λmT = 5107 µm K, (1.24)
where λm is the wavelength corresponding to the frequency ωm in Eq. (1.13). And this wave-length for 273 K is 18.7 µm, quite a shift from 10.6 µm. Which is correct? They both are. Nolaw requires Pe to be plotted versus wavelength. This may be the custom in some fields, butnot in others. Many spectroscopists plot spectra as a function of wavenumber (inverse wave-length, equivalent to frequency) and would consider doing otherwise an unnatural act. Thereis, in general, no invariant maximum for a distribution function. This may be unpalatable butit is a fact of life, in the nature of distribution functions. And yet this seems to be a difficultidea to get across. Once, after we had carefully discussed it in class, a student asked in allsincerity, “But where is the real maximum of the Planck function?” He thought we knew butwere withholding it from the uninitiated, a secret to be revealed only on our deathbeds.
Failure to recognize that the maximum of a distribution function depends on how it isplotted has led and no doubt will continue to lead to errors. In a delightful paper Bernard Soffer

1.2 Radiation in Equilibrium with Matter 11
0.0 0.5 1.0 1.5 2.0 2.5Wavelength (µm)
0
500
1000
1500
2000
2500
Irra
dian
ce (
W m
−2 µ
m−
1 )
4 3 2 1Wavenumber (104 cm−1)
0.00.2
0.4
0.6
0.8
1.0
Effi
cien
cy
0 10000 20000 30000 40000 50000 60000Wavenumber (cm−1)
0
200
400
600
800
1000
Irra
dian
ce (
10−
4 W m
−2 [c
m−
1 ]−1 )
2.0 1.0 0.5 0.25Wavelength (µm)
0.00.2
0.4
0.6
0.8
1.0
Effi
cien
cy
Figure 1.5: Luminous efficiency and Planck distribution at 6000 K (approximately the spectrumof solar radiation). The top figure shows the Planck distribution for wavelength as the indepen-dent variable; the bottom figure shows the Planck distribution for wavenumber (frequency).Note that although the peaks of the Planck distribution and luminous efficiency nearly coincidein the top figure, they are appreciably shifted in the bottom figure. These figures are similar toand were inspired by those presented by Soffer and Lynch (1999).
and David Lynch thoroughly demolish the widespread, but unsupportable, notion that thehuman eye is adapted to respond to the peak of the solar spectrum. If the luminous efficiencyof the human eye (Sec. 4.1.7), the relative degree to which radiant energy of each visiblewavelength is converted into the sensation of brightness, and the solar spectrum are plottedversus wavelength on the same figure, the peaks of the two curves roughly coincide. This is

12 1 Emission: The Birth of Photons
shown in Fig. 1.5, the Planck function for a temperature of 6000 K, which is a good enoughapproximation to the solar spectrum to make the point, together with the luminous efficiency.This accidental coincidence of peaks has led countless biologists and vision scientists to leapto the unwarranted conclusion that the eye is optimized at the wavelength of the peak of thesolar spectrum, a supposed triumph of evolution. We say “accidental” because if wavenumber(frequency) is taken as the independent variable (and why not?), the maxima of the two curvesdo not coincide, and by an appreciable amount. This is because the luminous efficiency isa point function, defined at each wavelength (or frequency), and hence its maximum doesn’tchange when the independent variable is changed from wavelength to frequency or anythingelse. But this is not true of the solar spectrum, which, like the Planck function, is a spectraldistribution function, its physical content specified by its integral. For its integral propertiesto be preserved, it has to change shape because equal frequency intervals do not correspond toequal wavelength intervals:
ω2 − ω1 = 2πc(λ1 − λ2
λ1λ2
). (1.25)
Soffer and Lynch give other examples of errors resulting from the failure to distinguish be-tween a point function and a distribution function. The moral of this story is that no reliableconclusions can be drawn, in general, from positions of the maxima of distribution functions.
1.2.2 Stefan–Boltzmann Law
The total radiant energy for the Planck function is obtained by integration over all frequencies:
∫ ∞
0
�ω3
4π2c21
exp (�ω/kBT ) − 1dω. (1.26)
Again, the limits of integration here are symbolic: no photon has zero or infinite energy. Bytransforming the variable of integration from ω to x = �ω/kBT this integral becomes
k4BT
4
4π2c2�3
∫ ∞
0
x3
exp (x) − 1dx = σT 4, (1.27)
where
σ =k4
B
4π2c2�3
∫ ∞
0
x3
exp (x) − 1dx = 5.669 × 10⁻⁸ W m−2 K−4. (1.28)
This fourth-power law for total (spectrally integrated) irradiance is called the Stefan–Boltzmann law and σ is called the Stefan–Boltzmann constant.
1.3 Blackbody Radiation
Radiation in equilibrium with matter, as specified by the Planck function, often is calledblackbody radiation. To understand the origins of this queer (as well as often confusing and

1.3 Blackbody Radiation 13
misleading) term requires postulating an idealized blackbody, which, like so many bodies inphysics, does not exist. A blackbody cannot be excited to radiate, more than it would in iso-lation, by an external source of radiation of any frequency, direction, or state of polarization.The definition of a blackbody as one that absorbs all radiation incident on it contains a trapfor the unwary. Notions about radiation being incident on bodies are valid only when they aremuch larger than the wavelength. We intuitively expect, based on our everyday experienceswith objects large compared with visible wavelengths, that the radiant energy absorbed byan illuminated object is determined by its geometrical area. This expectation breaks downwhen the body is small compared with the wavelength, a restriction almost never mentionedalthough Planck recognized it clearly. On page 2 of his Theory of Heat Radiation, he says thathe always assumes that the “linear dimensions of all parts of space considered, as well as theradii of curvature of all surfaces under consideration, are large compared with the wave lengthsof the rays considered.” The concept of radiation incident on a body is from geometrical (orray) optics, which is never strictly valid because all bodies are finite.
When one of the authors was interviewed many years ago for a position at Penn Statehe was asked if the emissivity (see following section) of a body can be greater than 1. Heresponded, “of course”, which may have saved a few lives (and possibly got him a job). Atthe time some meteorology graduate students were calculating emissivities of small particlesat infrared wavelengths, and to their horror and dismay were obtaining values greater than 1.These students were almost suicidal because they had been brainwashed that emissivities can-not be greater than 1. Not so. Supposed upper limits on emissivities hold (approximately)only for objects much larger than the wavelength. In order to determine “all the radiationincident on” a body, what is meant by “incident” has to be well defined, but it is not. Thereare always departures from geometrical optics, although for sufficiently large bodies thesedepartures may be negligible.
This seemingly heretical assertion about emissivities greater than 1, when cast in the lan-guage of antenna engineers, would be considered almost trivial. Any antenna engineer knowsthat the effective area of a receiver can be much larger than its geometrical area.
Although no strict blackbodies exist, some bodies are approximately black over a limitedrange of frequencies, directions, and polarization states of the exciting radiation.
Suppose that a hypothetical blackbody is placed inside an opaque cavity the walls of whichare held at constant temperature. This blackbody is bathed in equilibrium radiation, which isisotropic (the same in all directions) and unpolarized (see Sec. 7.1). The rate at which radiantenergy of all frequencies is absorbed by this blackbody is (subject to the restriction stated byPlanck)
A
∫ ∞
0
Pe(ω) dω, (1.29)
where A is the total surface area of the blackbody. Let Eb(ω) be the spectral emittance, thepower emitted per unit frequency in a hemisphere of directions per unit area of the blackbody;the total emittance is the integral of the spectral emittance. If the blackbody is in thermalequilibrium (its temperature does not change), the total rates of absorption and emission mustbe equal:∫ ∞
0
Pe(ω) dω =∫ ∞
0
Eb(ω) dω. (1.30)

14 1 Emission: The Birth of Photons
Because of this equation we might be tempted to set the integrands equal to each other:
Pe(ω) = Eb(ω). (1.31)
Although Eq. (1.31) is sufficient to ensure that the blackbody is in thermal equilibrium, itis not necessary unless supplemented by an additional physical argument. According to theprinciple of detailed balance, Eq. (1.31) is both necessary and sufficient for thermal equilib-rium. That is, at each frequency the rate of emission by the blackbody must be equal to therate of absorption. Underlying this principle is a fundamental symmetry property of naturecalled time-reversal symmetry: the equations of the electromagnetic field have the same formwhen time is run backwards. To make this clearer consider a simpler example, the equation ofmotion of a point mass m acted on by a force F at position x:
md2xdt2
= F. (1.32)
If F depends only on the position ofm, Eq. (1.32) is unchanged if we make the transformationt → −t, the consequence of which is that if m follows a path to a point where its velocity isv and then launched from this point with velocity −v, m will retrace its original path.
In the context of the problem of interest here, the principle of detailed balance (time-reversal symmetry) yields the result that absorption and emission are inverse processes. Thatis, if time were to reverse, absorbed photons would become emitted photons and vice versa.
According to Eq. (1.31) the emission spectrum of a blackbody at temperature T is thePlanck spectrum, the spectrum of radiation in equilibrium with matter. Hence such radiationis often called blackbody radiation even though its existence does not hinge on that of a black-body. Defining equilibrium radiation by something that doesn’t exist is unsatisfying and alsodeflects attention from its physical nature.
1.4 Absorptivity and Emissivity
Suppose that a real body is placed inside a cavity held at constant temperature. Such a bodyis uniformly illuminated by blackbody radiation. The spectral absorptivity α(ω) is defined asthat number which when multiplied by the irradiance Pe(ω) gives the rate of absorption perunit area of radiation per unit frequency by the body. Because blackbody (cavity) radiation isunpolarized and isotropic,α is the absorptivity for such radiation. Real bodies (large comparedwith the wavelength) are characterized by (dimensionless) absorptivities less than or equalto 1.
We define the spectral emissivity ε(ω) as that number which when multiplied by the Planckfunction gives the rate of emission by the real body in all hemispherical directions (again, perunit area and frequency). For the real body to be in thermal equilibrium inside the cavityrequires that total absorption be balanced by total emission:∫ ∞
0
α(ω)Pe(ω) dω =∫ ∞
0
ε(ω)Pe(ω) dω. (1.33)
Again, a sufficient condition for Eq. (1.33) to be satisfied is
α(ω) = ε(ω), (1.34)
1.4 Absorptivity and Emissivity 15
and by the principle of detailed balance is also a necessary condition. Thus the spectral emis-sivity is equal to the spectral absorptivity, which again points to absorption and emission asinverse processes.
Alas, this simple and unambiguous equation has been translated, unnecessarily, by sometextbook writers into a mantra, “a good absorber is a good emitter”, which is as useless asit is misleading. Whether something is good or bad cannot be determined until criteria forgoodness or badness are specified. Steam pipes in power plants are wrapped with aluminumsheeting, and insulation for houses is coated with aluminum foil. Metals such as aluminum,especially when highly polished, have low spectral emissivities over the range of frequenciesthat encompass most of the integrated Planck function at typical terrestrial temperatures. Toreduce the rate of radiative cooling of the contents of pipes (or of anything) they are wrappedwith a “bad” emitter, which is “good.” Do you wrap hot sandwiches with aluminum foil? Ifso, you are making use of the “good” properties of a “bad” emitter (low emissivity).
Equation (1.34) often is called Kirchhoff’s law, but is a restricted form of this law. Ingeneral, the absorptivity (and hence emissivity) of a body depends on the direction and state ofpolarization of the incident radiation as well as its frequency, caveats often omitted. We wouldnot have to worry about this if all bodies were always illuminated by blackbody radiation(unpolarized and isotropic). But alas, this is not true, and real bodies when removed fromcavities are illuminated by radiation that usually is not the same in all directions and may bepartially polarized (see Sec. 7.1).
1.4.1 Blackbody Radiation without a Blackbody
Blackbody radiation is radiation in equilibrium with matter. We discuss this by way of a con-tainer (cavity) at a fixed temperature. You sometimes find textbook treatments of blackbodyradiation in which it is stated (or implied) that the walls of the cavity must be black. This isnot true. All that is required for a cavity to be filled with blackbody radiation is that the cavitybe opaque and have a nonzero emissivity (and hence absorptivity) at all wavelengths. Thusif we fashion a cavity from a material that is neither black nor 100% reflecting at any wave-length, the radiation contained therein is still blackbody radiation. How can this be? How canblackbody radiation be obtained without a blackbody?
To answer this question, consider two opaque parallel plates, large compared with theirseparation (Fig. 1.6); the spectral emissivity of each plate is ε and both plates are at the sametemperature. We want to determine the amount of radiation that crosses unit area (between theplates and parallel to them) in all upward directions. For simplicity we ignore that ε strictlydepends on direction and polarization state.
The radiation between the plates is a consequence of radiation emitted and reflected (be-cause they are not necessarily black) by them. Because the plates are opaque (no transmissionby them) the reflectivity (fraction of incident radiation reflected) of a plate is 1 − α, whichfrom Kirchhoff’s law is 1 − ε.
Consider first the lower plate. An amount of radiation ε times the Planck function isemitted by this plate. We may omit this function because it is a common factor and simplysay that an amount of radiation (per unit frequency) ε is emitted upward by the lower plate. Afraction 1 − ε of this radiation is reflected downward by the upper plate, and then a fraction1− ε is reflected upward by the lower plate, which contributes to the upward radiation. Some

16 1 Emission: The Birth of Photons
Figure 1.6: The radiation field between two identical opaque plates with emissivity ε is a con-sequence of emission and reflection by them. The total upward radiation field can be expressedas the sum of upward emitted radiation, downward emitted radiation reflected once, three times,and so on, as well as upward emitted radiation reflected twice, four times, and so on.
of this radiation is reflected twice again to contribute further to the upward radiation, and soon ad infinitum. The total contribution of the lower plate to the upward radiation is thereforean infinite series
ε+ ε(1 − ε)2 + ε(1 − ε)4 + · · · (1.35)
which can be written
ε(1 + x+ x2 + · · · ), (1.36)
where x = (1 − ε)2. The series in parentheses pops up on so many diverse occasions that itssum is worth knowing.
Consider the finite sum
Sn = 1 + x+ x2 + · · · + xn. (1.37)
Multiply both sides of this equation by x and add 1 to the resulting equation:
xSn + 1 = Sn + xn+1 (1.38)
and hence
Sn =1 − xn+1
1 − x. (1.39)
The sum of the infinite series in Eq. (1.36) is the limit of Eq. (1.39) as n goes to infinity. If|x| < 1, the limit of xn+1 for infinite n is zero. With this restriction on x, the sum S of theinfinite series is
S = 1 + x+ x2 + · · · =1
1 − x. (1.40)

1.4 Absorptivity and Emissivity 17
With this result, the contribution to the upward radiation from emission by the lower plate andmultiple reflections between the two plates is
ε
1 − (1 − ε)2=
12 − ε
. (1.41)
But we are not finished. The upper plate contributes to the upward radiation indirectly by wayof multiple reflections. An amount of radiation ε is emitted downward by the upper plate, anda fraction 1 − ε is reflected upward by the lower plate, thereby contributing to the upwardradiation. A fraction of this radiation is reflected downward by the upper plate, then upwardby the lower plate. And so on ad infinitum. We obtain another infinite series
ε(1 − ε) + ε(1 − ε)3 + · · · (1.42)
the sum of which is
1 − ε
2 − ε. (1.43)
The total upward radiation is the sum of Eqs. (1.41) and (1.43):
12 − ε
+1 − ε
2 − ε= 1. (1.44)
Now multiply this by the Planck function to obtain the amount of radiation in the upwarddirection between the plates. As far as the radiation field is concerned, it is as if the emissivityof the lower (or upper) plate were 1. A cavity with walls that are not black neverthelessfills with blackbody radiation because of emission and multiple reflections. High reflectivitycompensates for low emissivity. The only condition we imposed on the cavity is that it beopaque at the frequencies of interest.
Before moving on to averages of emissivities and absorptivities we critically discuss theconcept of an average. The following section is applicable to many branches of science.
1.4.2 Averages: A Critical Look
One of the most misleading, if not outright dangerous, yet widespread concepts is that of theunqualified average of a set of values of some physical variable. Not only are there an infinitenumber of possible averages, not all of them, nor indeed any of them, may be of any usewhatsoever. Consider a set of values xj (j = 1, 2, . . . , N) of anything (temperature, pressure,height, weight, etc.). The arithmetic average (or arithmetic mean) of this set is defined as
〈x〉 =1N
N∑j=1
xj . (1.45)
This is one number that in some sense (a point we return to) represents the entire set of values.But a number that might be just as good at representing the set is the median, defined as thatvalue of x such that 50% of the values in the set lie above it and 50% below. And then there

18 1 Emission: The Birth of Photons
is the most probable value (or mode), defined as the value of x that occurs most frequently.So we already have before us three equally acceptable ways of characterizing a set of valuesby a single number. But we’ve hardly scratched the surface of the universe of averages. Thearithmetic average is an equally weighted average, and there is no reason why we cannotweight values differently depending on some expectation of their relative importance. That is,we form the average
N∑j=1
wjxj , (1.46)
where the weights satisfy
N∑j=1
wj = 1. (1.47)
For the arithmetic average, all the weights are 1/N . The weights wj could, but need not, beprobabilities of occurrence of the values xj . Because there is no end to weighting functions,there is no end to possible averages. But matters are even worse. A perfectly respectable (andsometimes useful) average is the root-mean-square average, the square root of
N∑j=1
wjx2j . (1.48)
But why stop at the square root of the average of squares? Why not take the nth root of
N∑j=1
wjxnj , (1.49)
where n can be any number, not just an integer? This is a perfectly good average in the sensethat it is one number that characterizes a distribution. We can go further still. Consider anyfunction f(x). Denote the inverse of this function as f−1, defined by
f−1{f(x)} = x. (1.50)
For example, the inverse of the square is the square root; the inverse of the exponential functionis the natural logarithm. Now we can generalize the two previous averages as
f−1{ N∑
j=1
wjf(xj)}. (1.51)
We can generalize this to a continuous distribution of values x:
f−1{∫
w(x)f(x) dx}, (1.52)

1.4 Absorptivity and Emissivity 19
where ∫w(x) dx = 1. (1.53)
The limits of integration (not shown) are whatever we choose them to be. Given the indefinitenumber of possible functions f and w, the number of possible averages is boundless. Implicitin Eq. (1.52) is the requirement that the inverse function f−1 be single-valued, which is nottrue for every function. All of these averages are different, in general, and all of them telldifferent stories, have different uses, or may be useless if not outright dangerous.
First consider a dangerous average. Shoe sizes are distributed over a population. Noteveryone wears the same size. Suppose that a shoe manufacturer were to determine the arith-metic average shoe size of a large pool of potential customers and then make shoes only ofthat size. A lot of customers would go barefoot. Indeed, depending on the distribution ofshoe sizes all customers might go without shoes. Suppose, for example, that the populationwere composed of two groups, those with big feet and those with little feet. The (arithmetic)average shoe size would therefore lie in the intermediate range, and shoes of this size wouldfit no one. The shoe manufacturer would have lots of unhappy customers and would soongo broke. Here is an example in which one number characterizing a distribution is less thanworthless. The shoe manufacturer needs to know the entire distribution of sizes, not just onenumber obtained from it.
If this example of shoe sizes seems far-fetched consider a region of the planet dominatedby marine boundary layer stratus and cirrus. The distribution of cloud-base heights would bepeaked around heights in the boundary layer and near the tropopause. The average of thesecloud-base heights would produce a mean value far from both peaks in the distribution ofheights.
Now let’s turn to an average that does have a meaning, although a limited one. Clouddroplets are distributed in size. As we show in Chapter 3 the total power scattered by a clouddroplet depends on its size. Here we can calculate (in principle) an average total scatteredpower per droplet. The weighting function is the droplet-size probability distribution. Thetotal power scattered by a fictitious cloud of droplets of identical size, all with the same partic-ular average total scattered power per droplet, is the same as that by a real cloud with dropletsdistributed in size, where the total number of droplets is the same in both clouds. All well andgood – but there’s a catch (there always is). What size should be associated with the identicaldroplets in the fictitious cloud? We assumed that there is one and only one average droplet sizethat gives rise to the average total scattered power per droplet even though this is not alwaystrue (see Fig. 3.11). This is not the only problem. Absorption by cloud droplets is, in general,a different function of droplet size than scattering by droplets. This means that if we base ourcalculations of average size on the dependence of absorption on size, we end up, in general,with a different average. And that’s not the end of our problems. The angular dependenceof scattering is yet another function of droplet size. Although we may be able to determineaverage sizes that separately have physical meaning for (total) scattered power, absorption,and angular scattering, each one of these averages is different, and thus the question, What isthe average size of a cloud droplet?, should be greeted with a horselaugh.
Global mean temperature is another example of a dubious concept and for more than onereason. As we have seen, infinitely many mean temperatures are possible, and each one is

20 1 Emission: The Birth of Photons
different. But more important, a single number for an entire planet cannot possibly capturethe consequences of temperature changes to human health, wealth, and happiness. As withshoe sizes, one needs the entire distribution, which in this context means everything related toweather: spatial and temporal distributions of temperature, rainfall amount and distribution intime and space, winds, duration, timing, and strength of storms – the list goes on and on. Ifyou live in Minneapolis and were to choose your clothing every day on the basis of the globalmean temperature you’d likely be uncomfortable most of the time (or possibly even perish).
1.4.3 Average Emissivity and Absorptivity
Kirchhoff’s law was derived for a body illuminated by equilibrium radiation. This naturallyleads to the question, Does this law still hold for arbitrary illumination? Although severalyears ago this question generated some controversy, it now seems safe to say that the dust hassettled and we should not hesitate to apply Kirchhoff’s law to bodies even when they are notilluminated by equilibrium (blackbody) radiation (see Sec. 2.8). But where we can get intotrouble is by misapplying Kirchhoff’s law to averages.
Total emission by a body at temperature T and with spectral emissivity ε(ω) is∫ε(ω)Pe(ω;T ) dω. (1.54)
We can’t do any damage to this integral by multiplying and dividing it by the same (nonzero)quantity, the integral of Pe, which from Eq. (1.27) is σT 4. Thus we may write Eq. (1.54) as
σT 4
∫ ∞
0
ε(ω)p(ω;T ) dω = 〈ε〉σT 4, (1.55)
where the (normalized) weighting function p is defined by
p(ω;T ) =Pe(ω;T )∫ ∞
0 Pe(ω;T ) dω(1.56)
and the average emissivity is
〈ε〉 =∫ ∞
0
ε(ω)p(ω;T ) dω. (1.57)
The spectral emissivity, like the weighting function, could depend on temperature.What about absorption? Total absorption by a body is the integrated product of its spectral
absorptivity and the spectral distribution of the illumination F (ω):∫ ∞
0
α(ω)F (ω) dω. (1.58)
We may define an average absorptivity by
〈α〉 =
∫ ∞0α(ω)F (ω) dω∫∞0F (ω) dω
, (1.59)

1.4 Absorptivity and Emissivity 21
but this average absorptivity is not, in general, equal to the average emissivity even thoughα = ε because the weighting functions for the two averages are, in general, different.
If we assume that the average emissivity Eq. (1.57) is equal to the average absorptivityEq. (1.59), we should do so knowing that this is not strictly true except for a body at temper-ature T illuminated by blackbody radiation for this temperature. Equality of the two averagesmay be a good approximation under some circumstances, such as if the spectral quantitiesare nearly independent of frequency over the range of frequencies for which the weightingfunctions have their greatest values.
1.4.4 Brightness and Color Temperature
Suppose we have an instrument that can measure radiant power over some range of frequen-cies anywhere in the electromagnetic spectrum. For simplicity we assume a narrow field ofview for the instrument, but this is not necessary. If we were to point the instrument in aparticular direction at a source of radiation, which could, but need not, be a measurably emit-ting body, the instrument would dutifully measure a radiant power. Now we can ask, Whattemperature must a blackbody have in order for the instrument reading to be the same? Thistemperature is called the brightness temperature of the source, not to be confused with the or-dinary (or thermodynamic) temperature. Even if the radiation measured is mostly or entirelyemitted (as opposed to reflected) by a body, its brightness temperature is not the same as itstemperature unless we happen to choose a frequency range over which the emissivity of thebody is almost 1.
To show that a brightness temperature always exists consider the integral of the Planckfunction Eq. (1.11) over any range of frequencies:
�
4π2c2
∫ ω2
ω1
ω3
exp (�ω/kBT )− 1dω. (1.60)
This integral approaches 0 as T → 0 and ∞ as T → ∞, and its derivative with respect to Tis always positive. Thus whatever our instrument reads, we can always find one and only onetemperature such that Eq. (1.60) matches it. But keep in mind that this temperature dependson the frequency interval and possibly the direction (unless the source is isotropic). And ifthe instrument is equipped with a polarizing filter, and we were to rotate it, the brightnesstemperature might change (unless the source is unpolarized.)
Although the concept of brightness temperature is not restricted, color temperature is.The color temperature of a source of (necessarily) visible radiation is the temperature of ablackbody with the same perceived color. As we show in Section 4.3, the gamut of colorsaccessible to the human observer can be represented as a set of points in a two-dimensionalspace, whereas the possible colors of blackbodies lie on a curve in this space. Thus blackbod-ies of all temperatures can match only a small sample of possible colors. Nevertheless, colortemperatures can be useful as long as we recognize their limitations. The color temperature ofaverage daylight (sunlight plus skylight) is around 6500 K; that of an ordinary incandescent(tungsten) lamp around 3000 K. Color temperatures of skylight are 10,000–40,000 K. Perhapsit is fortunate that we can’t touch the sky. If we could, we’d surely burn our fingers.
22 1 Emission: The Birth of Photons
1.4.5 A Few Comments on Terminology
No single term, not misleading or faintly ludicrous, for radiation emitted by matter at typicalterrestrial temperatures is adequate to distinguish it uniquely and unambiguously from solarradiation. Despite the title of Planck’s book (the German title of which may not have thesame connotations as its English translation), there is no such thing as “heat radiation” in thesense of a special kind of radiation emitted only by “heated bodies”. According to the Planckfunction, radiation is emitted by all bodies regardless of temperature, although to varyingdegrees at different frequencies. Yves Le Grand calls radiant heat a “meaningless term”, andadds, “to say that the sun, for instance, radiates heat is naïve”. Moreover, there is no specialrange of frequencies such that radiation within this range and only within it is capable ofraising the temperature of bodies that absorb it. A sufficiently intense source of radiationof almost any frequency can heat a body suitably chosen for its absorption properties at thatfrequency. For example, lasers at many different frequencies are commercially available forcutting and welding. And although the absorptivity of snow is close to 1 at wavelengthsbeyond a few micrometers (Fig. 5.16), a single crystal of ordinary salt is transparent fromvisible wavelengths far into the infrared (to around 60 µm). The heating power of a source ofradiation is not uniquely determined by its spectrum but depends as much on its magnitudeand the properties of what it illuminates.
Sometimes radiation from the sun is called shortwave radiation, whereas that from objectsat terrestrial temperatures is called longwave radiation. If everyone understands exactly whatis meant, no ambiguity arises, but these terms are inherently ambiguous because short andlong depend on an arbitrary boundary. The solar spectrum, for example, can be divided intothose wavelengths shorter than a certain wavelength and those longer.
If we call the radiation emitted by objects at typical terrestrial temperatures infrared radia-tion we face some problems. As we show in the following subsection, about half the radiationfrom the sun lies in the infrared (beyond the red). Moreover, the infrared is a spectral regionextending more than three decades, from about 0.7 µm to 1000 µm. Prefixing the qualifiersnear, middle, and far to infrared may not help because these terms mean different things to dif-ferent people. Most important, if we call terrestrial radiation infrared radiation we hobble ourthinking. Some people make their living measuring microwave radiation emitted by terres-trial objects, and other people make their living measuring microwave radiation from the sun.If we believed in the literal truth of assertions that terrestrial objects emit infrared radiationand that the solar spectrum peters out beyond 2.5 µm we would have to conclude that thesepeople are either charlatans or self-deluded. But they are neither. They simply have risen tothe never-ending challenge of measuring today what was not measurable yesterday.
The term terrestrial radiation can mislead people into thinking that this is radiation emit-ted only by solid bodies, ones that you can kick. And, believe it or not, we have stumbledupon conflicting assertions that only solids have emissivities or that only gases have them.
The term thermal radiation at least signifies that the emitted radiation is a consequencesolely of a body’s temperature, in contrast with, say, luminescence, which is more or lessindependent of temperature, or laser radiation, which has nothing fundamental to do withtemperature. But radiation from the sun has just as much right to be called thermal radiationas does radiation emitted by snow, soils, rocks, and cabbages.

1.4 Absorptivity and Emissivity 23
The only sure way to avoid confusion and error is to give the source and either a wave-length (or range of wavelengths) or some other clue that will leave no doubts as to what ismeant. A good example of ambiguity is the unqualified term infrared imagery, which couldmean imagery based on solar infrared radiation scattered by objects or on terrestrial infraredradiation emitted by them. Ambiguity vanishes when the source and wavelength are speci-fied. We call radiation originating from the sun solar radiation, that from the Earth terrestrialradiation, and give the appropriate wavelengths if necessary.
1.4.6 The Solar Spectrum
In preceding paragraphs we criticized the various terms used to distinguish radiation emittedby the sun from that emitted by objects at typical terrestrial temperatures. But there is nodisputing the existence of two distinct spectral regions, only what to call them. Figure 1.4shows the spectral irradiance of a 6000 K blackbody, with radius equal to that of the sun, atthe Earth–sun distance, which approximates the solar irradiance (see Fig. 1.7 and Prob. 1.27),together with that of a 300 K blackbody. There is little overlap between these two spectra. Adistinction must be made between the solar irradiance and the irradiance of the sun. At the topof Earth’s atmosphere, about 1369 W of solar radiant energy (all wavelengths) crosses eachsquare meter oriented with its normal toward the sun (strictly, this is an average because theEarth–sun distance varies slightly over a year). This quantity, denoted as S0, is now usuallycalled the solar irradiance, formerly the solar constant, an inappropriate name given the inter-est in and effort devoted to measuring its changes. The irradiance of the sun, however, is thatat the sun. Although the spectra of the two irradiances have the same shape, the magnitudeof the solar irradiance is uniformly lower than the irradiance of the sun by the square of theratio of the sun’s radius to the Earth–sun distance. Figure 1.4 also compares the (approximate)solar irradiance with the irradiance of a blackbody at a typical terrestrial temperature. Thesetwo spectral irradiances are well separated, whereas the (approximate) irradiance of the suntowers over that of the 300 K blackbody. Where the two curves intersect may be interpretedas the wavelength at which a photon is equally likely to be of solar as of terrestrial origin.
Solar radiation is not blackbody radiation because the sun is not enclosed in an opaquecontainer, but the solar spectrum does approximate that of a blackbody. A detailed solar spec-trum is shown in Fig. 1.7, on which the boundaries between ultraviolet, visible, and infraredare marked. About 51% of the solar irradiance lies in the infrared, 42% in the visible, and 7%in the ultraviolet. These numbers, easy to remember, are not exact if for no other reason thanthat the boundaries between these regions are somewhat arbitrary.
1.4.7 Imaging and Spectral Dependence of Contrast
A good rule of thumb is that most terrestrial objects (e.g., snow, soil, water, vegetation) areapproximately black (have spectral emissivities near 1) over the range of frequencies that en-compass much of the Planck function for typical terrestrial temperatures. Because of this, thebrightness temperature (for infrared frequencies) of terrestrial objects is a good approximationto their thermodynamic temperature. This provides a means for determining temperatures re-motely: measure the amount of radiation (in some frequency interval) emitted by an objectand convert this radiation into a temperature by way of the Planck function. We can do even

24 1 Emission: The Birth of Photons
0.0 0.5 1.0 1.5 2.0 2.5Wavelength (µm)
0
500
1000
1500
2000
2500S
olar
Irra
dian
ce (
W m
−2 µ
m−
1 )UV VIS IR
Figure 1.7: Solar spectrum (after Kurucz and Clough).
more. Temperature differences give rise to contrast, which allows for the possibility of imag-ing radiation we cannot see but that an instrument can.
The image of any object is a one-to-one transformation: every point on the object corre-sponds to one and only one point on the image. This transformation is the function of lensesin cameras, in slide projectors, and in your eyes. Remove the lens from a camera and lightfrom objects still illuminates the film, but a single point on the film receives light from manyobject points. Remove the lens from a slide projector and it still projects light, but no image,onto a screen. A pinhole is the simplest kind of imaging device. One and only one line can bedrawn from any point on an object, through the pinhole, to an image point.
Our eyes are imaging devices that respond to different amounts of radiation coming fromdifferent directions. We can get about in the world because of these (relative) differences,which is called contrast. A whiteout is the absence of contrast. You can experience whiteoutsin blizzards or while descending through thick clouds in an airplane (see Sec. 5.2). If you haveever been in a whiteout you know that it can be frightening. You can’t tell up from down, rightfrom left. You are lost in a field of radiation the same in all directions.
Our eyes form images using visible radiation, the (indirect) source of which is the sun orlamps. That is, we usually image scattered light (we rarely look directly at the sun or at lightbulbs). But imaging devices are not restricted to visible frequencies. The radiation emittedby terrestrial objects at different temperatures provides contrast between them, the greater thetemperature difference, the greater the contrast. All imaging devices have a contrast thresholdbelow which they cannot distinguish one object from an adjacent one.
Several years ago we got a telephone call from a very frustrated scientist. While poringover infrared images of sea ice he had noticed that the contrast was better in images at shorterwavelengths. He wanted to know why. So he called remote sensing experts and asked them.They all agreed that contrast was indeed better at the shorter infrared wavelengths. But thatwasn’t his question. He wanted to know why, but ran into a blank wall. No one disagreed withhis observation but no one could explain it. And the more incomprehension he encountered,

1.4 Absorptivity and Emissivity 25
Figure 1.8: Two adjacent objects at different temperatures can be distinguished one from theother if the relative difference in the radiation emitted by them is sufficiently large. This contrastdepends on the relative temperature difference ∆T/T and the chosen frequency of the radiation.
the more frustrated he became. The following is our answer to his question, which is a sim-ple application of the Planck function and also illustrates the importance of beginning withfundamentals when faced with a problem.
Suppose that we have two objects, side by side, at different temperatures T and T + ∆T(Fig. 1.8). We may define the contrast between these two objects (assumed to be nearly blackover the frequency range of interest) as
Pe(T + ∆T ) − Pe(T )Pe(T )
. (1.61)
The first term in the numerator can be expanded in a Taylor series and truncated to yield anapproximation for the contrast:
1Pe
∂Pe
∂T∆T ≈ ∆T
T
x
1 − e−x, (1.62)
where x = �ω/kBT . Not surprisingly, the contrast between the two objects depends on theirrelative temperature difference, but also on frequency by way of the quantity x. The contrastenhancement
x
1 − e−x(1.63)
is approximately 1 for small x and increases approximately linearly with increasing x. Thus,all else being equal (always an important caveat), greater contrast is obtained for higher fre-quencies (shorter wavelengths). At typical terrestrial temperatures (∼300 K) x � 1 at wave-lengths in the range 4−40 µm and so the contrast is approximately
∆TT
(�ω
kBT
)=
∆TT
( hc
λkBT
). (1.64)
If inherent contrast were the only criterion for choosing one infrared frequency over another,the highest possible frequency would be the best choice. Of course, at sufficiently high fre-quencies there might not be enough emitted radiation to image.

26 1 Emission: The Birth of Photons
1.5 Emission by Clouds
All else being equal, we expect lower air temperatures on mornings after clear nights thanafter cloudy nights. The correct explanation of this fairly common observation, however, isnot widely known. What is widespread is an incorrect explanation: radiation emitted by theground is reflected by clouds. Do clouds reflect radiation? Of course they do. Any fool cansee that clouds are bright. And so they may be – at visible wavelengths, which is all thatany fool can see. But because we cannot see the kind of radiation emitted by the ground attypical temperatures, we are on thin ice extrapolating from visible to infrared wavelengths.Metals (clean) such as silver and aluminum are highly reflecting at visible wavelengths. Asit happens, these metals are just as highly reflecting at infrared, microwave, and even radiowavelengths. But what is true for silver and aluminum is not true for clouds. Although thickclouds may have high reflectivities for visible solar radiation, these same clouds are nearlyblack at the infrared wavelengths of radiation emitted by the ground (see Fig. 5.15). Oureyes deceive us about clouds. And not only clouds. For example, black and white (to oureyes) paints have nearly identical emissivities, as does black and white skin, over the Planckspectrum at typical terrestrial temperatures.
Suppose that some of the water vapor in clear air condenses into a cloud of water droplets;the total amount of water substance does not change. Suppose also that the temperature (as-sumed uniform) is the same for the clear as for the cloudy air. What has changed radiatively?
On a partly cloudy spring day we pointed an infrared thermometer at a patch of clear over-head sky. Although the air temperature measured with an ordinary thermometer was 20 ◦C,the temperature recorded by the infrared thermometer was a frigid −50 ◦C, not even close toair temperature. This is because an infrared thermometer measures brightness temperatures,which are lower or at most equal to terrestrial thermodynamic temperatures. When we shiftedthe thermometer’s field of view from clear sky to an adjacent patch of cloudy sky the bright-ness temperature shot up to −3 ◦C. It is not plausible that two adjacent patches of sky differedin temperature by 47 ◦C, so the only possible explanation is that the emissivities of the twopatches were different given that the reflectivity of clouds (Fig. 5.15) and air for terrestrial ra-diation is small. We have done this simple but dramatic experiment many times, always withthe same result: clear sky is always radiatively much colder than adjacent cloudy sky. Thisdifference lies mostly in the markedly different spectral emissivities of water vapor and ofliquid water. Later that same day, after sundown, as clouds thickened, the overhead brightnesstemperature had increased to 2–3 ◦C even though air temperatures had dropped.
On a summer day with broken clouds we pointed an infrared thermometer at the zenith andmeasured the changing brightness temperature (Fig. 1.9); the state of the sky when the mea-surements were taken is shown in Fig. 1.10. As clouds flitted in and out of the thermometer’sfield of view, the brightness temperature fluctuated by about 40 ◦C. One of the greguerías ofRamón Gómez de la Serna is a charming way of looking at broken clouds: “La curiosidaddel cielo por ver la tierra abre muchas veces el nublado” (The sky’s curiosity to see the earthoften opens clouds).
To further support the hypothesis that the difference between clear and cloudy skies lies intheir emissivities, consider Figure 1.11. This figure shows the (calculated) normal emissivityover a range of infrared wavelengths (about 12–16 µm) of a uniform layer of moist air at atotal pressure of 1 atmosphere, temperature 20 ◦C, and 1 cm of precipitable water. Normal

1.5 Emission by Clouds 27
2:35 2:40 2:45 2:50 2:55 3:00 3:05 3:10 3:15Time (EDT)
240
250
260
270
280
290
300
Brig
htne
ss T
empe
ratu
re (
K)
Figure 1.9: Brightness temperature of the zenith sky on a summer day with broken clouds.Measurements were made with the radiation thermometer pointed vertically. See Fig. 1.10 foran all-sky photograph of the cloud cover.
Figure 1.10: All-sky photograph of a partly cloudy sky on a summer day in State College,Pennsylvania. A time-series of the brightness temperatures of the zenith sky is shown in Fig. 1.9.

28 1 Emission: The Birth of Photons
0.0
0.2
0.4
0.6
0.8
1.0
Nor
mal
Em
issi
vity
12 13 14 15 16Wavelength (µm)
625675725775825Wavenumber (cm−1)
Figure 1.11: Normal emissivity of a uniform layer of moist air at 20 ◦C, total pressure of1 atmosphere, and 1 cm of precipitable water. To resolve details only a fairly narrow range ofwavelengths is shown; the emissivity spectrum is similar over the entire infrared spectrum.
0.90
0.92
0.94
0.96
0.98
1.00
Nor
mal
Em
issi
vity
4 8 12 16 20 24Wavelength (µm)
2500 1250 825 625 500 425Wavenumber (cm−1)
Figure 1.12: Normal emissivity of a layer of pure water sufficiently thick that very little incidentradiation is transmitted by it.
emissivity is that in the direction perpendicular to the layer (remember, emissivity, in general,depends on direction). Precipitable water of 1 cm means that if all the water vapor werecondensed the result would be a layer of liquid water 1 cm thick. The spectral emissivity ofwater vapor is a series of sharp peaks and deep valleys as a consequence of the absorption

1.5 Emission by Clouds 29
0 10 20 30 40 50 60 70 80 90Angle of Incidence (Degrees)
0.00.10.20.30.40.50.60.70.80.91.0
Reflectivity
Emissivity
Figure 1.13: Reflectivity for incident unpolarized radiation (λ = 10 µm) and the correspondingemissivity for pure water.
lines of water vapor (see Secs. 2.6 and 2.7), narrow spectral regions over which absorption ishigh. At many wavelengths, the emissivity is close to 1, but at just as many other wavelengthsit is smaller, and total emission depends on the average emissivity [see Eqs. (1.55) and (1.57)].Contrast the normal emissivity of water vapor with that of liquid water for a layer sufficientlythick (less than a millimeter) that transmission by it is negligible (Fig. 1.12). This emissivity isa more or less smooth function of wavelength and departs only slightly from 1 over the range4–24 µm. You don’t have to do any calculations to recognize that the average emissivity of theliquid water layer is higher than that of the water vapor. And the emissivity of a thick cloudof water droplets is essentially the same as that of a liquid water layer (see Prob. 2.11). Therate of nocturnal cooling of the ground depends on the difference between its rate of emissionand the rate at which it absorbs radiation emitted downward from the sky. The lower this netradiation, all else being equal, the greater the cooling rate. Because emission by clouds, allelse being equal, is greater than emission by clear sky, radiative cooling is greater on cloudlessnights.
1.5.1 Directional Emissivity
Emissivity depends on the direction of emission (see Sec. 1.4), which is why we qualifiedthe emissivities of interest in the preceding discussion as normal emissivities. For an opaquebody, the absorptivity for radiation in a particular direction is 1 minus the reflectivity, whichby Kirchhoff’s law is the emissivity. Because reflectivity depends on direction, so does emis-sivity. Figure 1.13 shows reflectivity of pure water versus angle of incidence for unpolarizedincident radiation (λ = 10 µm) and the corresponding emissivity calculated using the Fresnelcoefficients (Sec. 7.2). At this wavelength, a layer of water only a few millimeters thick isopaque. If emissivity depends on direction, so must brightness temperature.

30 1 Emission: The Birth of Photons
The brightness temperature Tb in a direction ϑ is defined by∫ε(ω, ϑ)Pe(ω, T ) dω +
∫{1 − ε(ω, ϑ)}Pe(ω, Ts) dω =
∫Pe(ω, Tb) dω, (1.65)
where the range of integration is determined by the instrument, ε(ω, ϑ) is the spectral emis-sivity in the direction ϑ, T is the (thermodynamic) temperature, and Ts is the brightness tem-perature of the sky (which also depends on direction; see Sec. 2.2). The first integral on theleft side of Eq. (1.65) is emission; the second integral is reflection of radiation from the sky.As evidenced by the weak dependence of the (normal) emissivity of water on frequency over awide range (Fig. 1.12), we can ignore the frequency dependence of the directional emissivityin Eq. (1.65). Because our infrared thermometer responds to a narrow range (about 2 µm) ofwavelengths around 10 µm, we can approximate Eq. (1.65) by
ε(ϑ)Pe(ω, T ) ≈ Pe(ω, Tb), (1.66)
where the frequency corresponds to 10 µm. We also assume that reflection is negligible com-pared with emission, which is not true for near-glancing angles. At this wavelength, and forT around 300 K, the exponential term in the Planck function Eq. (1.11) is much greater than1, and hence we can approximate Eq. (1.66) by
ε exp (�ω/kBTb) ≈ exp (�ω/kBT ) (1.67)
Take the natural logarithm of both sides and rearrange terms to obtain
�ω
kBTb≈ �ω
kBT− ln ε. (1.68)
If we write Tb = T−∆T and assume that ∆T/T � 1, we can further approximate Eq. (1.68)as
T − Tb
T≈ −kBT
�ωln ε. (1.69)
Thus we predict that at a fixed temperature T , the relative difference between thermodynamictemperature T and brightness temperature Tb for any direction is a linear function of thenegative of the natural log of the emissivity in that direction.
To verify the correctness of Eq. (1.69) we measured the brightness temperature of waterin a 30 cm × 40 cm pan about 2 cm deep at four elevation angles (60◦, 40◦, 25◦, and 16◦).Because an infrared thermometer cannot distinguish emitted from reflected radiation, the wa-ter was heated to maximize emission, and measurements were made on a cool, clear day tominimize incident radiation from the sky. The emissivity was obtained from Fig. 1.13. InEq. (1.69) T is the temperature of the surface of the water, which, because of evaporativecooling, is not what one measures by immersing an ordinary thermometer into the water. Asa good estimate for T we used the (average) brightness temperature at 60◦; the emissivityis close to 1 for this direction (Fig. 1.13). Emission from the overhead sky corresponded toa brightness temperature less than about 218 K on the day measurements were made (seeSec. 2.2 for more on the variation of brightness temperature of the sky with direction). The

1.6 Emissivity and Global Warming 31
−0.01
0.00
0.01
0.02
0.03
0.04
Rel
ativ
e T
empe
ratu
re D
iffer
ence
0.00 0.04 0.08 0.12 0.16−ln(Emissivity)
60 40 25 16Elevation Angle (Degrees)
Figure 1.14: Measured differences between thermodynamic temperature and brightness tem-perature relative to thermodynamic temperature for pure water at four elevation angles with sixmeasurements per angle. The straight line is a linear least-squares fit to the measurements. Thechi-square goodness-of-fit statistic is 0.00065 implying a correlation coefficient r2 of 0.83.
reflectivity of water for radiation from the overhead sky is small (∼ 0.01). We made six setsof measurements for the four directions. The average surface temperature of the water wasabout 338 K, for which the slope in Eq. (1.68) is about 0.22. Figure 1.14 shows a least-squaresfit to all the measurements, with slope 0.22, in agreement with the predicted slope even givenall the approximations underlying it and the difficulty of making the measurements.
We have more to say about directional emissivity in Section 2.2.
1.6 Emissivity and Global Warming
One cannot open a newspaper or magazine these days without encountering warnings aboutimpending global warming because of the ill-named greenhouse effect. As a consequence ofthis extraordinary publicity, explanations of the greenhouse effect have been designed morewith journalists and politicians in mind than scientists. Even those who publish more fre-quently in scientific journals than in the popular press either assert that the greenhouse effectis the result of “closing the atmospheric window”, thereby “trapping” radiation, or that it isthe result of increased emission from the atmosphere. When adherents to both explanationsclash, the result is indeed warming, although local rather than global.
If we set aside criticism of the term greenhouse effect (the function of greenhouses isprimarily to suppress convection by enclosing a space heated by solar radiation), we are stillleft with the task of trying to square two apparently irreconcilable physical explanations.
To do so we turn to a simple example of radiative equilibrium, that for a system consistingof two uniform slabs, one above the other (Fig. 1.15). The absolute temperature of the top slab

32 1 Emission: The Birth of Photons
Figure 1.15: Radiative equilibrium between two uniform slabs, infinite in lateral extent. The topslab is transparent to incident shortwave radiation, whereas both slabs emit and absorb longwaveradiation. The bottom slab is black to longwave radiation.
is Ta; that of the bottom slab is Te. The absorptivity of the top slab averaged over the spectrumof the radiation emitted by the bottom slab (assumed to be a blackbody) is α. We assume thatthe emissivity ε of the top slab (averaged over its emission spectrum) is equal to α, which isnot strictly true unless the two temperatures are equal or the emissivity and absorptivity areindependent of frequency. We also assume that the top slab does not reflect radiation from thebottom slab, and hence the transmissivity τ (fraction of incident radiation transmitted) of thetop slab is 1 − α = 1 − ε. The top slab is transparent to radiation from a source outside thesystem illuminating it from above, where S is the net irradiance (net radiant energy crossingunit area in unit time) of the source. The source spectrum hardly overlaps the emission spectraof the slabs.
Consider first the two slabs taken as a single system. If it is in radiative equilibrium, thenet radiant energy input to it must be balanced by the radiation emitted by the bottom slab andtransmitted by the top slab plus the radiation emitted by the top slab:
S = σT 4e (1 − ε) + εσT 4
a . (1.70)
A radiative energy balance applied to the top slab yields
2εσT 4a = ασT 4
e = εσT 4e . (1.71)
The term on the left is total emission by the top slab, which emits both upward and downward(hence the factor 2); the term on the right is absorption by the top slab of radiation emitted bythe bottom slab.

1.6 Emissivity and Global Warming 33
We can solve these two equations to obtain
T 4e =
S
σ(1 − ε/2)(1.72)
for the radiative equilibrium temperature of the bottom slab. There are no other modes ofenergy transfer; the slabs are suspended in a vacuum.
Because of the assumption α = ε = 1 − τ , we can rewrite Eq. (1.72) as
T 4e =
2Sσ(1 + τ)
. (1.73)
Note that the temperature of the slabs is a consequence of an external source, but for fixed Sthe equilibrium temperature depends on the radiative properties (ε or, equivalently, τ ) of thetop slab.
What does this all have to do with the atmosphere, specifically global warming? Takethe top slab to represent the atmosphere, the bottom slab to represent the ground. The totalamount of solar radiant energy intercepted by Earth is S0πR
2e , where Re is its radius. The
total surface area, however, is 4πR2e , and so the solar irradiance spread uniformly over the
entire globe is (1369/4)Wm−2. But a fraction of this radiant energy is reflected, as evidentfrom satellite photos, which (at visible wavelengths) show a mostly dark Earth (the oceans)brightened here and there by clouds. An estimate for the total fraction of reflected solarradiation, the planetary albedo a, is 0.30 (30%). This yields a net solar irradiance S = S0(1−a)/4 = 240 Wm−2 (albedo is more or less synonymous with reflectivity, although albedo isusually applied to radiation reflected in a hemisphere of directions whereas reflectivity mayapply to radiation reflected in a particular direction or in a hemisphere of directions). This isthe net solar radiant energy input to Earth spread out evenly over the entire planet. If we takethis value for S in Eq. (1.72) we obtain different temperatures Te depending on ε. For ε = 1,Te = 303 K (30 ◦C), whereas for ε = 0, Te = 255 K (−18 ◦C). These temperatures are atleast in line with typical air temperatures near Earth’s surface, neither ridiculously higher norlower.
Although nitrogen and oxygen are the numerically dominant atmospheric gases, they arenot radiatively dominant. The contribution to the emissivity (over the Planck spectrum fortypical terrestrial temperatures) of Earth’s atmosphere is mostly from comparatively smallamounts of certain infrared-active gases (see Ch. 2), water vapor being by far the most abun-dant, although still less than about 1% of the atmosphere. Carbon dioxide is another infrared-active gas, with an abundance of around 360 ppm. This gas would be present in the atmosphereeven if Earth were devoid of human inhabitants, but has been increasing since the beginningof the Industrial Revolution, presumably because of increased burning of fossil fuels.
The emissivity of the present atmosphere is, say, 0.8, which if substituted in Eq. (1.72)with S = 240 Wm−2 yields Te = 289 K (16◦C). We note that this is not the global aver-age temperature. In the first place, there is no such thing as the average temperature (or theaverage anything) but rather infinitely many possible averages depending on the function oftemperature averaged and how it is weighted. And what exactly does Te correspond to? Is itthe temperature of the ground? If so, this is not the air temperature, which varies with height,especially near the ground. All we can say for certain is that Te = 289 K is the radiative equi-librium temperature of a slab that absorbs about 240 Wm−2 of radiant energy, above which

34 1 Emission: The Birth of Photons
is another slab with ε = 0.8 but which does not absorb any solar radiation. In addition, thelower slab is black to the radiation emitted by the upper slab, and radiation is the only form ofenergy transfer (this is what is meant by radiative equilibrium).
It would be a bit of a stretch to say that the simple system consisting of two slabs shownin Fig. 1.15 is a model of the atmosphere. It is at best an analogue, useful for helping usunderstand some basic physics, possibly to frame testable hypotheses, even to estimate rela-tive changes if used judiciously. For example, if ε of the atmosphere is increasing becauseof increased amounts of infrared-active gases, this suggests that temperatures in the loweratmosphere could increase.
Equation (1.73) is the basis for interpreting global warming as the result of “closing thewindow”. As the transmissivity of the (analogue) atmosphere decreases, the radiative equilib-rium temperature Te increases. Equation (1.72) is the basis for interpreting global warming asthe result of increased emission. As the emissivity increases, so does the radiative equilibriumtemperature. Which interpretation is correct? One interpretation cannot be right and the otherwrong if they are based on the same theory. The two interpretations are merely two differentways of saying the same thing.
Although one interpretation cannot be right and the other wrong, one may be less mis-leading, more felicitous than the other. We prefer the increased emission interpretation for afew reasons. According to this interpretation we are warmed at the surface of Earth by twosources of radiation: the sun and the atmosphere. With this interpretation the atmosphere isactually doing something (emitting) whereas according to the other interpretation it only pre-vents something from happening. Moreover, the notion that the atmosphere traps radiation isat best a bad metaphor, at worst downright silly. In the emission interpretation the atmosphereis a source of radiation, not a photon trap that corrals wayward photons and sends them backto Earth just as a truant officer returns wayward children to school. A truant officer can returnchildren to school because they are distinguishable, whereas photons are not. If this doesn’tbother you, what about the fact that the spectrum of the radiation emitted by the ground tothe atmosphere is not the same as the spectrum of radiation emitted to the ground by theatmosphere?
To further bolster the emission interpretation, consider the following thought experiment.Quickly paint the entire globe with a highly conducting metallic paint, thereby reducing theemissivity of the surface to near zero. Because the surface no longer emits radiation, none canbe “trapped” by the atmosphere. Yet the atmosphere keeps radiating as before, oblivious to theabsence of radiation from the surface (at least initially; as the temperature of the atmospheredrops, its emission rate drops). Of course, if the surface doesn’t emit radiation but continuesto absorb solar radiation, the surface temperature rises and no equilibrium is possible until theemission spectrum shifts to regions for which the emissivity is not zero.
A more physically relevant quantity than temperature is the downward emission of radia-tion, which from Eqs. (1.71) and (1.72) is
F↓ =εS
2 − ε. (1.74)
This equation is Earth’s radiation budget in a nutshell. It tells us that emission from theatmosphere to the surface is a consequence of a radiant energy transformation. Solar radiation(S) is transformed, because of absorption by the surface, into longer wavelength radiation

1.6 Emissivity and Global Warming 35
F↓ from the atmosphere. But this transformation cannot occur unless the atmosphere has anonzero emissivity. As ε increases, the downward radiation increases, and the rate of increaseis greatest at ε = 1. S is the net incoming solar radiation to the planet, which is affected by theradiative properties of clouds and their spatial extent as well as the output of the sun and theEarth–sun distance. Although the slabs in our analogy were uniform, the atmosphere is not.The sky can be cloudy or clear or both at the same time, and we have seen that the emissivity ofclouds is greater than that of clear air. This points to the opposing roles of clouds in reducingF↓ because of greater reflection (reduced S) and increasing it because of greater emission.
The total amount of radiant energy of all wavelengths absorbed by the bottom (surface)slab is
F↓ + S =S
1 − ε/2, (1.75)
which lies between S (ε = 0) and 2S (ε = 1).An average (or better yet, effective) temperature that does have an unambiguous physical
meaning is the effective radiative equilibrium temperature Teff of Earth defined as the temper-ature of a blackbody with a total emission equal to the net solar radiation received by Earthaveraged over its entire surface:
σT 4eff = S =
S0
4(1 − a). (1.76)
For S = 240 Wm−2, Teff = 255 K. This is the equivalent blackbody temperature an observeron the moon would infer for Earth looked upon as an infrared sun. Just as we on Earth saythat the sun is equivalent to a 6000 K blackbody (based on the solar irradiance), an observeron the moon would say that Earth is equivalent to a 255 K blackbody (based on the terres-trial irradiance). Note that the effective temperature defined by Eq. (1.76) in no (direct) waydepends on the emissive properties of Earth’s atmosphere.
In general, energy (or power) is a more relevant physical quantity than temperature. En-ergies are additive, temperatures are not; energy is conserved, temperature is not. Energyfluxes drive atmospheric processes. But W m−2 is banned from American newspapers, bothbecause it is an SI quantity and because it is much too scientific for readers of even the mostpretentious newspapers in the land. Similarly, instead of energy fluxes we get the wind-chilltemperature, which obscures the fact that energy fluxes, not temperatures, kill people by hy-pothermia. Canadian meteorologists at one time, perhaps still, gave energy fluxes (rates ofenergy transfer from bodies), and we recall once seeing a value of 1000 Wm−2 during thewinter, a number that makes you shiver if you understand energy fluxes.
The total amount of radiation emitted by the atmosphere over a given time and a givenarea is a definite number. It may be difficult to measure but it is not an average.
Equation (1.74) contains a trap, not a radiation trap but one for the unwary, and it hascaught some big fish. At first glance it would seem that the worst that could happen would befor ε to reach 1, and hence the maximum irradiance from the atmosphere to the surface wouldbe pegged at S. The addition of any more infrared-active gases would have no effect. Thisdubious conclusion illustrates the perils of pushing an analogy too far. We made a simplifyingassumption likely to become invalid as the concentration of infrared-active gases increases

36 1 Emission: The Birth of Photons
Figure 1.16: A set of N slabs, infinite in lateral extent, each of which is black to longwaveradiation. All the slabs except the bottom one are transparent to incident shortwave radiation.
without limit, namely, that the atmosphere can be represented as a single slab (temperature).Let’s see how matters change if we consider a set of N slabs, each of which is black tolongwave radiation (Fig. 1.16). As before all slabs are transparent to shortwave radiationexcept the bottom one. Radiative energy balances for the entire system, then for each slab insuccession from the top downward yield
S = σT 4N , 2σT 4
N = σT 4N−1, 2σT 4
N−1 = σT 4N + σT 4
N−2, . . . (1.77)
from which it follows that
σT 4N−j = (j + 1)S (j = 0, 1, . . . , N). (1.78)
The downward radiation to the bottom slab (surface)
F↓ = NS (1.79)
therefore increases without limit asN increases. Of course, this simple analogy would at somepoint break down, but it does show that downward radiation to the surface could increasewith increasing concentration of infrared-active gases, accompanied by higher atmospheric(tropospheric) temperatures.

References and Suggestions for Further Reading 37
Does the atmosphere “act like a blanket”? No, not really. Blankets, like almost all insula-tion, suppress convection. This is why so many insulating materials bear a family resemblance.What do wool, down, cork, felt, hair, glass wool, foam, earth, snow, etc. have in common?They all are porous materials. When subjected to temperature differences, air moves, thereforetransporting energy. But the air in pores, if they are sufficiently small, doesn’t move much. Sothe function of blankets is to suppress the movement of air by enclosing it in small pores. Ifyou want a blanket to also reduce net radiation, wrap the blanket with aluminum foil, whichhas a low emissivity. This is why the insulation in houses or around pipes is coated with foil.But note that this is just the opposite of what happens in the atmosphere. As the emissivityof the atmosphere increases, we expect downward radiation from it to increase (all else beingequal). This is yet another reason why assertions about the “atmosphere acting like a blanket”are absurd.
Now a parting shot about the term “greenhouse effect”. The only difference betweena greenhouse and an ordinary house is where their furnaces are located: outside (the sun)for a greenhouse, inside for an ordinary house. This is why the walls of a greenhouse are(partly) transparent to solar radiation. These same walls are more or less opaque to the infraredradiation emitted by the interior. But so are the walls of ordinary houses, and no one says thatthey “trap” radiation. You can demonstrate for yourself just exactly what houses do by openingall the doors and windows of your house on a cold and blustery winter day. The walls “trap”just as much radiation as when the house was shut tightly, but now the furnace is heating thegreat out of doors.
References and Suggestions for Further Reading
The quotation in the opening paragraph is from Hans Vaihinger, 1935: The Philosophy of ‘Asif’, 2nd ed. Barnes & Noble, p. xlii.
We owe the insight about the duality of sound to Fritz Bopp, 1957: The principles of thestatistical equations of motion in quantum theory, in Observation and Interpretation in thePhilosophy of Physics, S. Körner, Ed., Dover, p. 190.
For the latest experimental limits on the photon mass see Jun Luo, Liang-Cheng Tu, Zhong-Kun Hu, and En-Jie Luan, 2003: New experimental limits on the photon rest mass with arotating torsion balance. Physical Review Letters, Vol. 90, pp. 081801 (1–4). The authorscite a string of papers, published during the past 33 years, reporting ever-decreasing upperlimits on the photon mass. If it were known to be identically zero, many physicists have beenwasting their time and the taxpayers’ money.
For an English translation of Einstein’s 1905 paper giving a theoretical interpretation of thephotoelectric effect (the official reason for his 1921 Nobel prize) see the collection edited byHenry A. Boorse and Lloyd Motz, 1966: The World of the Atom, Vol. I, Basic Books, pp. 544–57, an invaluable two-volume collection of and commentaries on the most important paperson atomism from antiquity to the age of quarks and other strange particles.

38 1 Emission: The Birth of Photons
Despite its age, the treatise by Arthur Llewelyn Hughes and Lee Alvin Dubridge, 1932: Pho-toelectric Phenomena, McGraw-Hill is still worth reading, especially the first two chapters onthe history of Eq. (1.4) and its experimental verification, which required considerable effortand ingenuity. The authors assert (p. 5) that there “are but few more interesting developmentsin all of physics than the growth of the surface photoelectric effect from an obscure physicalphenomenon to one of profound theoretical significance, and, finally, to one of surpassingcommercial importance.”
Heinrich Hertz is usually credited with the (1887) experimental discovery of the (surface)photoelectric effect, although it is much less well known that he invented the thermodynamicdiagrams used by meteorologists (Elizabeth Garber, 1976: Thermodynamics and meteorology.Annals of Science, Vol. 33, pp. 51–65.)
The history of attempts to interpret the photoelectric effect without photons is recounted byRoger H. Stuewer, 1970: Non-Einsteinian interpretations of the photoelectric effect. Min-nesota Studies in the Philosophy of Science, Vol. 5. Historical and Philosophical Perspectivesof Science, Roger H. Stuewer, Ed., pp. 246–63, University of Minnesota Press. Section V is arefutation of the oft-repeated mantra that it is impossible to understand the photoelectric effectwithout invoking photons.
Arguments for the greater usefulness of the wave language for light are in a letter by M. Psi-mopolous and T. Theocharis, 1986: “. . . To see it as it is. . . to know it as it isn’t. . . ” AmericanJournal of Physics, Vol. 54, p. 969.
Charles H. Townes’s statement about physicists being “diverted” is in his 1984 paper Ideasand stumbling blocks in quantum electronics. IEEE Journal of Quantum Electronics, Vol. 20,pp. 547–50.
For an excellent critical discussion of the photon concept, including its long and controversialhistory, see Richard Kidd, James Ardini, and Anatol Anton, 1989: Evolution of the modernphoton. American Journal of Physics, Vol. 57, pp. 27–35.
For a simple experimental demonstration that unilluminated bodies we cannot see may emitenough visible light to be detected, see Craig F. Bohren,1987: Clouds in a Glass of Beer, JohnWiley & Sons, pp. 74–5.
Minimum temperatures for a blackbody to be visible are given by Leo Levi, 1974: Blackbodytemperature for threshold visibility. Applied Optics, Vol. 13, p. 221.
Derivations of the Maxwell–Boltzmann distribution, Eq. (1.8), are given in treatises on thekinetic theory of gases such as Earle H. Kennard, 1938: Kinetic Theory of Gases, McGraw-Hill, Ch. II; Leonard B. Loeb, 1961: The Kinetic Theory of Gases, Dover, Ch. IV; and SirJames Jeans, 1982: An Introduction to the Kinetic Theory of Gases, Ch. IV. Loeb (pp. 130–8)and Jeans (pp. 124–30) discuss some of the early experimental verifications of this distri-bution. Deriving it by detailed consideration of molecular energy exchanges by collisions is

References and Suggestions for Further Reading 39
not trivial, but plausible arguments (not a rigorous derivation) for the distribution of molec-ular speeds (from which follows that for energies) is given by Craig F. Bohren and Bruce A.Albrecht, 1998: Atmospheric Thermodynamics, Oxford University Press, pp. 61–4.
The Planck distribution, Eq. (1.11), is not easy to derive. If it were, Planck would not be almosta household name. One of the best derivations we’ve seen is by David Bohm, 1989: QuantumTheory, Dover, Ch. 1. To follow this derivation requires a good grounding in electromagnetictheory, statistical mechanics, and classical mechanics.
Nowadays we blithely write down the Planck distribution forgetting that the theoretical andexperimental path to it was long and arduous. Imagine how difficult it was to make absolutespectral measurements more than 100 years ago. The history of the Planck distribution isrecounted in Hans Kangro, 1976: Early History of Planck’s Radiation Law, Taylor & Francis.For a history of the role that blackbody radiation played in the evolution of quantum mechanicssee Thomas S. Kuhn, 1978: Black-Body Theory and the Quantum Discontinuity 1894–1912,Oxford University Press.
The equilibrium distribution of molecular energies in a closed container can come about onlybecause of interactions (energy exchanges) between molecules within the gas and betweengas molecules and the walls of the container. The Maxwell–Boltzmann distribution appliesstrictly to an ideal gas in which molecules exert no forces on each other (or the time over whichthey do exert forces is zero, which also is physically unrealistic). Photons do not interact witheach other, so the equilibrium distribution of a photon gas can come about only because ofinteractions of photons with the walls of the container. Radiation in a perfectly reflectingcontainer (which does not exist) would never evolve to the equilibrium distribution if it didnot initially have this distribution. These points are made by F. E. Irons, 2004: ReappraisingEinstein’s 1909 application of fluctuation theory to Planckian radiation. American Journal ofPhysics, Vol. 72, pp. 1059–67.
Planck’s The Theory of Heat Radiation, an English translation of the second edition of which(1913) was published by Dover in 1959, is full of insights and qualifiers that have been for-gotten over the years. For example, Planck recognized that “the surface of a body never emitsrays, but rather it allows parts of the rays coming from the interior to pass through” (p. 4), thata “finite amount of energy. . . is emitted only by a finite. . . volume, not by a single point” (p. 5),that all matter is inhomogeneous at some scale (p. 8), that “in nature there is no such thing asabsolutely parallel light or an absolutely plane wave front” (p. 14), and that the maximum ofa distribution function depends on how it is expressed (p. 16).
Proof of the theorem for the change of variables in integration is given by R. Creighton Buck,1978: Advanced Calculus, 3rd ed., McGraw-Hill, pp. 182–3. This excellent textbook is rigor-ous without being oppressive. Buck recognizes that theorems must be proven by a sequence oflogical steps, not by notational tricks. But he does recognize that notation “serves as a guidein the correct application of theorems.”
The consequences of the failure to recognize that a distribution function does not have a uniquemaximum are discussed by Bernard H. Soffer and David K. Lynch, 1999: Some paradoxes, er-

40 1 Emission: The Birth of Photons
rors, and resolutions concerning the spectral optimization of human vision. American Journalof Physics, Vol. 67, pp. 946–58.
A discussion of the principle of detailed balance in the context of proving Kirchhoff’s law isgiven by F. Reif, 1965: Fundamentals of Statistical and Thermal Physics, McGraw-Hill, pp.382–4.
A concise but good discussion of time-reversal symmetry is given by P. C. W. Davies, 1976:The Physics of Time Asymmetry, University of California Press, pp. 22–7. The time-reversalsymmetry of fundamental dynamical laws (e.g., Newton’s laws, electromagnetic theory, quan-tum mechanics) is to be distinguished from what Davies calls the “asymmetry of the worldwith respect to time” (i.e., we all grow older, alas, even though growing younger is not forbid-den by dynamical laws).
We are by no means the first to ridicule the notion that there are “good” and “bad” emit-ters. In an obituary notice for John Henry Poynting (whose eponymous vector appears inChapter 4), Oliver Lodge noted that Poynting’s “rebellion against an excessive anthropo-morphism. . . some substances being praised as good radiators while others are stigmatizedas bad. . . though doubtless more than half humourous was in itself wholesome” (CollectedScientific Papers by John Henry Poynting, 1920, Cambridge University Press, p. xii).
Kirchhoff’s law in Section 1.4 is not his original version, for which see William Francis Magie,1965: A Source Book of Physics, Harvard University Press, pp. 354–60, a superb collection ofexcerpts from more than 100 papers of great historical significance preceded by short biogra-phies of their authors. For example, the empirical (i.e., obtained by curve fitting) discovery ofthe radiation law, Eq. (1.27), later derived by Boltzmann, is given in Stefan’s own words onpp. 378–81.
For a brief biography of Gustav Robert Kirchhoff and the significance of his work see theentry by L. Rosenfeld in Dictionary of Scientific Biography, Vol. VII, pp. 379–83. Other thanoriginal papers, the DSB is the first place to look if you want to know what our illustriouspredecessors really did and said. The last place to look is in textbooks, which are notoriousspreaders of rumors, half-truths, and outright errors. Ask any historian of science. Better yet,read Tony Rothman’s (2003) delightful Everything’s Relative and Other Fables from Scienceand Technology, John Wiley & Sons.
The controversy over the validity of Kirchhoff’s law is reviewed by H. P. Baltes, 1976: Onthe validity of Kirchhoff’s law of heat radiation for a body in a nonequilibrium environment.Progress in Optics, Vol. 13, pp. 1–25.
The term emittance is sometimes used for what we call emissivity. Indeed, it has been sug-gested that emissivity be used for bodies that are “pure and smooth”, emittance for bodiesthat are not. For a criticism of this suggestion see the letter by William L. Wolfe, 1982: Aproclivity for emissivity. Applied Optics, Vol. 21, p. 1. Wolfe’s parting shot is “On reflection,I like reflectivity and emissivity”. So do we, but for a contrary view see Joseph C. Richmond’s

References and Suggestions for Further Reading 41
rebuttal following Wolfe’s letter. If the term emittance is to be used at all it is best reserved asan abbreviation for emitted irradiance (or radiance). Note in Chapter 4 that radiometric andphotometric dimensional quantities (radiance, irradiance, luminance, etc.) all end in ance, andhence in the same spirit emittance ought to be emissivity times the Planck function.
The assertion on page 22 that radiant heat is a “meaningless term” is from Yves Le Grand,1957: Light, Colour, and Vision, John Wiley & Sons, p. 4.
Luminescence (mentioned in Sec. 1.4.5) is the term first used by Eilhardt Wiedemann (1888)for “all those phenomena of light which are not solely conditioned by the rise in temperature.”Luminescence, or “cold light”, is contrasted with incandescence, or “hot light”. Examples ofluminescence are the dim light of phosphorous, the light of fireflies, and the light emitted bysubstances excited by various kinds of electromagnetic radiation or subatomic particles. Bylight is usually meant visible or near-visible.
Fluorescence originally was applied to light that ceases immediately upon removal of itssource of excitation, in contrast with phosphorescence, which persists. But this distinction isnot absolute, long-lived fluorescence merging continuously into short-lived phosphorescence.Moreover, what is meant by “long-lived” and “short-lived” depends on the sensitivity of in-struments. Some observable consequences of fluorescence are presented in Section 4.1.7.
In all examples of luminescence electrons in atoms and molecules are excited by somemeans into higher energy levels. At a later time these electrons decay to lower energy levels,with the attendant emission of photons having energies equal to the differences in the energylevels. In fluorescence, the time between excitation and decay may range from a second toas low as 10−9 s, which is still a long time compared with the inverse frequency of visibleradiation.
For a history of luminescence see the monumental treatise by Edmund Newton Harvey,1957: A History of Luminescence From the Earliest Times Until 1900, American PhilosophicalSociety. See especially Chapter XI on fluorescence. This term was coined by Sir GeorgeGabriel Stokes, a central figure in Chapter 7. For Stokes’s abstract of his lengthy paper onfluorescence see Magie, pp. 344–52.
The solar spectrum in Figure 1.7 is derived from a spectrum developed by Robert L. Kurucz ofthe Harvard-Smithsonian Center for Astrophysics. The best reference for this spectrum is hisunpublished article The Solar Irradiance by Computation (November 25, 1997). We obtainedour copy from Kurucz. Tony Clough averaged Kurucz’s spectrum to 1 cm−1 resolution. Westarted with Clough’s spectrum and averaged it further to 20 cm−1 resolution. The best wayto obtain the Kurucz solar irradiance values is by downloading the Line-by-Line RadiativeTransfer Model (LBLRTM) developed by Tony Clough and his co-workers. Both the originalKurucz spectrum and Clough’s 1 cm−1 resolution spectrum come bundled with LBLRTM,which is available through Atmospheric and Environmental Research (AER), Tony Clough’semployer.
For an older set of tables of the solar irradiance at intervals of 10 nm or 20 nm over most ofthe spectrum, which may be more convenient for calculations and yet still adequate for many

42 1 Emission: The Birth of Photons
purposes, see M. P. Thekaekara and A. J. Drummond, 1971: Standard values for the solarconstant and its spectral components. Nature Physical Science, Vol. 229, pp. 6–9.
For simple experiments to demonstrate that emission by aluminum foil is quite different fromthat of bodies painted white or black, and that despite appearances to the contrary, some(visibly) black and white bodies are nearly identical at infrared wavelengths, see Craig F.Bohren, 1991: What Light Through Yonder Window Breaks?, John Wiley & Sons, Ch. 7. Seealso Richard A. Bartels, 1990: Do darker objects really cool faster? American Journal ofPhysics, Vol. 58, pp. 244–8.
The greguería on page 26 is from Ramón Gómez de la Serna, 1994: Greguerías, ClasicosCastlia, p. 69.
Problems
1.1. We note in Section 1.2.1 that the Planck distribution can be expressed as a function offrequency or wavelength. But this doesn’t exhaust the possibilities: any single-valued functionof frequency is a suitable independent variable. Moreover, other distributions related to thePlanck distribution are also possible. For example, the spectral number density n (numberper unit volume) of photons in a cavity at a fixed temperature is proportional to the Planckfunction divided by the photon energy (see Prob. 4.51), and n can be expressed as photonsper unit frequency n(ω) or per unit wavelength n(λ). Do so and then find the correspondingdisplacement laws for the maxima of these distributions.
1.2. The inverse of a function might not be single valued (i.e., the inverse might not exist). Toconvince yourself of this, and to obtain a better understanding of what is meant by the inverseof a function, sketch a simple function with a multi-valued inverse. This requires thinkingcarefully about what is meant by a mathematical function and its inverse. A simple sketch isall that is needed.
1.3. All raindrops are not identical but are distributed in size. The Marshall–Palmer distribu-tion
N(D) = Noe−ΛD (1.80)
often has been used for raindrops, where No and Λ are constants. N(D) has the property that
∫ D2
D1
N(D) dD (1.81)
is the number of raindrops per unit volume with diameters between D1 and D2. From thisdistribution one can obtain the mean diameter, call it 〈D〉. But the scattering of sunlight (seeSec. 3.5) by raindrops is proportional to D2, so as far as light scattering is concerned theroot-mean-square diameter, the square root of the average of D2, is of physical significance.
The mass of a raindrop is proportional to the cube of its diameter, so the relevant averagediameter here is the cube root of the average of D3. The contribution of a drop to rainfall

Problems 43
rate depends on the product of its volume and its terminal velocity, which is approximatelyproportional to diameter. Here the relevant mean diameter is the fourth root of the averageof D4. Finally, the radar backscattering cross section (see Sec. 3.5.2) is proportional to thesixth power of diameter.
Find the relative values of the root-mean-sixth, root-mean-fourth, root-mean-cube, root-mean-square, and mean diameters for the Marshall–Palmer distribution (for D ranging from0 to ∞). What do you conclude from this?
1.4. A radiation thermometer infers temperatures of objects (at typical terrestrial tempera-tures) by measuring infrared radiation from them. We have done the following demonstration.We put some water and ice cubes in a shiny, thin-walled metal container with an open top (atin can with the label removed will do) and stirred the water thoroughly. Then we pointedthe thermometer at the water surface. The temperature reading was close to 0 ◦C, but whenwe immediately pointed the thermometer at the side of the container, the temperature readingincreased. Then we replaced the ice–water mixture with hot water. The temperature of thewater measured at its top surface was a certain value, but when we pointed the thermometerat the side of the container, the temperature reading decreased. Explain.
1.5. Estimate plausible minimum and maximum values (W m−2) at Earth’s surface of radia-tion emitted downward by the atmosphere.
1.6. Try the following demonstration. Hold your arms out from your sides, level with yourshoulders, hands open, for about 10 seconds. Then suddenly bring your arms together so thatyour palms are a centimeter or less apart facing each other but not touching. Hold your handsin this position for perhaps 10 seconds or more. Describe what you experience and explain it.
1.7. For the previous problem students have mentioned radiation from the air. By simplephysical arguments you should be able to show that radiation from air in a room is negligible.
HINT: A good estimate for the infrared brightness temperature of the sky is about 250 K.
1.8. Estimate the temperature of the filament of a 100 W electric light bulb. State all as-sumptions. Estimate the uncertainty in your estimate because of uncertainties in the quantitiesneeded for your calculations.
HINT: If you can find a burned-out bulb, smash it (carefully) and examine the filament. If youcan’t find such a bulb, try to find a clear light bulb so that you can estimate the dimensions of afilament. Be sure to ask yourself if your estimate is reasonable (300 K is not, nor is 30,000 K).
1.9. If ozone in the upper atmosphere is a “good absorber” of solar ultraviolet radiation, whyisn’t it also a “good emitter” of such radiation, thereby undoing the good it is said to do?
1.10. Suppose that you have a friend, a Texan, say, who tells you that in Texas it once was sohot that his spit boiled when it hit the pavement. Is it possible for water to boil when placed ona surface heated by sunlight (no lenses please)? What is wanted here is a simple, quantitativeargument showing that spit boiling on hot pavement either is possible or is not. If possible, isit plausible?
HINT: At the top of the atmosphere, the amount of solar radiation incident on every squaremeter (pointed toward the sun) is about 1369 W, but, of course, is less at the surface.
1.11. The following was taken from a book on radar systems: “It is known from the theory ofblackbody radiation that any body which absorbs energy radiates the same amount of energythat it absorbs.” Discuss.

44 1 Emission: The Birth of Photons
1.12. How might heights of clouds above the surface of Earth be estimated from observationsmade from a satellite well above them? The satellite is not equipped with a laser or any othersource of radiation. State all assumptions.
1.13. What fraction of electricity bills for lighting with incandescent lamps is wasted becausethey emit invisible as well as visible radiation? You may take the color temperature of incan-descent lamps to be 2500 K and assume constant emissivity of the filament.
HINT: You can do this problem analytically by making judicious approximations or you canwrite a computer program for numerically integrating the relevant integral. If you are in ahurry, you can content yourself with an upper limit on this fraction.
1.14. Estimate the maximum temperature of the illuminated surface of the moon. You maytake 1369 Wm−2 as the solar irradiance at the top of Earth’s atmosphere. State all assump-tions. After you have made your estimate, try to find out how it squares with any measurementsyou can find.
1.15. Sketch the spectral absorptivity, from ultraviolet well into the infrared, of the best solarenergy collector. By “best” is meant that the temperature it reaches is as high as possible.Take a stab at estimating this temperature. You may take the solar spectrum to extend from0.25 µm to 2.5 µm and 1000 W m−2 as an estimate for the maximum solar irradiance at theground.
You can’t determine this temperature on the back of an envelope but will have to write acomputer program. At the very least, write down the equation that has to be solved and givesome thought to how you might do so.
1.16. Several years ago a newspaper advertisement described a new kind of radiant heatingsystem. The radiating panels were said to be “hot to the touch but they do not burn.” Theadvertisement went on to say “the panels radiate long infrared rays which are most readilyabsorbed by the objects, including the human body. In fact, they are the same rays that warmus from the sun.” Discuss.
1.17. When one of the authors and his wife lived in Wales they had in their bedroom a heatingpanel similar to that described in Problem 1.16. Now they have a small electric heater in theirbedroom, and it seems to do about as good a job as the panel. This heater has 6 strips, eachabout 20 cm long and 0.5 cm wide. When the heater is operating, the strips glow red. On thebasis of this information you should be able to estimate the size of the panel in Wales. Youmay take the panel to be square. State all assumptions and, as always, be sure that your answermakes sense.
1.18. Why do temperature inversions (temperature increasing with height) often form at nightimmediately above the tops of clouds?
1.19. In the simple two-slab analogue to the Earth–atmosphere system, the top slab repre-senting the atmosphere was assumed to emit the same amount of radiation to space as to theground. Is this true for the real atmosphere? Why or why not?
1.20. If a warm object is wrapped with aluminum foil the rate of cooling of the object de-creases (by “warm” is meant that the temperature of the object is higher than that of its sur-roundings). You can verify this by heating some water, pouring it into a jar, then measuringthe rate at which the water temperature decreases with time. Do this with a bare jar and thenwith one wrapped in aluminum foil.

Problems 45
Aluminum foil has a lower emissivity than glass, and hence the foil reduces emission.But at the same time, the foil has a lower absorptivity, which means that the foil decreasesthe absorbed radiation from the surroundings. Because the foil giveth and the foil takethaway why isn’t its net effect zero? What is the essential condition for the cooling rate todecrease because of wrapping the jar with foil? Another version of this question is, Underwhat conditions would wrapping an object with foil increase the rate of cooling?
You may assume that Kirchhoff’s law is valid even for spectrally averaged emissivity andabsorptivity.
1.21. The following statement is in an opening paragraph in a paper (Carl G. Ribbing, 1990:Beryllium oxide: a frost preventing insulator. Applied Optics, Vol. 15, pp. 882–84) on lowemissivity coatings for dew and frost prevention: “The possibility for wavelength-selectivecondensation prevention is based on the existence of atmospheric transmittance windows.It is only by emission of radiation in these wavelength intervals that a body can cool to asubstantially lower temperature than the immediately surrounding air. . .”
Atmospheric windows are spectral regions in the terrestrial infrared where the atmospherehas a comparatively high transmissivity.
Discuss the statement enclosed in quotation marks. It can be restated as follows: To de-velop coatings with spectral emissivitivies that reduce net radiative cooling, one need consideronly the atmospheric window regions of the terrestrial infrared spectrum.
What implicit assumptions underlie this statement? Do you agree with it? You can giveeither mathematical or physical arguments or both.
HINT: It may help to divide the terrestrial infrared spectrum into two regions: window andnon-window. Don’t hesitate to make simplifying assumptions that enable you to concentrateon what is essential rather than get bogged down in details.
1.22. One of the authors lived in Arizona on a former dude ranch in the desert outside Tucson.One year he painted the roof of his cottage (not air-conditioned) with a metallic paint. Theaim was to increase the reflectivity of the roof for solar radiation, thereby reducing the tem-perature inside the cottage. If your aim is to keep the interior of a house cooler in a region ofintense solar illumination would you paint the roof of the house with metallic or white paint?Explain your choice. This is an open-ended question without a right or wrong answer. Formeasurements relevant to this problem see Dena G. Russell and Richard A. Bartels, 1989:The temperature of various surfaces exposed to solar radiation: an experiment, The PhysicsTeacher, Vol. 27, pp. 179-81.
1.23. Photons have energy and momentum (linear and angular). We gave an expression forthe energy hν of a photon but not its momentum. But from this expression you should beable to guess the expressions for photon linear momentum and angular momentum (to withindimensionless constants) by simple dimensional arguments. Don’t look up the answer in aphysics book. If you know the answer, don’t do this problem because it won’t teach youanything.
1.24. Estimate the maximum irradiance of a towering inferno (e.g., a huge forest fire) relativeto that of the sun on a clear day at noon.
1.25. The September 30, 1995 issue of Science News contained the following in an article onengineering solutions to global warming: “One of the more expensive options would be to

46 1 Emission: The Birth of Photons
install a giant solar deflector, built from materials on the moon, at a point 1.5 million milesfrom Earth in the direction of the sun. Thinner than a human hair, the diaphanous sheet wouldstretch 2,000 kilometers across and deflect 2 percent of the radiation headed toward Earth.Estimated cost: $1 trillion to $10 trillion.”
You might think that thousands of hours of computer time went into computing the value“2 percent”. In fact, you can obtain this number (approximately) in a few minutes without acalculator. The purpose of the “diaphanous sheet” is to compensate for the increased emissiv-ity of the atmosphere as a consequence of doubling the concentration of CO2. Assume thatthe increase in the radiative equilibrium temperature of the simple slab model of the Earth–atmosphere system at the surface because of this increased CO2 is 1.5 K and that the presentradiative equilibrium temperature is 288 K. This is all you need in order to do this problem.Huge computers, elaborate global circulation models and radiative transfer codes are not nec-essary. The analysis underlying a project estimated to cost more than $1 trillion can be doneon the back of an envelope – if you know what you are doing.
1.26. Estimate the total rate of emission of radiation from a (naked) human. A good estimatefor skin temperature is 33◦C. The surface area S (in cm2) of a human can be estimated fromthe DuBois formula
S = 71.84W 0.425L0.725,
where W is body mass in kg and L is height in cm. This is the total surface area, about 80%of which is the effective radiating area. To good approximation human skin and hair have anemissivity close to 1 over the relevant range of infrared wavelengths. The Dubois formula isin Max Kleiber, 1975: The Fire of Life, 2nd ed., Robert E. Krieger, p. 184. This very readablebook is filled with fascinating data such as the weight loss of the fasting dog Oscar (p. 28) andthe time evolution of the rectal temperature of pigs in air at different temperatures (p.177).
Express your result in kilocalories (food calories) per day. One calorie is 4.184 J and akilocalorie is 1000 cal. On the basis of this calculation what do you conclude about yournecessary daily food intake if there were no radiation from the environment? Suppose thatthere were no such radiation. What strategy would humans likely have had to adopt in orderto survive? What class of animals would we resemble?
Now determine your net infrared radiation, in kcal/day, in an environment at room tem-perature (20◦C). Estimate the fraction of your daily food intake (in kcal) that is needed just tobalance net radiation.
How does clothing alter your numbers and conclusions? To answer this you either haveto estimate the temperature drop from skin to clothing or measure this drop with an infraredthermometer.
You often hear the assertion (but not from us) that “most body heat is lost from your head.”Can you make any sense out this, its implication being that your head is some kind of super-radiator? Yet the emissivity of skin and hair on your head is no different from that on the restof your body, and head temperatures are not greatly different from those on other areas of yourbody. Moreover, you have more hair on your head than other parts of your body (unless youare bald). You can make your answer quantitative by estimating the contribution of your headarea to total body area.
1.27. What is the temperature of a blackbody with an emission spectrum that peaks at thesame wavelength as the solar spectrum (outside Earth’s atmosphere)? Suppose that the sun

Problems 47
were replaced by a blackbody of the same radius and distance to Earth. What is the temper-ature of this blackbody such that the solar irradiance is its presently accepted value (about1369 Wm−2)? The angular width of the sun is about 0.5◦.
1.28. For what angle is the reflectivity of water at 10 µm such that emission by it at 100◦Cequals reflection of clear-sky radiation of the same wavelength? You may take the radiativetemperature of the sky to be 250 K. This problem is related to the directional emissivity ex-periment discussed in Section 1.5.1.
1.29. We show in Section 1.2.1 that the wavelength at which the Planck function has a max-imum (for a given temperature) is not an absolute quantity but depends on the independentvariable chosen, which is arbitrary. Mark Heald (2003) in an article in American Journal ofPhysics (Where is the “Wien peak”?, Vol. 71, pp. 1322–23) agrees but notes that a peak wave-length can be defined unambiguously as a median wavelength: the wavelength that divides thePlanck function into two regions of equal area (integrated irradiance). First, convince yourselfthat this median wavelength is independent of the variable in the Planck function and why.Then determine the displacement law for the median wavelength.
HINT: The second part of this problem requires numerically evaluating an integral.
1.30. Brightness temperature is equal to thermodynamic temperature if the emissivity of theobject of interest is 1 at the wavelengths detected by the radiation thermometer and the de-tected radiation is solely that emitted by this object. Assume that the second condition issatisfied and derive a simple expression for the relative difference between brightness tem-perature (at, say, a wavelength of 10 µm or thereabouts) and thermodynamic temperature as afunction of the departure of the emissivity from 1 for typical terrestrial temperatures.
HINT: Expand the brightness temperature in a Taylor series around ε = 1.
1.31. The result of the previous problem might lead you to believe that errors in bright-ness temperatures because of departures of emissivity from 1 are large. Measurements ofthe brightness temperature of objects are always made in a particular environment. In whatkind of environment would the error be greatest? In what kind of environment would the errorbe least (possibly zero) even if the emissivity of the object of interest were appreciably lessthan 1? To help you answer these questions consider measuring the brightness temperatureof a wall inside a house. Even though the emissivity of a wall probably is less than 1, theradiation thermometer reading is more or less correct. Why?
1.32. Because photons possess linear momentum, light can exert radiation pressure, that is,transfer momentum to illuminated objects. Determine the radiation pressure of direct solarradiation illuminating a surface with reflectivity 1 at all solar wavelengths. Take the irradianceto be 1000 Wm−2. Express your answer relative to sea-level atmospheric pressure. What isthe radiation pressure on a surface that is black at all solar wavelengths?
HINTS: Problems 1.1 and 1.23 should be helpful. The relation between radiation pressure andirradiance is so simple that you could obtain it (to within a constant factor) by dimensionalanalysis.
1.33. It has been stated countless times that no body can emit more radiation in any wave-length interval than a blackbody at the same temperature. Yet there are plenty of examples inwhich bodies can emit thousands of times more than blackbodies. Give a few simple exam-ples. You don’t have to go far to find them.

48 1 Emission: The Birth of Photons
1.34. We have hit on a sure-fire weight loss scheme, the Bohren and Clothiaux Radiation Diet.According to Einstein’s famous mass energy equation, which now is such a commonplacethat it is a staple of cartoons, if a body loses energy its mass decreases. So we are planningconstruction of a world-wide chain of weight-loss rooms. The walls of a room are black tothe kind of infrared radiation emitted at body temperature and cooled to the temperature ofdry ice (−78.5 ◦C) to maximize net radiation from clients in the room. While sitting in it theywill radiate their excess weight without exercise or diet at a cost of only $10 an hour. We areoffering exclusive franchises to readers of this book for the absurdly low fee of only $50,000.How can you lose? Send us money now and take advantage of this advance offer.
1.35. Estimate how long it would take in a completely darkened room to photograph an objectat room temperature. Assume that with the fastest film available and the aperture as large aspossible (smallest f-stop) you can photograph the coils of an electric stove (estimated temper-ature of, say, 1500 K) with an exposure time of 1/100 s. All that is wanted here is a crudeestimate. Would it take hours, weeks, months, years, centuries?
1.36. Green vegetation is more absorbing of solar radiation with wavelengths less than about700 nm than of radiation with greater wavelengths (note the steeply rising radiance of grassbeyond about 690 nm in Fig. 4.13). Can you think of reasons why plants might have evolvedto have this spectral absorption property?
1.37. Radiation literally could be trapped in a container with perfectly reflecting (100%)walls. Photons injected into such a container would rattle around forever. But perfectionis not of this world. Estimate how much departure from perfection (what reflectivity < 100%)could be tolerated in a container with linear dimensions of order 10 cm such that radiant en-ergy trapped within it would decrease by no more than, say, 1/e of its initial value in an hour.
1.38. Photons emitted by a body cannot be interrogated as to their origins: luminescence orthermal emission. All that can be measured is total emission. But it is possible to determineif part of the emitted radiation is a consequence of luminescence and even how much. If totalemission (at a given frequency) exceeds that of a blackbody, the excess can be attributed toluminescence (almost by definition). But a body can emit less than a blackbody (at the sametemperature) and yet still be luminescent. What do you need to know in order to determine thecontribution of luminescence to total emission? Obtain an expression for this contribution.
1.39. Show that in principle one can measure the temperature of a blackbody by measuringonly the ratio of radiation emitted by it at two different wavelengths. How should these wave-lengths be chosen and how does your choice depend on the expected range of temperatures?
HINT: Sketching a few functions should help.
1.40. Show that the form of the Stefan–Boltzmann law, Eq. (1.27), can be derived by applyingthe first and second laws of thermodynamics to a photon gas (in a cavity) given two results forsuch a gas: its pressure p is equal to one-third its energy density u, which depends on T only.
HINT: Consider a reversible expansion (or compression) of the photon gas. The total internalenergy of the gas is uV , where V is its volume.
1.41. What is the temperature of the air near the surface and just above the top layer in thetwo-slab model developed in Section 1.6?

Problems 49
HINT: Place a thin layer in each location and assume that it does not affect the overall en-ergy balance of the two-slab model. This question is motivated by Section 3.8 in Dennis L.Hartmann, 1994: Global Physical Climatology, Academic Press, pp. 61–3.
1.42. Meteorology students often are taught that the maximum daytime temperature (of whatwe are left to guess) occurs when the net radiation balance (again, of what we must guess) iszero. Critically discuss this.
1.43. Peter W. Huber and Mark P. Mills, 2005: The Bottomless Well, Basic Books, p. 6, assertthat the amount of solar energy reaching the “surface from above” is “roughly ten thousandtimes as much as humanity consumes in the form of fossil fuels. . . Green plants seize andtemporarily store a tiny fraction of it. During the night, the dark side of the Earth radiatesall the rest, along with the geothermal heat, back out into the black depths of the cosmos.”Critically discuss.
1.44. Why is the photon language of almost no use to most radio engineers? There is a simpleyet fundamental reason that has essentially nothing to do with phase differences. A relatedquestion, which is also a hint, is what must the photon number density be such that a detectorwith area A senses a beam as a more or less discrete set of photons?