1 efficient streamer plasma generation guus pemen, hans winands, liu zhen, dorota pawelek, bert van...
Post on 19-Dec-2015
214 views
TRANSCRIPT

1
Efficient streamer plasma generationGuus Pemen, Hans Winands, Liu Zhen,Dorota Pawelek, Bert van HeeschEindhoven University of Technology, Department of Electrical Engineering, The
Netherlands
• Power sources for streamer plasma generation• Streamer observations• Quantification of radical yields• Discussion

2
10 ns
20 ns
30 ns
40 ns
10 ns
20 ns
30 ns
40 ns
10 ns
20 ns
30 ns
40 ns
10 ns
20 ns
30 ns
40 ns
Gas cleaning effect by:• Interaction through free radicals
• Using ions to charge particles to
enhance their collection
• Electrical discharge, fast HV-pulses
• “Shower of electrons (<12 eV)
• Inelastic collisions with gas molecules
>> Radicals such as O* or OH*
>> chemically highly active
>> easily attach/modify other molecules

3
10 ns
20 ns
30 ns
40 ns
fast CCDend-onview

4
Efficient streamer plasma generation• Creating a streamer plasma in an efficient
manner (use all energy from the mains)
• Creating a streamer plasma that is efficient (from radical production point of view)

5
ns-Pulsed power sources - iExample: TU/e resonant charging – sparkgap - TLT
Filter
3-phase 400 V50 Hz AC
continuous5 kW
1 kV30 s1 kHz
500 kW
30 kV30 s1 kHz
500 kW
100 kV100 ns1 kHz
100 MW
K. Yan et.al., IEEE Trans. Industry Appl., Vol. 38, No.3, May/June 2002, pp.866-872

6
ns-Pulsed power sources - iiExample: TU/e 30 kW system for odor control
Corona reactor
DC-bias supply
TLT
Pulse generator
950.5 ppm10.1 ppmH2S
8711858987Total
100013Terpens
841066Furane
10022363Organic sulphur
1000200Chlorinatedcomponents
40570946Aldehydes
932733881Ketone
(cannot be determined)2630Esters
9444787Alcohol
9513271Aliphatic CH’s
100066Cyclic CH’s
9710395Aromatic CH’s
Removal Efficiency [%]Ouput [µg/m3]Input [µg/m3]
G.J.J. Winands et.al., IEEE Trans.on Plasma Science, Vol.34, No.5, October 2006, pp.2426-2433

7
ns-Pulsed power sources - iiiExample: high temperature corona tar removal in syngas
Corona Reactor
Fan
Window for FTIR
Tar Injector
Corona Reactor
Fan
Window for FTIR
Tar Injector
Effect of temperature on naphthalene removal in synthetic fuel gas
0
20
40
60
80
100
0 200 400 600 800
Corona energy density (kJ/Nm3)
Rem
ain
ing
fra
ctio
n (
%) 200 degr.C, dry
200 degr.C, wet
biogas 400400 degr.C, dry
0
20
40
60
80
100
0 200 400 600 800
Corona energy density (kJ/Nm3)
Rem
ain
ing
fra
ctio
n (
%) 200 degr.C, dry
200 degr.C, wet
biogas 400400 degr.C, dry
S.A. Nair, et.al., Ind. Eng. Chem. Res. 2005, 44, 1734-1741

8
AC/DC corona generation - iExample: 2 kW TU/e pilot
Mains
T1
T2T3
C0 CL
L1 L2
L3
D1
TR Corona reactor
-5 -4 -3 -2 -1 0 1 2 3 4 50
2
4
6
8
10
12
14
16
18
Time (ms)
Vo
ltag
e (
kV)
1.5 2.0 2.5 3.0
14
15
16
17
18
Time (ms)
Vol
tage
(kV
)
TU/e patents WO2005/031488 and WO2005/112212
courtesy of EnviTech, Belgium
dV/dt
1 – 3 kV/μs • Few HV components
• High energy efficiency (>90 %)
• Good radical yield (20 % less than for pulsed corona)

9
AC/DC corona generation - iiExample: investigations on TU/e – Oranjewoud system
-5 -4 -3 -2 -1 0 1 2 3 4 50
2
4
6
8
10
12
14
16
18
Time (ms)
Vo
ltag
e (
kV)
1.5 2.0 2.5 3.0
14
15
16
17
18
Time (ms)
Vol
tage
(kV
)

10
Efficient streamer plasma generation
• Power sources for streamer plasma generation• Streamer observations• Quantification of radical yields• Discussion

11
Overview of experimental set-up
Pulsed PowerModulator
Oscilloscope Computer
Deuterium lightsource
ICCDcamera
UV spectrometer
LensesAir flow in
V I
Trigger signal
Quartzwindow
Air flow out
HVCorona wire
Plate electrode

12
Pulse parameters and reactor configurations
Parameter Range
Pulse width 30 - 250 ns
Rise-time (20-80%) 15 - 45 ns
Peak voltage 50 - 90 kV
DC Voltage 0 - 20 kV
Pulse repetition rate 10-1000 pps
Energy per pulse 0 – 2.5 J
Voltage polarity Positive-negative
Parameter Value
Plate heigth [m] 1.1
Plate width [cm] 22
Plate-plate distance [cm] 7.4 – 15.4
# wires 1 - 7
Wire diameter [mm] 0.2 - 15
Wire length [m] < 0.9
Reactor capacitance [pF] 80
Max. flow used [m3∙h-1] 30
13
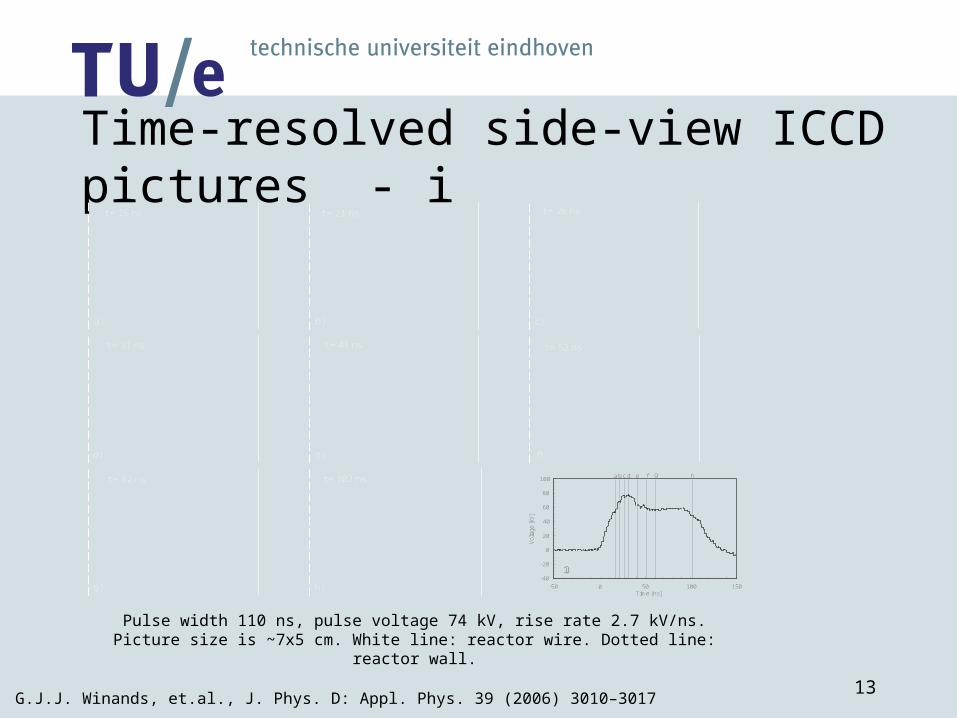
Time-resolved side-view ICCD pictures - i
t = 21 ns t = 26 nst = 16 ns
t = 31 ns t = 41 ns t = 52 ns
t = 62 ns t = 102 ns
a) b) c)
d) e) f)
g) h) 0 100Time [ns]
-40
-20
0
20
40
60
80
100
-50
Vol
tage
[kV
]
15050
a b c d e f g h
i)
G.J.J. Winands, et.al., J. Phys. D: Appl. Phys. 39 (2006) 3010–3017
Pulse width 110 ns, pulse voltage 74 kV, rise rate 2.7 kV/ns. Picture size is ~7x5 cm. White line: reactor wire. Dotted line: reactor wall.

14
Time-resolved side-view ICCD pictures - i i
G.J.J. Winands, et.al., J. Phys. D: Appl. Phys. 39 (2006) 3010–3017
Pulse-width 110 ns, pulse voltage -72 kV, rise rate 2.7 kV∙ns-1. Picture size is ~5.5x4 cm. White line: reactor wire. Dotted line: reactor wall.
t = 29 ns t = 34 nst = 25 ns
t = 44 ns t = 49 ns t = 59 ns
a) b) c)
d) e) f)
g) h)
abc de f g h
-50 0 50 100 150
Time [ns]
Vol
tage
[kV
]
t = 105 nst = 87 ns
i)
-100
-80
-60
-40
-20
0
20
40

15
0
1
2
3
4
5
6
40 60 80
Str
ea
me
r h
ea
d p
osi
tion
[cm
]
77 kV (0kV DC)70 kV (0kV DC)70 kV (20kV DC)60 kV (0kV DC)60 kV (10kV DC)52 kV (0kV DC)
Time [ns]
a)
20 1000
0.1
0.2
0.3
Str
ea
me
r d
iam
ete
r [c
m]
b)
Time [ns]
40 60 8020 100
70 kV (20kV DC)
60 kV (10 kV DC)
77 kV (0kV DC)70 kV (0kV DC)
60 kV (0kV DC)
52 kV (0kV DC)
0
20
40
60
80
100
120
140
20 40 60 80 100 120
Time [ns]
Inte
nsi
ty [
cou
nts
/pix
el]
77 kV (0 kV DC)70 kV (0 kV DC)70 kV (20 kV DC)
60 kV (0 kV DC)
60 kV (10 kV DC)
52 kV (0 kV DC)
c)
140
• Streamer density
• Streamer velocity
• Streamer diameter
• Streamer intensity
• Secundary streamer length
• Branching, interconnecting, re-ignition
• Effect of repetition rate and preceding pulses
• Effect of DC-bias voltage

16
Primary streamer velocityV
elo
city
[1
06 m
s-1
]
Rise rate [kV ns-1]
0
0.5
1.0
1.5
2.0
0 1 2 3
a)0
0.5
1.0
1.5
2.0
2.5
3.0
40 60 80 100
Voltage [kV]
37 mm57 mm77 mm
Ve
loci
ty [
10
6 m
s-1
]
b)
Results for pulse widths between 30 and 250 ns. a) Wire-plate distance fixed at 57 mm. Peak voltage: 60-70 kV. b) Voltage rise rate fixed at 1.8-2.2 kV∙ns-1.

17
Efficient streamer plasma generation
• Power sources for streamer plasma generation• Streamer observations• Quantification of radical yields• Discussion

18
Quantification of O-radical yields - i
[O3] per m3 plasma volume
UV absorbtion spectroscopy [O3, exhaust]
Gas flow + plasma volume
Kinetic model (65 reactions, 17 species, RH, T)
[O*] per m3 plasma volume
Plasma volume
total number of [O*]

19
Quantification of O-radical yields - ii
It appears so !
Primary streamers better than secondary ?
40 60 80 100
Voltage [kV]
0
2
4
6
8
30 ns FWHM
50 ns FWHM
100 ns FWHM130 ns FWHM
O* p
rod
uct
ion
[m
ole
kW
h-1
]
O* radical yield as function of voltage and pulse width. The rise rate of the pulses was
fixed 2.2-2.7 kV/ns. DC bias: 0-20 kV.
• 7.0 mole/kWh corresponds to 5.3 eV/molecule.
• Theoretical cost to produce an O* radical is 3 eV.
• Thus more than half of the available energy is used to produce O* radicals
• Excellent yield.

20
Quantification of O-radical yields - iii
• Primary better than secondary streamers
• Primary yield increases if velocity is increased (because local E-field increases and consequently so does the electron energy)
0
2
4
6
8Primary
Secondary
0 0.5 1.0 1.5 2.0 2.5
Velocity [106 m s-1]
O* pr
oduc
tion
[mol
e kW
h-1]
O* radical yield for primary and secondary cathode directed streamers as a function of the primary streamer velocity. The error bars
indicate the standard deviation.

21
Quantification of O-radical yields - iv
• Negative polarity better for radical production
• However, matching is worse for negative polarity
0
2
4
6
8
10
12
0 0.5 1.0 1.5 2.0 2.5
Velocity [106 m s-1]
Primary CDSSecondary CDSPrimary ADSSecondary ADS
O* ra
dic
al y
ield
[m
ole
kW
h-1
]
O* radical yield of primary and secondary streamers as function of the primary
streamer velocity. Results for ADS and CDS.

22
Reactor–modulator matching - i
-20
0
20
40
60
80
100
0 50 100 150 200
Time [ns]
Vo
ltag
e [
kV]
-200
800
Cu
rre
nt
[A]
Voltage
Current
600
400
200
0
1000
a)
0
0.25
0.50
0.75
1.00
0 50 100 150 200
Time [ns]
Volta
ge
Cu
rre
nt-1
[k
]
63 kV67 kV70 kV74 kV82 kV
b)
0
0.25
0.50
0.75
0 50 100 150
Time [ns]
1.00
200
Vo
ltag
e C
urr
en
t-1 [k
] 63 kV
67 kV70 kV74 kV82 kV
c)
Calculations of load impedance, with peak voltages as indicated. The pulse width was 110 ns for all shown
results. a) Typical voltage and current waveform. b) Load impedance as determined by dividing reactor voltage by
the total current. c) Load impedance when using the plasma current only. The crosses indicate the moment the primary streamers have crossed the reactor-gap.
23
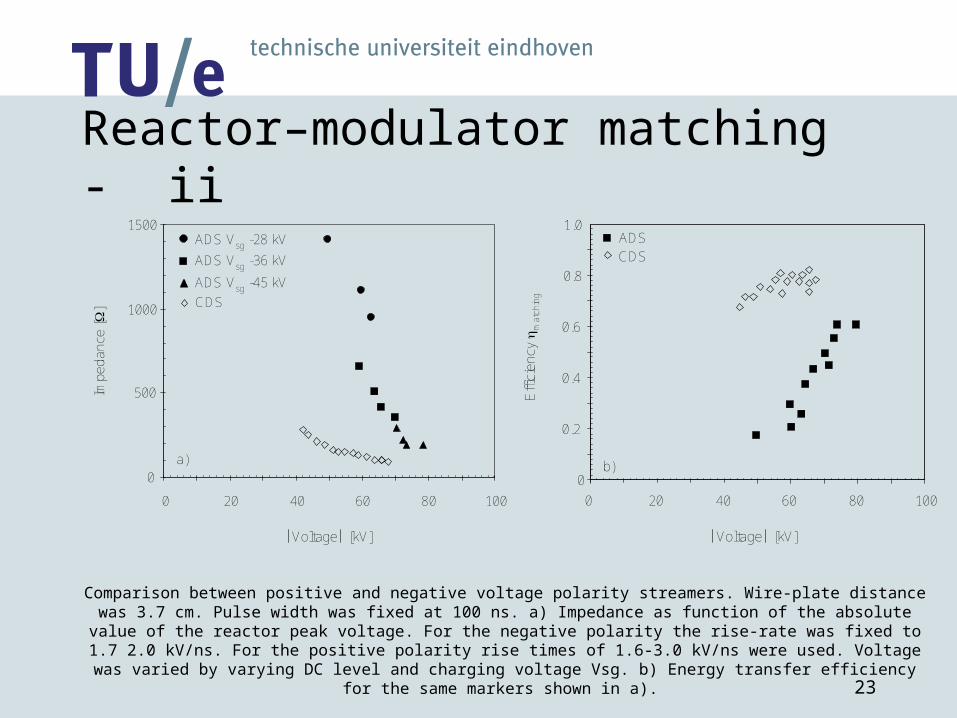
Reactor–modulator matching - ii
0
500
1000
1500ADS Vsg -28 kV
ADS Vsg -36 kV
ADS Vsg -45 kV
CDS
Imp
ed
an
ce [
]
0 20 40 60 80 100
Voltage [kV]
a)
0
0.2
0.4
0.6
0.8
1.0ADSCDS
0 20 40 60 80 100
Voltage [kV]E
ffic
ien
cy
ma
tch
ing
b)
Comparison between positive and negative voltage polarity streamers. Wire-plate distance was 3.7 cm. Pulse width was fixed at 100 ns. a) Impedance as function of the absolute value of the reactor peak voltage. For the negative
polarity the rise-rate was fixed to 1.7 2.0 kV/ns. For the positive polarity rise times of 1.6-3.0 kV/ns were used. Voltage was varied by varying DC level and charging voltage Vsg. b) Energy transfer efficiency for the same markers shown in
a).

24
Quantification of O-radical yields - v
0 2 4 6 8
O-radical yield (mole/kWh)
Pulsed
AC/DC
AC ?

25
Efficient streamer plasma generation
• Power sources for streamer plasma generation• Streamer observations• Quantification of radical yields• Discussion

26
Discussion - i
• Primary streamers more efficient for radical production. Due to larger local electric field ?
• Better radical production yield for fast primary streamers. Due to larger local electric field ?
• Why are negative corona’s so efficient ?

27
Discussion - iiExample of streamer branching and streamer interconnecting
plat
e
wire
sup
port
wire
sup
port
b)a)
57 mm 37 mm
50 m
m
50 m
m
a) b)
Pulse width 100 ns, rise rate 1.5 kV/ns, peak voltage +45 kV (no DC bias).
Pulse width 100 ns, rise rate 2.3 kV/ns, peak voltage -79 kV (-15 kV DC bias).