1 economics of early education benefits and costs of quality early education for all presentation to...
TRANSCRIPT

1
Economics of Early Education
Benefits and Costs of Quality Early Education for All
Presentation to the Pre-Kindergarten Education Study Committee
Vermont General Assembly
October 27, 2006W. Steven Barnett, Ph.D.
National Institute for Early Education Researchwww.nieer.org

2
Impacts of Quality Early Education
Increased Educational Success and Adult Productivity Achievement test scores Special education and grade repetition High school graduation Behavior problems, delinquency, and crime Employment, earnings, and welfare dependency Decreased Costs to Government Schooling costs Social services costs Crime costs Health care costs (teen pregnancy and smoking)

3
Randomized Trials
Long Term Perry Preschool, IDS, Early Training Project Abecedarian, Milwaukee, CARE IHDP (not Disadvantaged), Houston PCDC Mauritius Preschool Study
Short Term National Early Head Start National Head Start Many smaller scale studies

4
Quasi-Experimental Studies: Follow-up Into School Years Chicago Child Parent Center Study (12th grade) Michigan School Readiness (4th grade) South Carolina Pre-K (1st grade) New York Pre-K (3rd Grade) Ludwig & Miller Head Start (12th grade +) RAND National study of 4th grade NAEP Belfield & Schwartz ECLS-K (5th grade) Cost Quality and Outcomes (3rd grade) Vandell NICHD Early Care and Education Early Provision of Preschool Education (England)
5
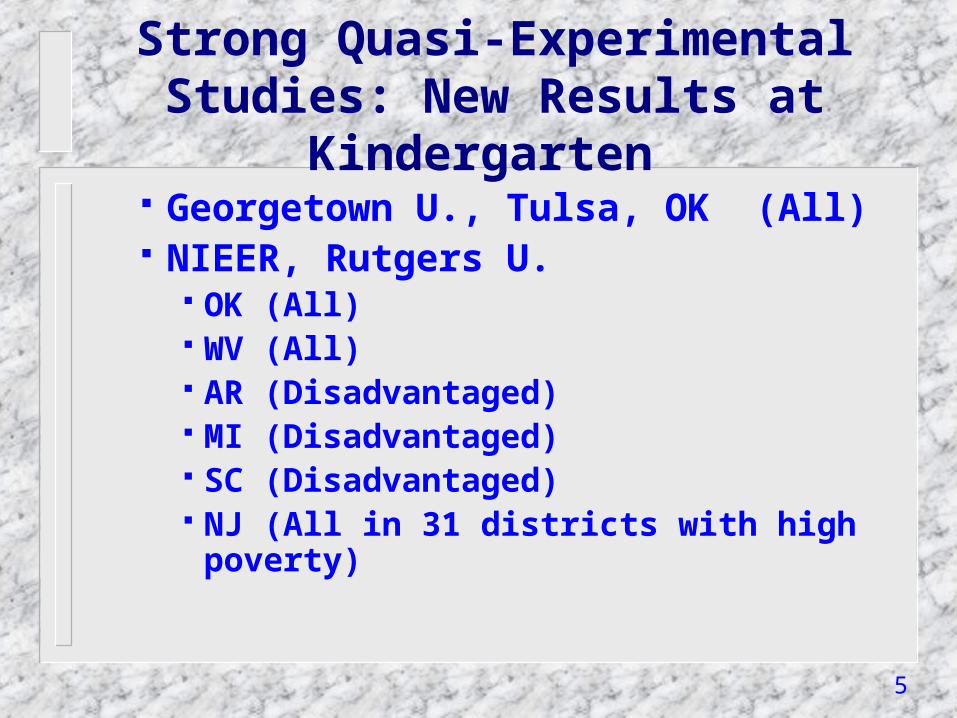
Strong Quasi-Experimental Studies: New Results at Kindergarten
Georgetown U., Tulsa, OK (All) NIEER, Rutgers U.
OK (All) WV (All) AR (Disadvantaged) MI (Disadvantaged) SC (Disadvantaged) NJ (All in 31 districts with high poverty)
6
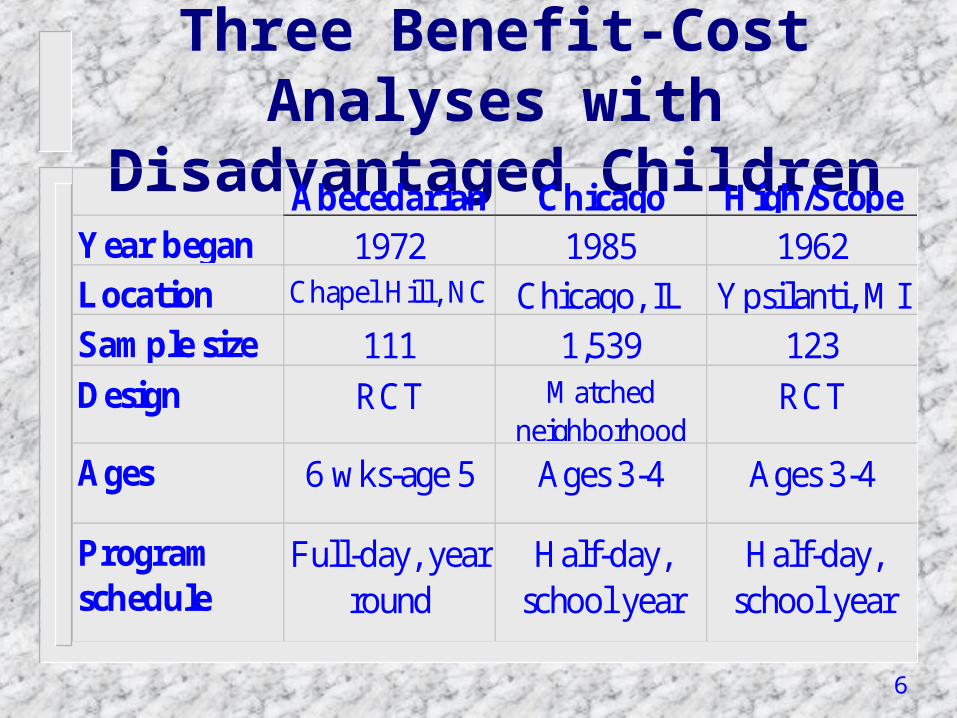
Three Benefit-Cost Analyses with Disadvantaged Children
Abecedarian Chicago High/Scope Year began 1972 1985 1962Location Chapel Hill, NC Chicago, IL Ypsilanti, MISample size 111 1,539 123Design RCT Matched
neighborhoodRCT
Ages 6 wks-age 5 Ages 3-4 Ages 3-4
Program schedule
Full-day, year round
Half-day, school year
Half-day, school year

7
High/Scope Perry Preschool: Educational Effects
45%
15%
34%
66%
49%
15%
0% 10% 20% 30% 40% 50% 60% 70%
Graduated from highschool on time
Age 14 achievementat 10th %ile +
Special Education(Cog.)
Program groupNo-program group

8
High/Scope Perry Preschool: Economic Effects at Age 27
20%
13%
7%
41%
36%
29%
0% 10% 20% 30% 40% 50%
Never on welfare asadult
Own home
Earn $2,000 +monthly
Program group
No-program group

9
High/Scope Perry Preschool: Economic Effects at 40
Source: Schweinhart et al., 2005
50%
62%
40%
76%
76%
60%
0% 10% 20% 30% 40% 50% 60% 70% 80%
Had SavingsAccount
Employed
Earned > $20K
Program groupNo-program group
10
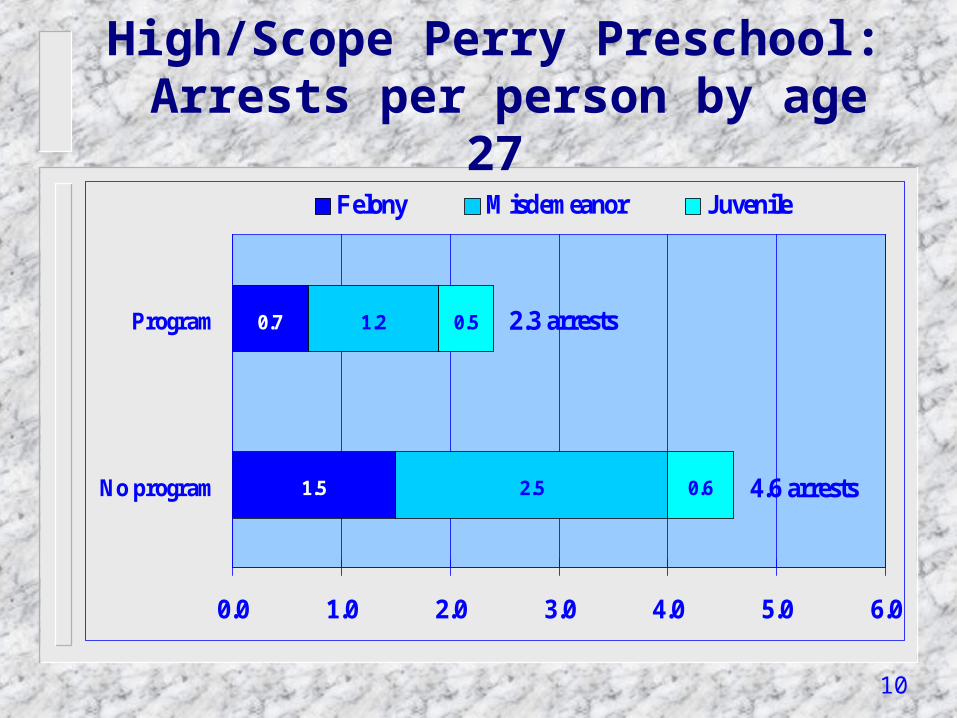
High/Scope Perry Preschool: Arrests per person by age 27
1.5
0.7
2.5
1.2
0.6
0.5 2.3 arrests
4.6 arrests
0.0 1.0 2.0 3.0 4.0 5.0 6.0
No program
Program
Felony Misdemeanor Juvenile

11
Perry Preschool: Crime Effects at 40Source: Schweinhart et al. 2005
34%
48%
55%
14%
33%
36%
0% 10% 20% 30% 40% 50% 60%
Drug Crime
Violent Crime
Arrested > 5X
Program group
No-program group

12
Abecedarian : Academic Benefits
13%
51%
55%
48%
36%
67%
31%
25%
0% 10% 20% 30% 40% 50% 60% 70% 80%
4 Yr College
HS Graduation
Grade Repeater
Special Education
Program groupNo-program group

13
80
85
90
95
100
105
8 10 12 14 16 18 20 22
AGE (Years)
RE
AD
ING
SC
OR
E
TREATMENT
CONTROL
Abecedarian Reading Ach. Over Time

14
80
85
90
95
100
105
8 10 12 14 16 18 20 22
AGE (Years)
MA
TH
SC
OR
ES
TREATMENT
CONTROL
Abecedarian Math Achievement Over Time

15
Chicago CPC: Academic and Social Benefits at School Exit
25%
38%
25%
39%
17%
23%
14%
50%
0% 10% 20% 30% 40% 50% 60%
Juvenile Arrest
Grade Repeater
Special Education
HS Graduation
Program groupNo-program group

16
Economic Returns to Pre-K for Disadvantaged Children
Cost Benefits
B/C
Perry Pre-K $16,264 $277,631 17.07 Abecedarian $36,929 $139,571 3.78 Chicago $ 7,417 $ 52,936 7.14

17
Perry PreschoolCosts Benefits
Crime$173,959
Employment$79,743
Child Care$919 Welfare
$774K-12 Schooling
$8,556
Program Cost$15,386
18
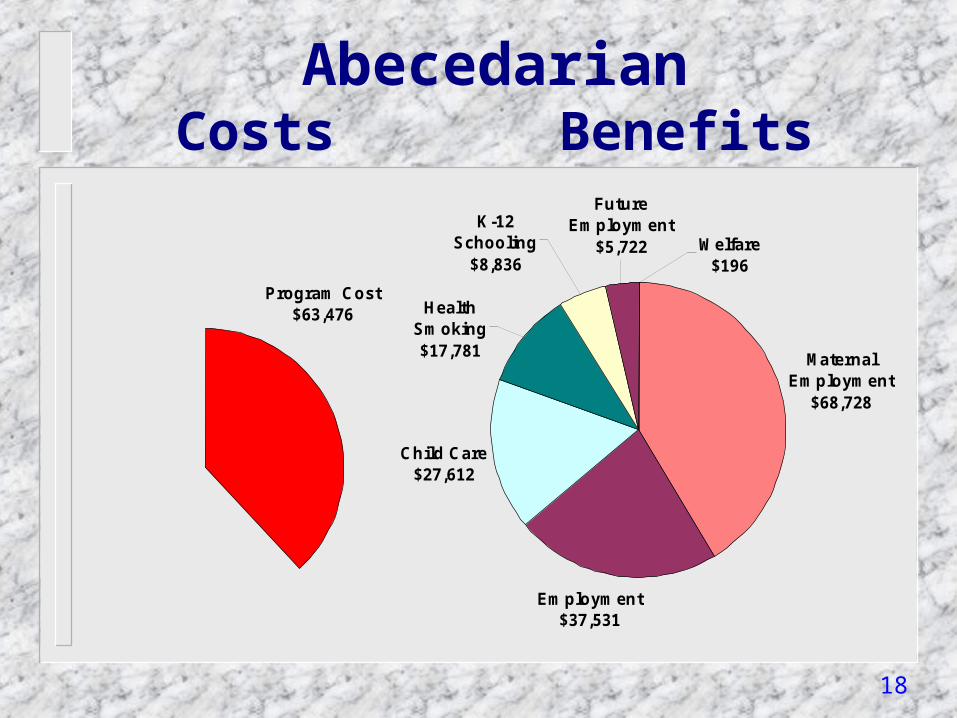
AbecedarianCosts Benefits
Program Cost$63,476
Maternal Employment
$68,728
Employment$37,531
Child Care$27,612
HealthSmoking$17,781
K-12 Schooling
$8,836Welfare
$196
Future Employment
$5,722

19
Chicago CPCCosts Benefits
Employment$31,459
Crime$15,023
K-12 Schooling$5,521
Abuse/Neglect$338
Welfare$535Child Care
$1,878Program Cost
$7,584

20
Could Universal Pre-K Produce Similar Benefits for the Middle Class?
Middle class children have fairly high rates of the problems that preschool reduces for low-income children.
Reducing these problems could generate large benefits.
Income Retention DropoutLowest 20% 17% 23%20-80% 12% 11%Highest 20% 8% 3%
Source:US Department of Education, NCES (1997). Dropout rates in the United States: 1995. Figures are multi-year averages.

21
Access to Any Pre-K or Child Care Center

22
Cognitive Readiness Gap—Half as Big at Median as for the Poor (bottom 20%)
Abilities of Entering Kindergarteners by Family Income--National Data, Fall 1998 (reported by NIEER from ECLS-K)
40.0
45.0
50.0
55.0
60.0
Low est 20% 2nd Low est20%
Middle 20% 2nd Highest20%
Highest 20%
Reading
Math
GeneralKnowledge
School Readiness Gap
Abilities Scores
FamilyIncome
23
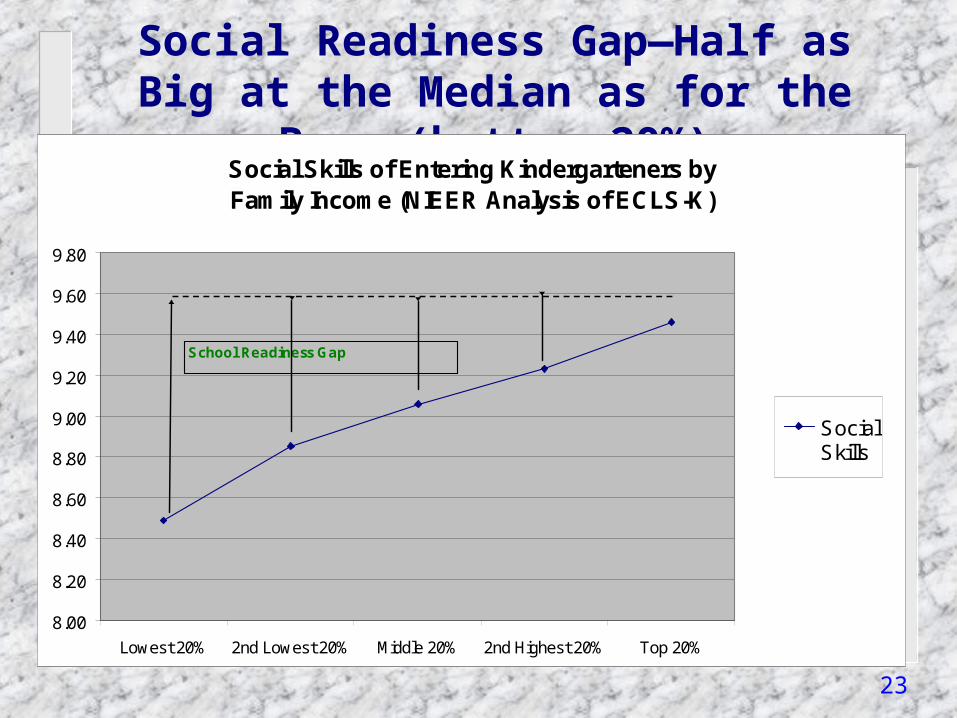
Social Readiness Gap—Half as Big at the Median as for the Poor (bottom 20%)
Social Skills of Entering Kindergarteners by Family Income (NIEER Analysis of ECLS-K)
8.00
8.20
8.40
8.60
8.80
9.00
9.20
9.40
9.60
9.80
Lowest 20% 2nd Lowest 20% Middle 20% 2nd Highest 20% Top 20%
SocialSkills
School Readiness Gap
Social Scores
FamilyIncome

24
Effects of Today’s Programs
New rigorous studies Large scale public (Head Start & State) One year of quality public Pre-K at 4 Effects of policy at entry to Kindergarten Universal and targeted programs Standardized tests Estimate effects by income and ethnicity

25
Oklahoma’s Pre-K for All
3,028 children in Tulsa public schools Rigorous RD design Gains for all SES & ethnic groups Literacy and Math gains
Smaller than Perry and Abecedarian Similar to CPC
Larger gains for minority and poor children
Source: Gormley et al. (2004). CROCUS/Georgetown University

26
NIEER Evaluation of 6 State Pre-K Programs
Over 6,000 children in 6 States OK and WV are for all children NJ for all children in 31 districts AR, MI, & SC targeted Gains from Pre-K in all 6 states Gains in language, literacy & math All children gain, low-income gain more Source: Barnett et al. (2005). NIEER/Rutgers University, plus new AR report.

27
Oklahoma 4th Grade NAEP Scores Before and After Pre-K for All
YEAR White Black Hisp. Indian
2002 Reading 220 188 197 209
2003 Reading 220 195 200 206
2005 Reading 219 196 204 211
2000 Math 229 205 207 221
2003 Math 235 211 220 225
2005 Math 240 217 226 229
Reading gains are not statistically significant; math gains are statistically significant for Whites and Hispanics (2000-05).
28
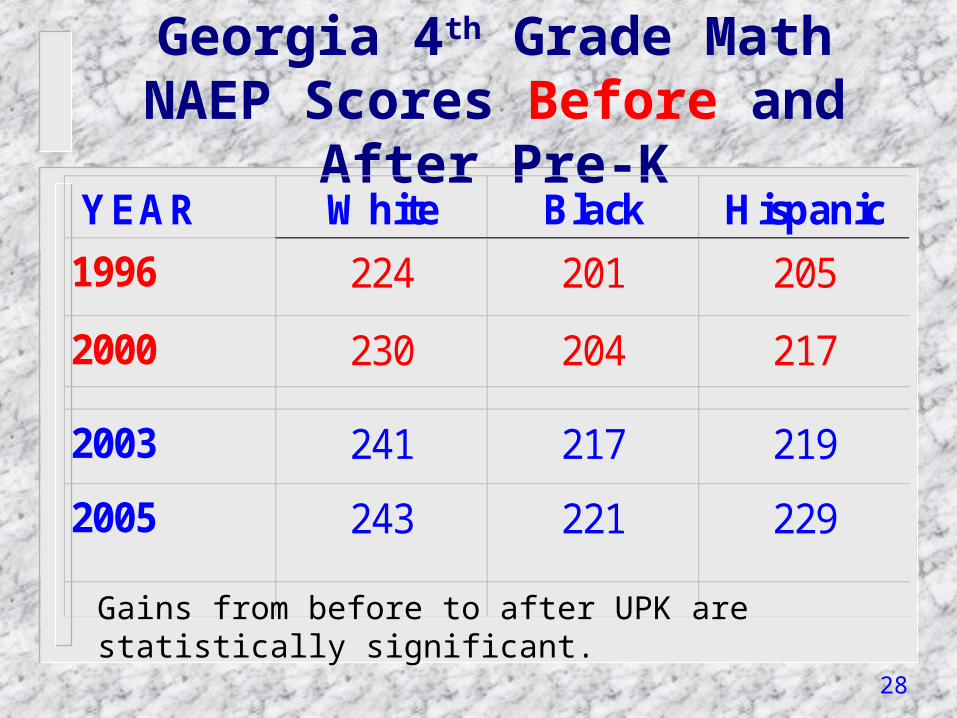
Georgia 4th Grade Math NAEP Scores Before and After Pre-K
YEAR White Black Hispanic
1996 224 201 205
2000 230 204 217
2003 241 217 219
2005 243 221 229
Gains from before to after UPK are statistically significant.

29
Georgia 4th Grade Reading NAEP Scores Before and After Pre-K
YEAR White Black Hispanic
1998 221 191 Not Avail.
2002 226 200 200
2003 226 199 201
2005 226 199 203
Gains from 1998 to 2005 are statistically significant.
30
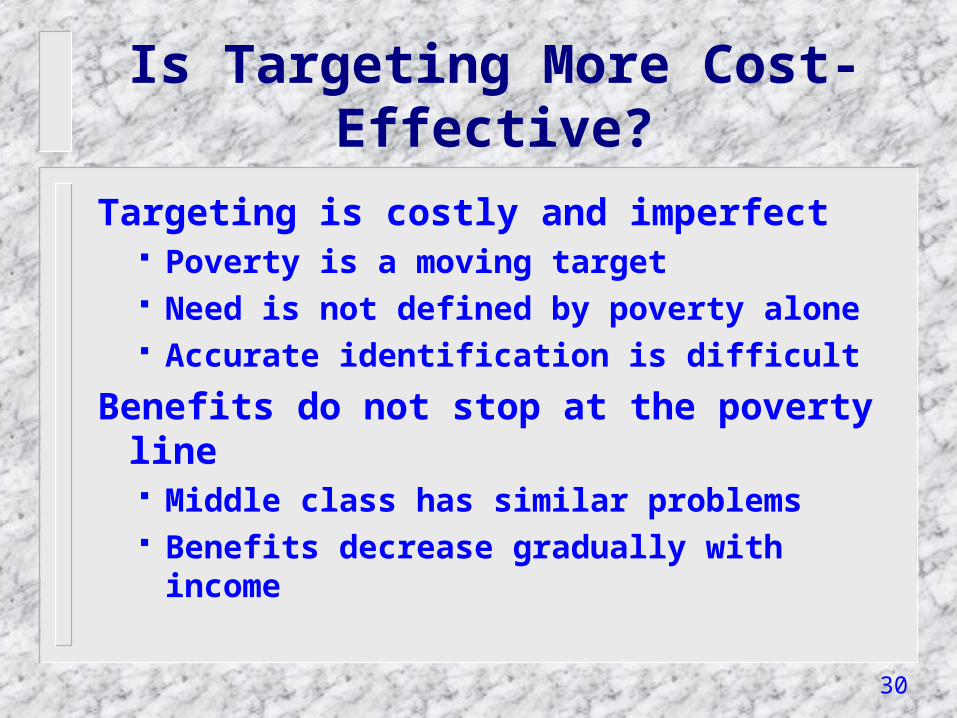
Is Targeting More Cost-Effective?
Targeting is costly and imperfect Poverty is a moving target Need is not defined by poverty alone Accurate identification is difficult
Benefits do not stop at the poverty line Middle class has similar problems Benefits decrease gradually with income

31
Comparing Targeted Pre-K and Pre-K for All
Targeted Pre-K has Lower CostPre-K for All Children:
Reaches all disadvantaged childrenProduces larger gains for disadvantagedProduces good gains for childrenYield larger net benefits
Source: Barnett (2004). Maximizing returns from pre-kindergarten education. Federal Reserve Bank of Cleveland Research Conference.
32
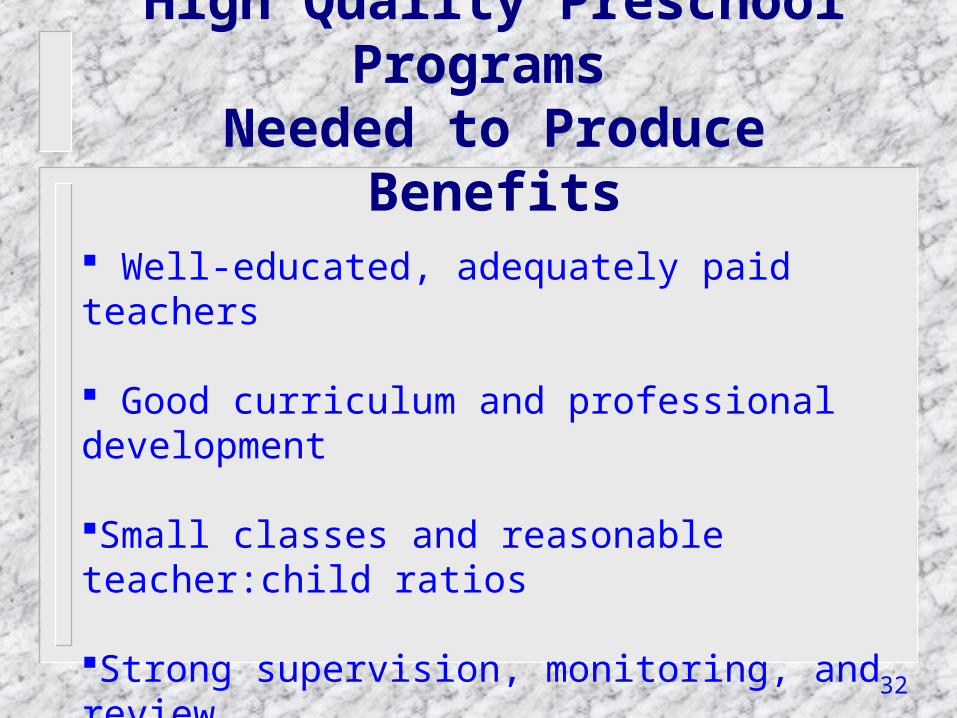
High Quality Preschool Programs Needed to Produce Benefits
Well-educated, adequately paid teachers
Good curriculum and professional development
Small classes and reasonable teacher:child ratios
Strong supervision, monitoring, and review
High standards and accountability

33
Conclusions
Preschool can be a sound investment
High quality is needed for high returns
High standards and adequate resources are necessary but not sufficient
Plan-Do-Review is also needed
Universal can be more cost-effective