1 economics as a social science
TRANSCRIPT

© Pearson Education Ltd 2018. Copying permitted for purchasing institution only. This material is not copyright free.
1 Economics as a social science Activity 1
Positive statements include those that are verifiable such as ‘one physician for every 1,800 people’ or ‘1.4 per cent of GDP is spent on public health’. Normative statements are value judgements and include, ‘The majority of the Indian population is truly disenfranchised’, or ‘Public healthcare is completely broken’.
Exam practice
(a) A positive statement can be proven to be true or false and relies on verifiable evidence. The article states that India’s current spending on education is 3.8 per cent of its Gross Domestic Product (GDP). This is contrasted with other countries such as Germany, which spends 5.9 per cent of its GDP on education. The article also states that only 4.7 per cent of the labour force has any formal training. Both these statements are positive because they can be verified.
By contrast, it states that India could become a major supplier of skilled and qualified workers. This may, or may not, turn out to be true, the point is that however worthy an aim it may be, it is not verifiable by rational analysis. It also states that some teachers do not come up to standard but no evidence of this is offered. Therefore, both of these statements can be said to be normative ones.
(b) Spending on education can take the form of building more schools, employing more teachers and providing better equipment. It is likely that this will improve the standards of education and training in India. This will benefit Indian firms who will gain a more efficient and productive workforce. The products and services they produce will be more competitive, leading to higher sales and profits. The economy will see an increase in output or GDP and tax revenues, enabling the government to expand its spending programmes. The workers themselves are likely to earn more money, leading to increased expenditure and more demand for goods and services, once again stimulating GDP.
However, increased spending on education must be funded and this may mean spending in other areas has to be cut; this could have a detrimental effect elsewhere, if for example, healthcare or housing are cut. Increased spending on education does not guarantee it will be effective. It depends on how the money is spent and by how much it is increased. It will also take time for the benefits to appear.
2 The economic problem Activity 1
Nearly all resources are scarce and are called economic goods. A free good, in contrast, is one that is not scarce. Congestion is an indication that road space is scarce. There are too many cars on the road to allow motorists to proceed at the speed they want. Equally, car exhaust pollution leads to problems such as acid rain and climate change. Both of these environmental problems lead to resources having to be allocated to counteract their effects. Roads also have to be built using scarce resources. If fewer roads were built, more could be

© Pearson Education Ltd 2018. Copying permitted for purchasing institution only. This material is not copyright free.
spent on, say, the public transport system. Hence, in these senses, roads are not a ‘free good’.
However, there are times of the day on particular roads when motorists are not adversely affected by the presence of cars. When driving a car at 6 o’clock in the morning in a rural area, there is arguably no cost to other drivers. So, in this sense, roads could be argued to be a ‘free good’.
Most motorists implicitly assume that roads are free goods and fiercely defend their right to use roads at any time of the day without paying a toll. Hence, road tolls are deeply unpopular. When discussing the issue, private motorists seem to put no value on time lost due to slower speeds or being stationary in a traffic queue. However, even if the time of private motorists is costless, that of commercial traffic, such as lorries and taxis, is not. Road congestion is therefore an economic issue involving ‘economic goods’ rather than free goods.
Activity 2
The minimum human needs of a teenager in the USA today could include material goods, such as shelter, clothing and food and drink, and psychological and emotional needs, such as love and self-esteem. The basic human needs of a teenager living in Ethiopia might be little different. However, the exact form of material need may be different. For example, the Ethiopian teenager may need to have a higher liquid intake in order to survive because of the hotter weather, while a person living in England may need a house designed for colder weather.
The ways in which the need is fulfilled will also differ. American teenagers may satisfy their need for entertainment by using Facebook or watching a film. In contrast, the Ethiopian teenager in the photograph may be more concerned with basic needs, such as collecting wood for burning for cooking.
Activity 3
(a) It is the next best thing that the parents might have spent the money on instead; this may have been on helping to buy a bigger house or a new car. It does not matter what it is, but for each set of parents it is what they have had to do without in order to fund their child’s education.
(b) It is the next best thing that the student could have done with that time instead of going to a university or college. It might have been starting to work and gaining valuable experience, or travelling, or developing a skill or talent.
Activity 4
(a) A wide variety of goods and services are produced by households. For instance, many services are produced which are connected with eating. Shopping, storage of food, preparation of food, serving of food and washing up after a meal are examples. The household also provides accommodation services. Fixed capital, such as room space, furniture and appliances, yields services. So, too, does household labour, when beds are

© Pearson Education Ltd 2018. Copying permitted for purchasing institution only. This material is not copyright free.
made or rooms are cleaned. The household economy may also provide transport services. The person who drives the household car is effectively acting as a DIY chauffeur. When parents collect children from a party or drive them to school they are acting as a taxi driver. All forms of DIY activity create goods or services for the household economy. The household is also likely to provide services to the wider economy, mainly in the form of the hire of labour to an outside employer.
(b) Any production must be the result of the use of one or more of the factors of production. When cleaning a room, labour is combined with capital in the form of dusters, mops, brooms or vacuum cleaners, for instance. In many households, more and more capital is now being combined with labour to provide services. Nearly all households have cookers, washing machines and refrigerators, while increasingly they own freezers, microwave ovens and dishwashers. Traditionally, there tended to be a division of labour based on male and female roles. The man provided services outside the home in return for a wage. He mowed the lawn, maintained the car and carried out DIY around the house. The woman brought up the children, did the cooking and cleaned the house. The children might have tidied their bedrooms, done some washing up and cleaned the car. Over the past few decades, this traditional division of roles has been changing in many cultures. There are now far greater similarities in the work roles of men and women. Of course, people living on their own would provide all services themselves.
(c) Some services are usually provided for all family members. For instance, traditionally meals have been prepared for all family members to eat at the same time. The greater availability of convenience food, an increase in ‘eating out’, ordering via phone or email and home delivery of food, and the variable nature of work and leisure activities means that this is less common today. Other services are provided for individuals. For instance, if you make your own bed or tidy your own room you are providing a service for yourself. Other services might be provided for groups of individuals. For instance, your mother might drive herself and your father to a restaurant.
(d) Many answers are possible here. But you may feel, for instance, that your father should do more household chores or that your younger brother or sister should do more washing up. Equally, you may feel that your mother should provide a more frequent taxi service for your hectic social life. Changes which are made to the organisation of the household economy should, however, either be aimed at improving its efficiency or producing a more equitable allocation of work and resources.
Exam practice
1. D – what is to be produced, how it is to be produced and for whom it is to be produced.
2. The benefits foregone of the next best alternative.
3. Both the UK and the US government face the problem of scarcity. Neither government can afford to pay for all the needs and wants of the people. Spending in one area means less is available to fund other projects, therefore the government must make choices as to where to spend its scarce resources.
4.(a) The US government wants to spend US$54 billion on defence but it only has a certain amount of tax revenue available. If it wishes to follow this course, then spending must be reduced elsewhere. In the article it suggests that this may be from the foreign aid and environmental budgets.

© Pearson Education Ltd 2018. Copying permitted for purchasing institution only. This material is not copyright free.
(b) NICE (the National Institute for Health and Care Excellence) is responsible for deciding which drugs should be made available on the NHS. Funding is limited, and it is the responsibility of NICE to make difficult choices and decide which drugs will be provided by the government and which ones will not be.
(c) If the US government increases defence spending the opportunity cost is money that would have been spent on the environment. For the National Health Service in the UK, continued spending on the health service means that the opportunity cost is other drugs, such as Zytiga R for prostate cancer and Kadcyla R for breast cancer, which have to be sacrificed.
(d) Normative economics involves making value judgements. In the passage, Donald Trump is willing to cut government spending on the environment as he does not believe it to be of major concern. His critics have different values and argue that the environment budget should be protected. NICE attempts to use positive decision-making techniques by taking into consideration cost and the needs of different groups of users and allocating resources as ‘fairly as possible’.
3 Production possibility frontiers Activity 1
(a)(i) 45 units.
(ii) 0 units.
(b)(i) 15 units of manufactured goods.
(ii) 30 units of manufactured goods.
(c)(i) 5 units of manufactured goods.
(ii) 20 units of manufactured goods
Activity 2
(a)
Figure 1

© Pearson Education Ltd 2018. Copying permitted for purchasing institution only. This material is not copyright free.
Note that in Figure 1, Point C could be to the left or right of the production possibility frontier PP, but must not be to the right of the original frontier (AA). The production possibility frontier PP is drawn parallel to the original production possibility frontier in Figure 1 but does not have to be.
(b)
Figure 2
Exam practice
1. A production possibility frontier shows the different combinations of goods that an economy could produce if all resources were fully employed in the economy. It therefore shows the maximum amount of output that could be produced with the resources available. For instance, in Figure 3 below, assume that the production possibility frontier for the economy is PQ. It could, therefore, produce no military services at all and devote all its scarce resources to producing 0P of all other products. Alternatively, it could be at A, producing 0S of all other products and 0X of military services. Other possible combinations of products include those at point B and producing 0Q of military services and no other products.
Figure 3

© Pearson Education Ltd 2018. Copying permitted for purchasing institution only. This material is not copyright free.
2. In most circumstances today, economies grow over time. Workforces become more productive because they are better educated. The amount of capital involved in production increases. Technological progress enhances the productivity of new capital compared to the capital it replaced. Economic growth is shown by a shift in the PPF outwards to the right. In Figure 4, this is shown by a shift in the PPF outwards, to the right, from, for example, PQ to TU. China provides an example of a country that has grown quickly since the mid-1970s. During this time, it had a ‘relatively well-educated workforce’ that allowed increases in labour productivity. There was a ‘considerable flow of investment money and technological know-how into China’ that increased the stock of physical capital and allowed for technological progress. The legal environment also changed as Chinese people were allowed to ‘set up their own businesses in a more free market style economy’. This led to a growing private sector that was able to exploit China’s growing links with the global economy.
However, production possibility frontiers will shrink inwards if the amount and quality of resources are reduced. In Figure 4, this would be shown by a shift, for example, from PQ to MN. The Civil War in Syria provides a good example of how a PPF can shrink. The workforce has shrunk as war has killed, injured and displaced millions of people. Education, vital to the future growth of the economy, has been badly affected as ‘thousands of schools have been destroyed or are being used as shelter for displaced persons’. Factories and offices have been destroyed. Trade has been disrupted as foreign countries imposed export bans on trade with Syria. There has also been a shift towards armaments production at the expense of civilian production. This will have reduced the investment needed to replace existing physical capital coming to the end of its useful life.
Figure 4
3. Not replacing its fleet of nuclear submarines (known as Trident) could have significant economic implications for the UK. Trident has an opportunity cost – the benefits foregone from the next best alternative. This could be other military spending such as military equipment or employing more military personnel. It could be other types of government spending, such as on health or education, or the money saved could be used to cut taxes, increasing the after-tax income of households or firms to spend on consumption or investment goods. These choices will affect the production possibility frontier of the UK economy and have implications for current welfare and future growth of the economy.

© Pearson Education Ltd 2018. Copying permitted for purchasing institution only. This material is not copyright free.
Assume in Figure 5 that the production possibility frontier of the economy is PQ. If Trident is not replaced but the money is used instead to increase spending on other military spending, then the production possibility frontier of the economy in Figure 5 will remain unchanged. The same volume of military services will be produced although its composition will be different. However, if the money saved is used to increase spending on civilian projects, such as more healthcare or more leisure services, then the point of production on the production possibility frontier will change. Assume that currently the economy produces at point X. The shift away from military spending towards civilian spending will move the point of production from X to, say, Y. AB represents the estimated £25 billion loss of military spending because Trident has been scrapped, while CD represents the increase in civilian spending as a result.
Figure 5
Leaving the position of the production possibility frontier unchanged assumes that scrapping Trident does not lead to an increase in investment. However, assume that the £25 billion saved from the Trident project is spent on public sector capital goods such as new roads and schools or private sector capital goods such as new offices and production facilities or equipment rather than consumption goods. Initially, the position of the production possibility frontier will remain unchanged although production will change from, say, point X to point Y. In the long term, however, increased investment will shift the production possibility frontier to the right from PQ to, say, RS. In the long term, production could change from point Y to a point such as Z on the new higher production possibility frontier. The £25 billion could be spent on a combination of capital and consumption goods. In general, the more that is spent on capital goods, the larger will be the shift in the production possibility frontier.
However, scrapping Trident may have other consequences. Scrapping the Trident programme will mean that the existing infrastructure which supports the current Trident submarines will become redundant. So too will the workers associated with the Trident programme. In the short term, this is likely to cause unemployment. The economy will therefore operate within its production possibility frontier, for example at point E in Figure 5. If the highly skilled workers and facilities associated with Trident find no employment in the long term, this could shift the production possibility frontier back towards the origin. This is shown in Figure 6. Before the scrapping of Trident, the economy’s production possibility frontier was PQ. Now it is PR. The economy can produce the same number of non-military goods but fewer military goods.

© Pearson Education Ltd 2018. Copying permitted for purchasing institution only. This material is not copyright free.
The peace group would most likely argue that the best use of scarce resources would be to scrap Trident and devote the resources to non-military uses. The military and some politicians might be split about whether to proceed with Trident or reallocate the resources to other military purposes. Ultimately, the decision should be about whether the defence of the country needs Trident and whether there would be any increase in national security if the money were spent on other military materials. If the decision were to be to scrap Trident and reduce military spending, should the resources be allocated for present consumption or increased future consumption? The negative effects of possible increased unemployment also need to be taken into account. Overall, there is unlikely to be any consensus about which alternative to take because it depends on the costs and benefits that individuals and institutions place on the different alternatives.
Figure 6

© Pearson Education Ltd 2018. Copying permitted for purchasing institution only. This material is not copyright free.
4 Specialisation and the division of labour Activity 1
(a) Specialisation involves economic units concentrating on particular activities. In the photograph, a garment-manufacturing factory is shown. Materials, such as cloth, thread and buttons, are combined to produce a completed garment. Specialised machinery, such as sewing machines, are used. Workers have particular skills that they employ to make garments.
Specialisation requires that goods and services be traded. For example, workers trade their time at work for food and other products. The garment manufacturer trades its finished products for money that it then uses to buy cloth, pay the wages of workers and give a profit to the owners of the firm.
(b)(i) Firms are likely to benefit in a number of ways from specialisation. Workers who make garments become highly skilled by constantly carrying out the same activity. Repetition of tasks speeds up the rate of work and reduces errors. Workers are able to use specialised machinery, such as sewing machines. The layout of the factory should help reduce the amount of time spent making each garment. Greater efficiency enables firms to compete in the marketplace. The more efficient a firm, the more likely it is to win orders and make a profit.
(ii) Specialisation can give rise to disadvantages for firms. Workers may become bored carrying out the same job, which can affect their motivation, attendance and concentration. If there is a breakdown in a piece of specialised machinery, such as a sewing machine, it can bring work to a halt for an employee. If, say, there is an electricity disruption, work in the whole factory could halt. A small group of workers may equally have the power to bring all production to a halt if they strike in pursuit of their demands. It may not be possible to transfer workers with specialised skills from one job to another if work needs to be done in a different area. Specialisation may, therefore, add to costs of production unless work is organised relatively efficiently and there are relatively few interruptions to the working system.
Activity 2
(a) The buyers in the local Cochem market for grocery products are likely to be mainly individual households who live either in the town or within easy travelling distance of it, or workers who have jobs in the town. There may also be some purchases from local businesses, but this is likely to be very small. The sellers in the local market are the independent grocer, the convenience store and the two supermarkets. In addition, some supermarket chains may deliver to the area from online orders. There may also be a once or twice a week traditional market where sellers hire stalls.
(b)(i) Meat and vegetables are complementary products. Shoppers who buy meat in the town are also likely to buy their vegetables locally. An increase in demand for meat, for example because more people have moved into the area, is likely to raise the demand for vegetables and vice versa. The supermarkets in Cochem will sell both meat and vegetables under one roof, encouraging customers to buy them together.
(ii) Petrol will be needed by any buyer who used a car to go to the Cochem shops. Petrol would then be said to be in derived demand from vegetables. Equally, the shops in Cochem

© Pearson Education Ltd 2018. Copying permitted for purchasing institution only. This material is not copyright free.
have to have their vegetables delivered to their premises, so deliveries require petrol. Again, petrol is in derived demand from vegetables.
Activity 3
All three pictures show items of value but would not all necessarily be classed as ‘money’. The bank notes are a recognised form of currency, but the other photos show items that hold a financial value yet are not directly classified as money.
Activity 4
• Sayed Yazdani has EGP250 in a savings account. This is considered to be near money.
• He owns an EGP270,000 apartment in Cairo but owes EGP150,000 in the form of a mortgage loan. Although this is an asset with a net worth of EGP120,000, it is not easily converted into money. It would take time to find a buyer and arrange a sale and then there is the problem of where to live. Therefore, this is not money.
• His current account at his bank is in credit by EGP1500 and he has an overdraft facility of EGP1000. This can be turned into money very easily.
• In his wallet he has EGP100 in cash, which is money. • He has recently purchased EGP100 worth of goods using his credit card. His credit
card limit is EGP3000. Credit cards are not money but money substitutes. In fact, his recent purchase means he will soon have to find EGP100 to pay off the loan.
Therefore, at the current time Sayed has EGP250 + 1500 + 1000 +100 = EGP2850
Exam practice
1. Metals and minerals such as copper, cobalt and rare earth elements need to be extracted from the earth by mining, which is part of the primary sector. These raw materials are then transformed into components such as batteries and display panels before being assembled into complete iPhones. The manufacturing process is part of the secondary sector. All over the world, distributors and retailers then provide the means by which consumers can buy one of the new phones. Distributors and retailers are part of the service sector.
2. Specialisation means that firms concentrate on one particular part of the production process, such as LG which makes the display panels and Sony which makes the cameras. By doing this, each firm becomes very efficient at what they do, they build up expertise and are able to use highly efficient specialised machinery and processes. Producing specialised components on a large scale reduces the average cost of each component. Apple could not do this all by themselves and they benefit from the supplying firms’ expertise and low prices, enabling them to produce their phones at the lowest cost.

© Pearson Education Ltd 2018. Copying permitted for purchasing institution only. This material is not copyright free.
5 Types of economy Activity 1
In a market economy, resources are partly allocated through the market mechanism. Markets bring together buyers and sellers. Consumers are buyers in the market, while firms are sellers. When firms sell products at a lower price, as in the sales on Black Friday, consumers buy and firms sell more products. The lower prices, therefore, act as signals to both consumers and firms.
However, government also has a place in a market economy. It provides a legal system within which buyers and sellers in a market must operate, for example. It also provides ways in which the legal system can be enforced. In the case of Black Friday, the government provided the police to stop the brawls that occurred at several Tesco stores in the Manchester area in the north-east of England. The government is also a major buyer of goods and services from firms. Police uniforms, for example, are bought from private sector suppliers. So too are the electricity and telephone services used in police stations, as well as the police cars that will have transported the police to the incidents in Manchester.
Activity 2
In a planned economy, resources are allocated by the state. Government bodies own the means of production. Planners decide what is to be produced, how it is to be produced and who will receive the subsequent output.
Markets, in contrast, allocate resources through the interactions of large numbers of buyers and sellers. For example, in planned economies, informal markets may arise where goods are produced and sold outside of the state planning system. During the North Korean famine in the 1990s, informal food markets arose in North Korea. These markets have grown in size providing ‘an estimated two-thirds of the population with their main source of income’ today. This growth in food markets is an example of North Korea’s move in a more market-orientated direction. So, too, has been the establishment of a ‘small number of Special Economic Zones, where foreign companies can set up and employ North Korean workers to produce goods for export’. In North Korea, industry is owned by the state. However, creating small areas of the country where private sector firms can produce is a move from a planned economy to a more market-orientated economy. The data reinforces this, when it is suggested that the North Korean government wants to ‘expand their number’, allowing a larger percentage of the total amount to be allocated via the market mechanism, rather than state planning.
Exam practice
1. In a free market economy, most resources are allocated through the market mechanism. The factors of production are mainly owned by private individuals and organisations, which are motivated by self-interest. They are free to buy and sell these at the best price. For instance, in the USA, workers offer themselves for hire. Workers with a low level of human capital earn relatively little. Workers with high levels of human capital earn many times more than those at the bottom of the income scale. Equally, the owners of capital, such as entrepreneurs and, indirectly, those with financial wealth, use or sell their capital to produce

© Pearson Education Ltd 2018. Copying permitted for purchasing institution only. This material is not copyright free.
profits, interest and other income. Capital and wealth are much more unevenly distributed between households than human capital. The combination of changes in demand and supply for labour and capital help to explain why, in the USA, the lowest income households have seen barely any change in their income since 1980, while the top 1 per cent have seen a 300 per cent increase.
Consumers are sovereign. Through their spending decisions, they determine what is to be produced. For instance, if US consumers prefer McDonald’s hamburgers to Jo’s hamburgers, then they will spend their money at McDonald’s, giving it the revenue and the profit to provide the service and expand their business. Jo’s business will be forced out of the market if it does not generate enough sales. However, consumers can only spend from their resources. Before the implementation of ‘Obamacare’, the poorest in society could not afford to buy healthcare, while the richest in society could afford to buy what they thought was the very best healthcare available.
The government has a role in providing the legal framework for the private sector to operate. It issues money. It also needs to provide a small range of goods and services, like defence, which would otherwise not be provided by the private sector. To finance this, it needs to collect taxes from the private sector.
2. Table 1 gives two indicators of economic growth. In the last column, annual percentage increases in GDP at purchasing power parities are given. Canada and the USA have the highest growth rates over the period 1971–2013, at 2.8 per cent per annum. The lowest average increase is Italy at 1.8 per cent. However, the other columns show annual percentage increases after changes in population have been taken into account. Despite immigration controls, the USA has experienced relatively high levels of immigration over the period. Larger numbers of immigrants mean more output and hence a higher GDP. All other things being equal, a country with a growing population will have a higher percentage increase in GDP than a country with a declining population.
Stripping out the effects of the population increase, the data for GDP per head shows there is almost no difference in growth rates between the USA and other industrialised countries. Over the period 1971–2013, for example, the UK, a mixed economy, had a marginally higher average annual growth rate per head of 1.9 per cent compared to the USA at 1.8 per cent. Over the period 2001–13, the country with the highest growth rate per capita was Sweden, at 1.2 per cent compared to 1.8 per cent for the USA. Overall, the free market economy of the USA has performed very similarly to the mixed economies of Europe on a per capita basis. There seems to be no correlation between the type of economy and growth rates per capita.
The distribution of income tends to be less equal in free market economies, such as the USA, than in mixed economies. The source gives no direct evidence of equality in mixed economies, such as the UK and Sweden. However, it points out that income and wealth is very unevenly distributed in the USA. For example, ‘according to the 2013 US census, half of all households earn $52,000 or less per year while one-fifth of households earn $22,000 or less’. What is more striking is the change in incomes over time between different groups of households. Since the 1980s, the bottom fifth of income households have seen almost no growth in their incomes. In contrast, the ‘top 1 per cent have seen their incomes rise by nearly 300 per cent’. Social mobility is also low in the USA.
The source states, ‘… most wealthy people are the sons and daughters of rich parents’. Social mobility is a problem for all industrialised economies. Better off parents are able to

© Pearson Education Ltd 2018. Copying permitted for purchasing institution only. This material is not copyright free.
give their children major advantages educationally, socially and financially. However, without more information about income and wealth inequalities in mixed economies, it is difficult to come to a more definitive conclusion about inequalities in the two types of economy. In the case of risk, it is clear that citizens carry more risk in the USA than in the mixed economies of Europe. One example has been healthcare where, prior to the introduction of ‘Obamacare’, many in the USA could not afford to go to the doctor or the hospital. In Europe, although health systems differ, they are mostly effectively free for all citizens. Access to medical care is one factor explaining why the USA has such poor life expectancy. It is the world’s highest income country per capita and yet only ranks 42nd in the world for longevity. Other welfare safety nets are also less generous in the USA than in the mixed economies of Europe. As a low-income worker, the risk of having stagnant income through your working life is higher in the USA than in Europe, where the benefits of economic growth are more evenly distributed.
Overall, for the better off, and particularly for the top 1 per cent, the free market economy of the USA works well. Growing incomes compensate for the greater risks in the economic system. However, for the majority of the population, fewer risks and the ability to share in the proceeds of economic growth mean that mixed economies perform better. The answer to the question very much depends on where you are on the income scale.
6 Rational decision making Activity 1
(a) By using less polluting vehicles there is an obvious benefit for both individuals and society. Less pollution means that there is less likelihood of it causing associated health problems. This is of direct benefit not just to the individual who might have become ill, but also because fewer health problems mean less strain on healthcare services and less expenditure. Also, a healthier population is likely to be more productive, increasing GDP and standards of living for all.
(b) The answer is both. For the reasons outlined in the response to (a), they are being irrational and ignoring the possible long-term benefits to themselves and others. They may be irrational because they are unaware of the wider implications or because all their friends do. On the other hand, it could be argued that on an individual and short-term level they are maximising their own utility by driving and getting pleasure form a more polluting vehicle because it has a faster engine or more comfortable ride. It may also be rational if they cannot afford to buy a new vehicle and get more utility from spending their disposable income on a house or food and clothes.
(c) Fewer lifts mean that there is less lift capacity available, perhaps causing queues and delays for the building’s occupants. Some will decide that it’s quicker and more convenient to take the stairs and so, over time, will become healthier and fitter from the exercise. This will be of long-term benefit to themselves and this, in turn, may reduce some of the strain on healthcare services.

© Pearson Education Ltd 2018. Copying permitted for purchasing institution only. This material is not copyright free.
Exam practice
1. Rationality means that economic agents are able to rank the order of different outcomes from an action in terms of their benefit to them. They then act in a way that will maximise these net benefits. For example, consumers taking out a loan will be able to rank different products by their costs, such as the rate of interest on the loan. They will then choose the loan that gives them the maximum benefits. This may be the loan with the lowest rate of interest.
2.(a) Behavioural economists argue that consumers often do not behave in a rational manner. One reason is because they are influenced by other people’s behaviour. For example, students may buy a branded pair of jeans because their friends have bought them. However, they may get no extra benefit from the purchase compared to buying a much less expensive pair of jeans. In the source, borrowers of small sums of money were more than ‘three times less likely to default’ on a second loan if they had met monthly to discuss how they were getting on with repaying their first loan. It may be in the best interests of a borrower to repay the loan. However, it may be better to default on the loan. Peer pressure or peer support coming from meeting monthly may have resulted in borrowers engaging in rational behaviour. But in some cases, they will not have behaved rationally because the best course of action for them would have been not to repay the loan.
(b) Humans are creatures of habit. They make the same decision repeatedly when faced with roughly similar circumstances. However, habits may lead to irrational decision making. This is because every situation is likely to be slightly different and, therefore, maximising utility might warrant a different decision. One reason why individuals adopt habitual behaviour is because it saves them time and effort in making decisions. A rule of thumb about how to behave in a particular situation enables them to get a decision mostly right, most of the time. However, consumers are open to exploitation by producers as a result. Supermarkets, for example, have traditionally put selected confectionery products next to checkout tills. They know that if offered confectionery at such a convenient point in the shop, many consumers will buy an item when they would not have bought it from the larger area in the supermarket where confectionery is placed. By placing confectionery products at the checkout till, the supermarket is reminding consumers that confectionery is available for sale and many consumers will, as a result of habit, buy something.
Equally, habitual behaviour can be driven by addiction. Tobacco and alcohol are two examples of addictive products. But so too are confectionery products which contain fats and sugars, as well as possibly cocoa, all of which can be addictive. Placing confectionery products at the till encourages addictive spending.
In the data, Aldi has announced that it will stop selling confectionery at tills. This will almost certainly result in lower spending by Aldi shoppers on confectionery, showing that habitual behaviour was an important influence on confectionery spending.
(c) Rationality assumes that economic agents are able to gain information about a decision and act upon it. One of the barriers to gaining information is weakness in computation on behalf of economic agents. Not all consumers, for example, can work out whether one product on a supermarket shelf is cheaper than another product. In the data, only 39 per cent of individuals from Mexico City were able ‘to identify the lowest-cost product when given the information in the form of brochures designed by banks for their customers’. This means that they were given all the information needed to get the lowest-cost product, but 61 per cent could not work it out. Even when given a ‘user-friendly summary sheet’, 32 per cent still

© Pearson Education Ltd 2018. Copying permitted for purchasing institution only. This material is not copyright free.
couldn’t get the right answer. Weaknesses in computation are one key reason why economic agents use rules of thumb in decision making. Approximations may not get the answer right every time, but they work well enough most of the time.
7 Demand Activity 1
Figure 1(a)
Figure 1(b)
Figure 1(c)
Figure 1(d)

© Pearson Education Ltd 2018. Copying permitted for purchasing institution only. This material is not copyright free.
(a) Charging children half price rather than full price fares is likely to lead to an increase in the quantity of rail journeys demanded. For instance, at full price, P1, in Figure 1(a), the number of children who will use a rail service is Q1. If children are charged half price, P2, then the quantity demanded rises to Q2.
(b) Giving senior citizens free rail passes rather than charging them for each journey is likely to increase their quantity of rail journeys demanded. For instance, in Figure 1(b), if senior citizens had to pay an average fare of 0C, they would demand 0B rail journeys. By making journeys free, and price per journey therefore falls to zero, quantity demanded increases to 0A.
(c) If Indian Railways increased its price by 5 per cent, then the quantity of rail journeys demanded would be likely to fall. In Figure 1(c), an increase in price from P1 to P2 leads to a fall in quantity demanded from Q1 to Q2.
(d) Reduced fares after 9.30 will lead to an increase in the quantity of journeys demanded. For instance, in Figure 1(d), the quantity of journeys demanded if the full price P1 were charged would be Q1. This can be compared to Q2, the quantity demanded if the fare were 60 per cent cheaper.
Activity 2
(a) This is the demand curve D(a).
Figure 2
(b) These are the demand curves D(b)(i) to D(B)(iv).
(c) Any curve to the left of the original demand curve D(a) would be a correct answer. For example, this could be the demand curve D(c).

© Pearson Education Ltd 2018. Copying permitted for purchasing institution only. This material is not copyright free.
(d) Any demand curve that started from the point price £8 quantity 0 would be a correct answer. For example, this could be the demand curve D(d).
Activity 3
(a) D curve shifts to the right as energy companies demand more oil-fired power stations to take advantage of cheaper oil prices.
(b) D curve shifts to the left as energy companies substitute oil-fired power stations in place of the now relatively more expensive gas-fired ones.
(c) D shifts left as petrol is likely to become cheaper as a result of falling oil prices. More people can now afford to use cars and so the demand for rail travel falls.
(d) D curve shifts to the right as air travel becomes less expensive due to cheaper aviation fuel.
Figure 3

© Pearson Education Ltd 2018. Copying permitted for purchasing institution only. This material is not copyright free.
Activity 4
An advertising campaign is likely to increase the demand for Mazola® canola oil at any given price. So, the Mazola® canola oil advertisement shown in the photograph should lead to an increase in sales for the product. This is shown diagrammatically by a shift to the right in the demand curve from D1 to D2 in Figure 4(a).
Figure 4a
A fall in the population will reduce the number of consumers of yoghurt. This will lead to a fall in demand for Mazola® canola oil, all other things being equal. This would be shown by a shift to the left in the demand curve from D1 to D3 in Figure 4(b).
Figure 4(b)

© Pearson Education Ltd 2018. Copying permitted for purchasing institution only. This material is not copyright free.
A rise in real incomes will mean that consumers will have more spending power available to buy Mazola® canola oil. Therefore, demand for Mazola® canola oil will rise, pushing the demand curve to the right from D1 to D2 in Figure 4(c).
Figure 4(c)
Studies which show products that lower cholesterol are good for health will lead to an increase in demand for Mazola® canola oil. This will push the demand curve for Mazola® canola oil to the right from D1 to D2 in Figure 4(d).
Figure 4(d)

© Pearson Education Ltd 2018. Copying permitted for purchasing institution only. This material is not copyright free.
Activity 5
The law of diminishing marginal utility states that the value, or utility, that individual consumers gain from the last product consumed falls as more units are consumed. For example, Samira probably gained more utility from the first pair of jeans that she bought than the second, since she didn’t wear the second pair ‘as much as her first pair of jeans’. Equally, having bought five pairs of jeans, she no longer shops for jeans. The marginal utility gained from buying a sixth pair is likely to be so low that other items available for her to spend money will have higher utility. Similarly, her brother, Intzar, puts little value or utility on a second pair of jeans. He has ‘better things to spend his money on’. However, having a first pair of jeans must give him utility because he would be prepared to buy another if the ‘existing pair had fallen apart’. This suggests that the marginal utility of owning a second pair of jeans is much lower for Intzar than it is for Samira.
Activity 6
(a) This is the demand curve, D, shown in Figure 5.
(b) This is the diagonally shaded area shown in Figure 5.
(c) The total consumer surplus at a price of $60 is shown by the shaded area in Figure 5. If the price of the product fell to $40 then there would be an extension in demand from 70 million units to 80 million units. As the price has fallen, then the price that the buyer is prepared to pay is relatively greater. Therefore, the consumer surplus is greater by the dotted area shown in the figure.
Figure 5

© Pearson Education Ltd 2018. Copying permitted for purchasing institution only. This material is not copyright free.
Exam practice
1. A – the price and the value to the buyer
2.(a) The data states that there has been ‘rising prices for dairy products in UK supermarkets’. These rising prices have ‘dampened demand’. There has been a movement up the demand curve for dairy products in UK supermarkets, leading to a fall in the quantity demanded of dairy products. This means that, at any given price for farm milk, food processors have demanded less. So, the demand curve for farm milk has shifted to the left, from D1 to D2 in Figure 6.
Figure 6
(b) A fall in incomes of UK consumers will ‘cut demand for dairy products’. At any given price for farm milk, less will be demanded. Hence the demand curve for farm milk will shift to the left from D1 to D2 in Figure 6.
(c) The data states that ‘demand for dairy products has been rising globally’. This means that at any given price, more farm milk will have been demanded. This is shown by a shift to the right in the demand curve for farm milk from D1 to D2 in Figure 7.
Figure 7

© Pearson Education Ltd 2018. Copying permitted for purchasing institution only. This material is not copyright free.
(d) The data states that food scares in the UK, such as the horse meat scandal in 2013, have made UK consumers want to be able to ‘trace a dairy product back to a UK farm’. This means that at any given price, demand for farm milk produced in the UK will rise. This is shown by a shift to the right in the demand curve for farm milk from D1 to D2 in Figure 7.
3. Consumer surplus is the difference between how much buyers are prepared to pay for a good and what they actually pay. A rise in the price of a good will, all other things being equal, reduce the amount of consumer surplus enjoyed by consumers. This can be seen in Figure 8 below. The price of dairy products is initially at 0A and consumers enjoy a consumer surplus of ACF. The price of dairy products now increases to 0B. There is a movement along the demand curve and the quantity bought falls from 0G to 0H. The new level of consumer surplus is BCE. So, the rise in price causes a fall in consumer surplus of ABEF.
Figure 8
4. In March 2014, it was reported that ‘UK dairy farmers were doing well’. Profits were increasing because ‘costs of production had been falling, while the prices they received for their milk had been rising significantly’. The rise in price is shown in Figure 6 of the Student Book. From a low of 17p per litre in 2000, milk prices had risen to 34p a litre by early 2014.
Rising prices were not the only good news for UK dairy farmers. Dairy product manufacturers had been investing in new facilities in the UK. For example, the Dairy Crest cheese plant in Cornwall had been expanded at a cost of £45 million to ‘increase production of whey powder for export to Asia’. Investment has been caused by two factors. One is rising demand for milk products from low and middle-income countries such as China. As their incomes rise due to economic growth, their consumers are demanding more dairy products. The National Farmers’ Union has forecast that ‘global demand for dairy production will grow by 2.3 per cent per year for the next decade’. Demand is also rising in the UK. Part of the reason for this is ‘wanting to produce more in the UK’ because of recent food safety scares. UK consumers want to know that the products they consume are what they claim to be. This rising demand for locally produced products has partially offset the fall in quantity demanded for dairy products due to rising prices in UK supermarkets.

© Pearson Education Ltd 2018. Copying permitted for purchasing institution only. This material is not copyright free.
However, markets are unpredictable. There could be a large expansion in dairy production in other EU countries to take advantage of growing demand from consumers in low and middle-income countries. Low and middle-income countries might also expand their dairy industries. This would force down the world price of milk. UK consumers might prefer to buy lower-priced dairy products sourced outside the UK than higher-priced dairy products made with UK-produced milk. The increase in demand for dairy products may not be anywhere near as large as forecast. UK food processors and supermarkets may also use their buying power to force down the price of farm milk. For example, the main UK supermarkets, such as Tesco, are engaged in a price war with deep discounters such as Aldi. While demand for dairy products might increase, supermarkets might insist on price cuts for farm milk to allow them to cut their prices on the supermarket shelves or increase their own profit margins.
Increasing the size of herds is therefore risky for farmers. If all UK farmers substantially increased their herds, the increase in supply would probably lead to a fall in milk prices. Farmers never know the price they will receive for their output unless they have entered into a contract with a buyer at a fixed price for future output. If farmers invest in larger herds, they could make more profit if markets go their way. They could equally lose money if the price of farm milk falls significantly. In March 2014, on balance, the signs for expansion were probably favourable. However, a risk-adverse farmer would probably not invest, seeing the trends as short term. Given the uncertainty, there is no clear answer to this question.
8 Price elasticity of demand Activity 1
The formula for price elasticity of demand is:
Price elasticity of demand is the percentage change in quantity demanded divided by the percentage change in price. Hence: (a) 2; (b) 3; (c) 1/2 or 0.5; (d) 1/9 or 0.11; (e) 5/7 or 0.71; (f) 8/11 or 0.73.
Activity 2
(a) 1/2 or 0.5; (b) 2; (c) 1/3 or 0.33; (d) 2; (e) 0; (f) 0.27.
Activity 3
(a) A 10 per cent increase in the price of petrol is unlikely to have any immediate significant effect on quantity demanded of petrol. The short-term elasticity of demand for petrol is highly inelastic because it has very few good, short-term substitutes. Car owners, for instance, will not change their cars to more fuel-efficient models overnight because the price of petrol has gone up 10c a litre. In the longer term, however, the elasticity of demand is much higher because consumers can change the equipment they use. For example, sales of oil-fired

© Pearson Education Ltd 2018. Copying permitted for purchasing institution only. This material is not copyright free.
central heating systems have never recovered in the UK since the 1973–74 quadrupling of the price of oil.
(b) These are likely to have a higher short-term elasticity of demand than petrol. Tomatoes have a number of good substitutes. If the price of tomatoes is too high, consumers will buy, for instance, tinned tomatoes, or eat hot meals instead of salads containing tomatoes. However, it is not possible to say whether demand is elastic or inelastic without further evidence.
(c) A 10 per cent increase in the price of holidays offered by a tour operator, with no similar increase in price offered by other tour operators, is likely to lead to a significant fall in demand for these holidays. Many package tours are bought on price and therefore demand is likely to be elastic. On the other hand, if the tour operator is offering holidays in a niche market, or it has a very strong brand image, then demand could be inelastic. If it operates in a niche market, there is likely to be little competition and consumers will therefore have no alternative but to pay the higher price for the holiday. If the tour operator has a strong brand image, consumers will be less price sensitive than would otherwise have been the case.
(d) Hyundai cars have a certain brand image and therefore demand for Hyundai cars in the short term is likely to be relatively inelastic. This would especially be true if consumers thought that rises in the price of Hyundai cars would be followed later in the pricing season by rises in the prices of other makes of cars. In the longer term, demand for Ford cars is likely to be more elastic than in the short term if the 10 per cent increase in price differential proves permanent. Despite branding, Hyundai is unlikely to be able to prevent consumers switching to other makes of cars whose prices have not gone up and therefore are now relatively better value.
(e) For example, Mars Bar, as a chocolate bar brand is very strong in the UK. It is widely recognised and is one of the market leaders in the chocolate bar market. Consumers have strong preferences in this market and will not buy many competing bars to Mars Bars on taste grounds. This would suggest that demand for Mars Bars is inelastic, with a 10 per cent price rise having little effect on the quantity purchased. However, this is unlikely to be the case. If demand for Mars Bars was price inelastic at their present price, it would pay Mars to increase the price because the total revenue (the number sold times the price) would then increase. For instance, if a 10 per cent rise in price resulted in a fall in quantity demanded of 6 per cent, spending on Mars Bars would increase by approximately 4 per cent. Moreover, Mars would save on costs because it could then produce 6 per cent fewer Mars Bars, further increasing profits for the company.
The fact that Mars, Incorporated® (a US company), is not increasing its prices today suggests that it believes that demand is elastic. A 10 per cent rise in price would lead to a fall of more than 10 per cent in quantity demanded as consumers switched to other now cheaper brands.
(f) For example, GQ magazine, a well-known British fashion magazine, might at first seem to have an inelastic demand. It has a strong brand image and is widely read by young males. However, again as with Mars Bars®, it could be argued that it would be in the interests of GQ to increase prices today if demand was indeed in elastic. It could raise revenue while saving on costs because of lower print runs. The argument is more complicated than with Mars Bars® because GQ also generates income from advertising. The lower the circulation, the lower the amount that the magazine can charge per advert and the less attractive the magazine as an advertising medium. Even so, it is unlikely that a few per cent reduction in

© Pearson Education Ltd 2018. Copying permitted for purchasing institution only. This material is not copyright free.
circulation would substantially lower advertising rates or the number of adverts being placed. So, as with Mars Bars®, the owners of GQ probably believe that demand is elastic.
Activity 4
(a) Demand is elastic on a straight-line demand curve at all points on the upper half of the line and inelastic on the bottom half of the line. Therefore: (i) demand is elastic between $4.50 and $9; (ii) demand is inelastic between $0 and $4.50.
(b)(i) $0; (ii) $9; (iii) $4.50.
Activity 5
(a) Price elasticity of demand equals the percentage change in quantity demanded divided by the percentage change in price. Therefore, the percentage change in quantity demanded equals the price elasticity of demand multiplied by the percentage change in price. So, the answers are:
(i) −7% (i.e. a fall in quantity demanded of 7%) This is calculated by −0.7 × 10% = −7% (ii) +7.6% (i.e. a rise in quantity demanded of 7.6%) This is calculated by −1 × −7.6% = +7.6% (iii) −1.6% (i.e. a fall in quantity demanded of 1.6%) This is calculated by −0.8 × 2% = −1.6%
(b) Total revenue = quantity × average price.
(i) −$1600 (i.e. a fall of $1600)
Before the price change, total revenue is $1 million (1 million units × $1). After the price change, the price is $1.04 ($1 + 4c). The quantity demanded can be calculated using the price elasticity of demand of fresh fruit, which is −1. The percentage change in price is 4% (4c ÷ $1). So, the percentage change in quantity demanded is −4% (−1 × 4%), i.e. a fall in quantity demanded of 4%. The original quantity demanded was 1 million units. So, the new quantity demanded and sold is 960,000 (96% of 1 million). The new total revenue is therefore 960,000 × $1.04. This is $998,400. So, the change in total revenue is $1 million − $998,400, which is $1600. This is a fall in revenue and so would be given a minus sign (i.e. −$1600).
(ii) +$74,000 (i.e. a rise of $74,000).
This assumes that a unit of eggs is a dozen eggs. Before the price change, total revenue is $4 million (2 million units × $2). After the price change, the price is $2.10 ($2 + 10c). The quantity demanded can be calculated using the price elasticity of demand of fresh fruit, which is −0.6. The percentage change in price is 5% (10c ÷ $2). So, the percentage change in quantity demanded is −3% (−0.6 × 5%), i.e. a fall in quantity demanded of 3%. The original quantity demanded was 2 million units. So, the new quantity demanded and sold is 1,940,000 (97% of 2 million). The new total revenue is therefore 1,940,000 × $2.10. This is $4,074,000. The change in total revenue is from $4 million to $4,074,000, which is $74,000. This is a rise in total revenue and so would be given a plus sign (i.e. +$74,000).

© Pearson Education Ltd 2018. Copying permitted for purchasing institution only. This material is not copyright free.
(c) (Note: First assume that all starting quantities are equal.)
Household expenditure is made up of expenditure on a large number of items, including those shown in Table 5 in the text. If the price of a good increases, total expenditure on the good will increase if the good is price inelastic, stay the same if it is unitary elasticity and fall if it is price elastic.
(i) None of the goods in Table 5 in the text are price elastic (i.e. has a value between −1 and −infinity). So, the greatest change in household expenditure will be those goods with the lowest price elasticity of demand. The lowest is fish, with a price elasticity of demand of −0.5. The second lowest is beef and eggs with a price elasticity of demand of −0.6. So white fish, beef and eggs are goods that will see the greatest change in household expenditure. With a rise in price, household expenditure on these items will rise.
(ii) The least change will be any goods that have a price elasticity of demand of −1. There will be no change in household expenditure for these goods. Table 5 in the text shows that fresh fruit and fresh vegetables both have unitary elasticity and so they will have the least change.
(d) Economic theory suggests a number of reasons why goods may have different price elasticities of demand, including availability of substitutes and width of market definition. In the case of substitutes, it is argued that goods with fewer good substitutes will have a lower price elasticity of demand. In the data, nuts, fish, milk and eggs have the lowest price elasticity of demand, between −0.5 and −0.7. Milk, eggs, fish and nuts may have few good substitutes. However, it could be argued that fresh fruit and fresh vegetables have few good substitutes and yet they have the highest price elasticities of demand in the table.
It is also sometimes argued that necessities have lower price elasticities of demand than luxuries. However, in Table 5 in the question, it would be very difficult to say which were necessities and which were luxuries. Is fresh fruit, with a price elasticity of demand of −1, less of a necessity than nuts, with a price elasticity of demand of −0.7, for example?
It could be argued that goods that form a relatively low proportion of total expenditure have lower elasticities than goods that form a more significant proportion. The data gives no information about total expenditure on the goods cited in Table 5, so it is not possible to test this hypothesis.

© Pearson Education Ltd 2018. Copying permitted for purchasing institution only. This material is not copyright free.
Exam practice
1. Price inelastic demand is when the proportionate change in quantity is less than the proportionate change in price.
2. Both goods are relatively cheap compared to most people’s incomes and therefore tend to be price inelastic. For many people, there are no acceptable substitutes for these goods and so, once again, PED tends to be inelastic.
3.(a)
PED −0.5 = % change in Q
20%
−0.5 × 20% = % change in Q = −10%
(b)
PED −0.8 = % change in Q
50%
−0.8 × 50% = % change in Q = −40%
4. So called ‘fat taxes’ are designed to increase the price of unhealthy foods and drinks in order to discourage consumption. This should lead to a healthier population; workers that might have previously suffered from obesity-related illnesses should be healthier, more able to work and enjoy a better lifestyle. This is particularly beneficial to those on low incomes.
The problem is that the increase in the price of drinks and foodstuffs does not amount to that much and many people simply carry on consuming. Those on low incomes already spend most, if not all, of their disposable income, so any increase in prices has a greater effect on them than on those with a higher income. Eating a healthier diet is not just about the price of the food, it is also about being aware of the healthier alternatives and being able to make the necessary changes. This may be harder for those on lower incomes.
9 Income and cross-elasticities Activity 1
The formula for income elasticity of demand is:
Δ𝑄𝑄Q
× YΔ𝑦𝑦
𝑜𝑜𝑜𝑜 Δ𝑄𝑄Q
÷ Δ𝑦𝑦𝑌𝑌

© Pearson Education Ltd 2018. Copying permitted for purchasing institution only. This material is not copyright free.
Hence:
(a) 20/100 × 10/4 = +0.5
(b) 5/15 × 6/1 = +2
(c) −10/50 × 25/10 = −0.5
(d) 3/12 × 100/25 = +1
(e) 50/200 × 10/1 = +2.5
(f) 5/25 × 20/−2 = −2
Activity 2
As income increases, households increase their consumption of normal goods, but reduce their consumption of inferior goods. Therefore, chicken and other poultry and bananas were normal goods, while sugar, white bread, fresh potatoes and butter were inferior goods, taking the whole period 1980–2012.
Butter was an inferior good between 1980 and 2000, but a normal good for the period 2000–12. Equally, the quantity of bananas consumed per person was static between 2000 and 2012. This means it was neither a normal good nor an inferior good for the period.
Activity 3
(a) Inferior goods are goods where demand falls when income increases, but demand rises when income falls. The data states that ‘Greggs, the bakery, did well out of the recession starting in 2008 with growing sales’. In a recession, average incomes fall. This would imply that, on average, the products that Greggs sold at the time were inferior goods. Equally, when ‘the economy began to climb out of recession in 2013, its sales actually fell’. Again, this supports the view that many of Greggs’ products were inferior goods at the time. These inferior goods included ‘budget breakfasts’ and ‘low-cost pastries’.
(b) Income elasticity is measured by the percentage in quantity of a good divided by the percentage change in income of consumers. If a good has a negative income elasticity, it means that when the percentage change in income is positive (i.e. incomes are rising), there is a percentage fall in quantity demanded of the good. Rising incomes, associated with falling demand for a good, is the definition of an inferior good.
(c) Like any business, Greggs needs to adapt to changing circumstances if it wants to remain profitable. A strategy of offering a range of inferior goods worked well during the recession that followed the financial crisis of 2007–08. However, it produced falling sales when incomes were beginning to grow again in 2013. It needed to sell more normal products, whose sales would rise as incomes increased, rather than inferior products, whose sales fell as incomes rose. This explains why ‘menus were changed to include better coffee and more breakfast options to attract better off customers’ and why it ‘added “Balanced Choice”, a range of healthy sandwiches designed to appeal to better off customers’. It also explains why Greggs concentrated on redecorating outlets rather than opening new ones in a bid to retain existing customers who otherwise, with more income in their pocket, might have traded up to chains such as Pret.

© Pearson Education Ltd 2018. Copying permitted for purchasing institution only. This material is not copyright free.
Activity 4
The formula for cross elasticity of demand of good X with respect to the price of good Y is:
Δ𝑄𝑄𝑄𝑄Qx
÷ ΔP𝑦𝑦Py
or Δ𝑄𝑄𝑄𝑄Q𝑄𝑄
× PyΔ𝑃𝑃𝑦𝑦
Hence:
(a) 80/100 × 5/1 = +4
(b) −27/40 × 40/−23 = +1.17 (to 2 decimal places)
(c) −30/200 × 10/3 = −0.5
(d) −60/90 × 6/−2 = +2
(e) −18/72 × 12/1 = −3
(f) 14/126 × 18/−2 = −1
Exam practice
1. C – A normal good with income elastic demand.
2.(a) Table 7 in the Student Book shows how expenditure on clothing and footwear and on transport varies with income. Data for three decile groups is given, the lowest decile by income, the fifth decile and the highest decile by income for 2012. Table 7 also shows how total household expenditure changes with income. Total household expenditure increases 5.6 times between the lowest and highest decile from £189.30 per week to £1065.60 per week. In contrast, expenditure on clothing and footwear increases 7.9 times, from £7.10 to £56.20 per week. Expenditure on transport increases even more, from £14.50 to £154.10 per week, a 10.6-fold increase. So, expenditure on both clothing and footwear and transport increases by more than the average as income increases; and expenditure on transport increases more than clothing and footwear.
(b) Table 6 in the Student Book shows how expenditure on clothing and footwear and transport has increased over time, between 1980 and 2012. Expenditure on clothing and footwear has increased by less than the average increase in total household spending, falling from 8.1 per cent of total expenditure in 1980 to 4.8 per cent in 2012. Expenditure on transport, too, has increased by less than the average, falling from 14.6 per cent of total household expenditure in 1980 to 13.1 per cent in 2012.
3. Clothing and footwear is likely to have a lower, not a higher, income elasticity of demand than transport. Income elasticity is defined as the responsiveness of quantity demanded to a change in income and is measured by dividing the percentage change in quantity demanded by the percentage change in price.
Considering both changes in income levels at a point in time, shown in Figures 3 and 4 and in Table 7 in the Student Book, and changes in spending over time shown in Table 6, the

© Pearson Education Ltd 2018. Copying permitted for purchasing institution only. This material is not copyright free.
increases in spending on clothing and footwear are less, proportionately, than increases in spending on transport as income rises. For example, in Figures 3 and 4, the lowest five deciles by income spent between 3 and 5 per cent of their total expenditure on clothing and footwear. The top five deciles spent a little more, but the range for all deciles was between 4 per cent and 5.5 per cent of income. In contrast, the bottom decile by income spent nearly 8 per cent of their income on transport but this rose to over 14 per cent for the top decile. So, the proportion spent on clothing and footwear rose far less as income rose than that spent on transport.
Similarly, in Table 6, real disposable income per household increased by 77 per cent between 1980 and 2012. Real expenditure on clothing and footwear rose over that period but fell as a proportion of total expenditure. Real expenditure on transport also rose, but the fall as a proportion of total spending was relatively small and much smaller than that for clothing and footwear.
4. The components of spending in Table 7 that are likely to have the highest income elasticities are those where spending increases proportionately the most as income increases. Table 1 below shows the percentage increase in spending for the tenth decile compared to the first decile (in the third column). So, for clothing and footwear, ‘dry cleaners, laundry and dyeing’ and ‘footwear’ are likely to have the highest income elasticity of demand if we ignore the infinity for haberdashery and clothing hire. For transport, it is ‘purchase of vehicles’ and ‘rail and tube fares’ which have the highest income elasticity of demand. Comparing the two categories, ‘purchase of vehicles’ has a significantly higher income elasticity of demand than ‘dry cleaners, laundry and dyeing’.
First decile Tenth decile % change Men’s outer garments 1.60 14.20 888 Men’s under garments 0.10 0.80 800 Women’s outer garments 2.50 18.50 740 Women’s under garments 0.50 2.20 440 Boys’ outer garments (5–15) 0.20 1.60 800 Girls’ outer garments (5–15) 0.30 1.90 633 Infants’ outer garments (under 5) 0.20 1.10 550 Children’s under garments (under 16) 0.10 0.70 700 Accessories 0.20 1.90 950 Haberdashery and clothing hire 0.00 0.40 Infinity Dry cleaners, laundry and dyeing 0.10 1.10 1100 Footwear 1.30 11.80 908 Total clothing and footwear 6.90 56.10 813 Purchase of vehicles 2.40 48.30 2013 Petrol, diesel and other motor oils 5.10 47.30 927 Other motoring costs 3.60 29.00 806 Rail and tube fares 0.90 11.70 1300 Bus and coach fares 0.80 1.60 200 Combined fares 0.40 2.30 575 Other travel and transport 1.30 13.90 1069 Total transport 14.50 154.00 1062 Total expenditure per household on all goods and services £
189.30 1065.60 563
Table 7

© Pearson Education Ltd 2018. Copying permitted for purchasing institution only. This material is not copyright free.
5. Table 7 would suggest that bus and coach travel have a very low income elasticity of demand. An exact value for income elasticity of demand cannot be calculated from the table because the income figures given are ranges rather than individual numbers. However, if we assumed that average total household income of the bottom decile were £160 and for the top decile was £1700, income elasticity of demand for bus and coach travel would be the percentage change in quantity demanded for travel (which we assume can be measured by the percentage change in expenditure), which is 100% (100% × [£1.60 − £0.80)] ÷ £0.80), divided by the percentage change in income, which is 963% (100% × [£1700 − £160]÷ £160).This estimated value for income elasticity of demand is therefore 0.1 (100% ÷ 963%). The income elasticity of demand for bus and coach fares is therefore very low. This means that as income rises, there is hardly any increase in demand for bus and coach journeys.
However, the evidence in Table 7 does not show that income elasticity of demand for bus and coach fares is negative. Bus and coach journeys are not an inferior good according to this evidence. Bus and coach transport has a future in the UK but the evidence would suggest that demand for bus and coach transport is unlikely to increase by very much as incomes rise over time, all other things being equal. In practice, all other things will not be equal. In recent years demand for bus and coach transport has risen, arguably due to investment by bus and coach companies in more and better vehicles and more services being offered. On the other hand, average fares have been rising in comparison with the cost of motoring, which would depress demand. The income of consumers is therefore only one of many factors that will determine the success of the bus and coach industry in the future.
10 Supply and price elasticity of supply Activity 1
(a) and (b) See Figure 1 below.
Figure 1

© Pearson Education Ltd 2018. Copying permitted for purchasing institution only. This material is not copyright free.
Activity 2
(a) Earnings of workers, or wages, are a cost to firms. When wages rise, firms’ costs rise too. This shifts the supply curve to the left, showing that firms want a higher price if they are to supply the same amount as before.
(b)(i) Firms’ supply curves are likely to have shifted furthest to the left when wage increases were greatest. In 1975, for instance, average earnings rose by 26 per cent. This is likely to have increased firms’ costs substantially and led to a sharp shift to the left in their supply curves. 1980 and 1990 were other peak years for earnings when the supply curves of firms shifted further to the left than in surrounding years. Of these three peaks, 1975 was by far the highest.
(ii) The supply curve would have shifted least far to the left when changes in average earnings were at their lowest. In the period 1963 to 2013, there were a number of years when earnings growth was lowest compared to surrounding years. 1967, 1977, 1984, 1993 and 2009 all saw relatively low earnings inflation. Of these years, 2009 saw the lowest level of earnings inflation and hence in 2009 the supply curve for goods would have shifted least far to the left as a result of increases in costs.
Activity 3
Advances in technology have vastly reduced the cost of calculators since 1970. The cost of the microchip used in a calculator has dropped at a startling rate. This has had the effect of pushing the supply curve right, as in Figure 2, from S 1970 to S 1975 to S Today.
Figure 2

© Pearson Education Ltd 2018. Copying permitted for purchasing institution only. This material is not copyright free.
Activity 4
(a) The new plantations will increase the supply of rubber onto world markets. This will shift the supply curve of rubber to the right from S1 to S2 in Figure 3(a). The exact impact will depend on how much rubber the new plantations supply compared to existing supply.
Figure 3(a)
(b) All other things being equal, some office space will be converted into dwellings if the price of dwellings, including conversion from office space, is higher than office space itself. This means that the supply of office space in London will fall, shown by a shift to the left of the supply curve from S1 to S2 in Figure 3(b).
Figure 3(b)

© Pearson Education Ltd 2018. Copying permitted for purchasing institution only. This material is not copyright free.
(c) At any given price of corn, US farmers have decided to use less land to grow corn because they think that it will be more profitable to use the land to grow soya beans. The result will be a fall in supply of corn, shown by a shift to the left of the supply curve from S1 to S2 in Figure 3(c).
Figure 3(c)
Activity 5
The formula for price elasticity of supply is:
Δ𝑄𝑄𝑄𝑄
× PΔ𝑃𝑃
Hence:
(i) 3/0 × 4/2 = infinity
(ii) 3/3 × 6/2 = 3
(iii) 3/6 × 8/2 = 2
(iv) 3/7.5 × 9/2 = 18/10 or 1.8
(v) 3/4.5 × 7/2 = 21/3 or 2.33
Exam practice 1. D – Long production time
2. The two graphs cover slightly different time periods. The price graph (Figure 8 in the Student Book) covers 2014–16, while the production graph (Figure 9) covers 2006–18.

© Pearson Education Ltd 2018. Copying permitted for purchasing institution only. This material is not copyright free.
One significant feature has been the rise in both prices and production over time. Between 2014 and 2016 salmon prices rose from approximately 30 to 80 Norwegian Krone per kg. Production rose between 2006 and 2018 from 0.6 to over 1.2 million tonnes.
Another significant feature can be found by considering the short period of time between 2013 and 2014 covered by both sets of data. Here production fell slightly, from approximately 1.2 to 1.1 million tonnes. However, prices rose from around 30 Norwegian Krone per kg to between 38 and 46 Norwegian Krone per kg.
3.(a) The article states that ‘rising prices have led to increased profits for salmon farmers’. Increased profits will lead to farmers increasing the quantity of salmon supplied. This is shown by a movement up the supply curve, for example from point A to point B in Figure 4. The higher the price and profit, the more will be supplied.
Figure 4
(b) The system of licensing limits the ability of salmon farmers to increase the number of fish on a fish farm and to increase the number of fish farms. At any given price, farmers would like to farm more fish, but the licence system limits them. In Figure 5, S1 is a supply curve for salmon farming without licensing. Assume that the price is 0A. Salmon farmers would like to produce 0B salmon. However, the system of licences limits production. The supply curve with licences is S2, to the left of S1. At a market price of 0A, salmon farmers will only produce 0C salmon. Hence the licence system restricts supply and output of salmon.

© Pearson Education Ltd 2018. Copying permitted for purchasing institution only. This material is not copyright free.
Figure 5
(c) The data states that ‘the price of fish feed is rising’. Fish feed is a cost to salmon farmers. A rise in costs of production leads to a shift in the supply curve to the left. In Figure 6, assume that production is at 0A and price is 0B with a supply curve of S1. A rise in the price of fish feed will mean that farmers now want a higher price of, say, 0C for their salmon to maintain that level of production. The supply curve therefore shifts to the left to S2.
Figure 6
(d) The data states that ‘in 2013, Norway suffered colder than usual seawater which inhibited the growth of salmon and so the total tonnage of salmon produced fell’. Unfavourable weather conditions will reduce the supply of salmon, while better than average weather for salmon farming will increase the supply of salmon. This is shown in Figure 7.

© Pearson Education Ltd 2018. Copying permitted for purchasing institution only. This material is not copyright free.
Normal or average weather conditions lead to a supply curve of S. Better than average conditions lead to a supply curve to the right of S1 while worse than average conditions lead to a supply curve to the left of S2.
Figure 7
4. In the short run, the PES of salmon will be inelastic. Even a significant price rise will have little impact on the supply of salmon. There may be some stocks of frozen salmon that can be used, but at any given time there is a fixed amount of fresh salmon available. Consequently, there will only be a small proportionate rise in the quantity of salmon supplied compared to the increase in price.
The higher price will act as a signalling mechanism. Existing salmon producers will respond by expanding capacity to take advantage of the higher prices and potential profits. Encouraged by the higher prices, new producers will enter the market also increasing the supply. This will take time, but in the long run more salmon will be produced and the PES will become more elastic. Therefore, the PES of salmon depends upon the timescale involved.

© Pearson Education Ltd 2018. Copying permitted for purchasing institution only. This material is not copyright free.
11 Market equilibrium Activity 1
(a)
Figure 1
(b) The equilibrium price is $20 (i.e. where demand equals supply).
(c)(i) Excess demand (i.e. where demand is greater than supply) exists in the price range from $0 to $19.99.
(ii) Excess supply (i.e. where supply is greater than demand) exists in the price range from $20.01 to infinity.
(d)(i) At $10 there will be a shortage in the market because 80 million units are demanded but only 30 million supplied.
(ii) At $40 there will be a glut on the market because 90 million units will be supplied but demand is zero.
(iii) At $22 there will be a glut on the market because 44 million units will be demanded while 54 million units will be supplied.
(iv) At $18 there will be a shortage because 56 million units will be demanded while 46 million will be supplied.
(v) At $20 there will be neither a glut nor a surplus because demand equals supply and the market is in equilibrium.

© Pearson Education Ltd 2018. Copying permitted for purchasing institution only. This material is not copyright free.
Activity 2
(a) The price of a second-hand 2012 Olympic torch is set by the forces of demand and supply. On the demand side, there are collectors who want to own an Olympic torch. On the supply side, there are the owners of Olympic torches. These are likely to be either runners who opted to buy their torch or collectors who have already purchased a torch. In Figure 2(i), the demand curve is downward sloping showing that as the price falls, more torches are demanded by buyers. The supply curve is upward sloping. The higher the price, the more owners of torches are willing to sell. The equilibrium price is 0A and the quantity bought and sold over a period of time is 0B. It could be argued that the supply of torches is fixed and so the supply curve is vertical. After all, a maximum of around 8000 torches were made and carried by torch bearers in 2012. In Figure 2(ii), the quantity supplied is fixed at 8000. However, not all these torches are available for sale at any point in time. For example, some torches will be in museums. A vertical supply curve also implies that sellers will be willing to sell at whatever price is set by the market. This is unlikely to be the case. If the price of torches falls, fewer owners of torches are likely to want to sell their torches and this therefore implies that the supply curve is upward sloping and not vertical.
Figure 2(i)
Figure 2(ii)

© Pearson Education Ltd 2018. Copying permitted for purchasing institution only. This material is not copyright free.
(b) One reason is that the first torches to come onto the market were offered for sale before the majority of runners had even completed their run. So, there were far fewer potentially on the market and therefore supply was much lower. Secondly, demand might have been higher. This is because some buyers of torches would have wanted to own a torch as they saw runners carrying the torches round the UK. This is rather like World Cup football or rugby shirts. An England World Cup football shirt can be sold for a higher price when England is still in the competition compared to when it has been knocked out, as it has been every tournament since 1966. Restricted supply compared to demand therefore means that torches are likely to have been sold at higher prices in 2012 than in 2014.
(c) Owners of Olympic torches are likely to be motivated to keep or buy a torch by two main factors. One is that they carried the torch and it is part of their family history. They are unlikely to want to sell their torches. The other is collection. Many buyers will be collectors, rather like stamp collectors or teddy bear collectors. 1948 torches are much rarer than 2012 torches. Only 1720 torches were made for the 1948 Olympics and some of those will be badly damaged or will have been destroyed for various reasons over time. There were potentially around 8000 torches made for the 2012 Olympics. Hence, the supply of 2012 torches is likely to be higher in 10 years than the supply of 1948 torches. Greater supply is likely to lead to lower prices. On the demand side, collectors may have a preference for collecting older torches rather than newer torches. If the price were the same, they may prefer to buy a 1948 torch rather than a 2012 torch. If this were the case, it would mean that demand would be higher for 1948 torches. Higher demand would again lead to higher prices.
This is shown in Figure 3. The lower supply and higher demand for 1948 torches lead to an equilibrium price of 0A with 0E being bought and sold. The higher supply and lower demand for 2012 torches leads to a lower price of 0B with 0F being sold bought and sold.
Figure 3

© Pearson Education Ltd 2018. Copying permitted for purchasing institution only. This material is not copyright free.
Activity 3
Nickel
Figure 4(a)
The demand for nickel is increasing, mainly from producers of electric cars. At the same time, the supply is static and unlikely to increase. The demand curve shifts to the right, causing a new and higher equilibrium price and an increase in the quantity traded.
Cobalt
Figure 4(b)
When Glencore reopens the Katanga mine the supply of cobalt will increase by around 20 per cent. The supply curve will shift to the right, causing a new and lower equilibrium price and an increase in the quantity traded.

© Pearson Education Ltd 2018. Copying permitted for purchasing institution only. This material is not copyright free.
Exam practice
1.(a)
Figure 5
(b)
Figure 6
2. Like many commodities, cocoa is prone to continuous price changes. The market is not stable and for cocoa producers, life is uncertain and risky and profitability is not always guaranteed. Changes in both demand and supply affect the price of the commodity. For example, a rise in demand for lithium used in electric car batteries increases the price. Producers respond by increasing production and so the price falls. As the Chinese economy expanded there was a continuous rise in demand for many commodities. Suppliers increased production, but once the Chinese economy slowed down demand fell and with the increased supply, prices of commodities fell.

© Pearson Education Ltd 2018. Copying permitted for purchasing institution only. This material is not copyright free.
3. The low prices in 2017 are likely to send a strong signal to cocoa farmers to cease production, or at least switch some of their land to grow more profitable crops. Some farmers will now find it unprofitable and leave the market, reducing supply even further. This will take time to have an effect as current excess stocks will be used up. Eventually the reduced supply of cocoa will cause the price to rise again. Producers respond by increasing production and farmers switch crops back to cocoa to gain the higher price. In time, the supply of cocoa will increase, the price falls again, repeating the cycle.
However, the extent to which this happens also depends on other factors. The extent to which farmers can increase production depends on how much land is available and the relative price of cocoa compared to other crops. In addition, demand influences prices. The trend towards healthier eating may continue and keep prices low. If more substitutes for cocoa are developed, this will also decrease the demand for cocoa. The only certain prediction that can be made is that prices are going to be uncertain for some time to come.
12 Functions of the price mechanism Exam practice
1. The data in Figure 8 in the Student Book shows the amount of organically managed land in the UK between 2009 and 2016. Over the whole period, the amount of land used declined, but this was not a uniform decline. Initially between 2009 and 2010, the amount of land used for organic farming increased, from approximately 620,000 hectares to approximately 670,000 hectares. However, between 2010 and 2013, the amount of land used declined significantly, to approximately 550,000 hectares in 2013.
2. Between 2010 and 2013, the supply of UK-produced organic meat and dairy products fell as farmers left the market. This is shown by a shift to the left in the supply curve from S1 to S2 and a fall in equilibrium output from 0E to 0F. This should result in a rise in the equilibrium price of organic products, from 0A to 0B. Reduced supply will ration the quantity of goods available to customers. Higher prices act as the mechanism by which these goods are allocated between buyers.
Figure 1

© Pearson Education Ltd 2018. Copying permitted for purchasing institution only. This material is not copyright free.
3. According to the data, the ‘amount of land used for organic products is still in decline’. Prices have acted as signals to UK producers to reduce the quantity of organic meat produced. Prices have not been high enough to enable producers of organic products to make sufficient profit to keep them in the market. Low prices have also acted as an incentive for producers to leave the organic production market. Figure 2 below shows the long-run supply curve for organic meat in the UK. In the short run, the market price for organic meat is 0B, but production is at 0E. At this price, some UK farmers cannot make sufficient profit to justify production. So, some farmers leave the market, reducing UK production by EF, to 0F. Low prices have acted as both a signal and an incentive for some farmers to reduce their supply. This then changes the allocation of resources. Farmers who before were producing organic animals will now change the use of their resources to alternative products, such as non-organic animals.
Figure 2
4. The data states that ‘the amount of land used for organic products is still in decline’ in the UK. Figure 8 in the Student Book shows a significant fall in land usage for organic products between 2010 and 2013. A number of UK organic farmers have not been able to generate sufficient profit from organic farming. The ‘major problem’ for UK organic farmers, according to the data, has been ‘the high prices they have to pay for animal feeds’. In Figure 2, an increase in prices for animal food is shown by the shift to the left of the supply curve.
However, there has been ‘rising demand for organic dairy and meat products by consumers’. This is shown by a shift to the right in the demand curve from D1 to D2 in Figure 3. This should lead to an increase in equilibrium price from 0A to 0B. Higher prices will be a signal to and an incentive for both UK producers and foreign producers to supply more organic products to the UK market.

© Pearson Education Ltd 2018. Copying permitted for purchasing institution only. This material is not copyright free.
Figure 3
No data is given for what has happened to prices between 2009 and 2013. However, the Organic Research Centre suggested that falling UK output of organic produce would ‘risk increasing the amount of organic food which was imported into the UK’. One possibility is that rising demand has had little effect on equilibrium prices. This is because foreign producers have been prepared to supply organic products to the UK market at the same price. They have been prepared not just to fill the gap left by UK producers leaving the market but also to supply the extra quantity demanded by consumers. This would suggest that the supply curve to the UK market is horizontal as shown in Figure 4. Producers worldwide are prepared to supply any amount of organic produce to the UK market at a price of 0A.
Another possibility is that the prices of organic products were rising over the period 2009–13. However, costs to UK organic farmers were rising even faster. This meant that despite rising prices, production was becoming less profitable. Rising prices acted as a signal and as an incentive to foreign producers to supply more to the UK. However, price rises were too low to prevent UK producers leaving the market.
Increased imports, by increasing supply, will lead to a fall in prices from what they would otherwise have been had there been no imports. Whether they will lead to a fall in actual prices depends on the balance between the fall in UK production, the rise in imports and the rise in UK demand. A large rise in demand with a relatively small increase in supply by foreign producers is likely to lead to higher UK prices. A small rise in demand with a relatively large increase in supply by foreign producers is likely to lead to lower UK prices. Without more information, it is difficult to predict what will happen in the future.

© Pearson Education Ltd 2018. Copying permitted for purchasing institution only. This material is not copyright free.
Figure 4
13 Indirect taxes and subsidies Activity 1
(a) INR 68
(b) INR 65.4
(c) INR 62.5
(d) INR 26.5
Activity 2
(a)
Figure 1

© Pearson Education Ltd 2018. Copying permitted for purchasing institution only. This material is not copyright free.
(b) The equilibrium quantity demanded and supplied is 8 units where demand equals supply.
(c) See Figure 1 above.
(d) 6 units
(e) $9
(f)(i) $1 – The incidence of tax per unit on the consumer is the difference between the original equilibrium price of $8 and the new equilibrium price of $9 following the introduction of the tax. So, it is $1.
(ii) $2 – The incidence of tax per unit on the producer is the difference between the tax per unit of $3 and the incidence of tax on the consumer, shown above to be $1. So, it is $2.
(g)(i) $3 – This is simply the information already given in the question.
(ii) $18 – Total government revenue is the tax per unit, $3, multiplied by the quantity sold when the tax is applied, 6 units. So, the total government revenue is $18.
(h) $28 – Producers before the tax was imposed received the equilibrium price, $8, multiplied by the equilibrium quantity sold, 8 units, making total revenue of $64. After the tax is imposed, producers only receive $6 per unit (which can either be read off the graph, or is the new equilibrium price of $9 minus the tax of $3) and sell only 6 units. So total revenue is $36 and revenue will change by $64 − $36 or $28.
Activity 3
(a)(i)
Figure 2(i) The supply curve will shift vertically upwards at each and every price level by the amount of the tax increase. This creates a new higher equilibrium price and lower equilibrium quantity.

© Pearson Education Ltd 2018. Copying permitted for purchasing institution only. This material is not copyright free.
(ii)
Figure 2(ii)
The supply curve will shift vertically downwards at each and every price level by the amount of the tax reduction. This creates a new lower equilibrium price and higher equilibrium quantity.
Exam practice
1. B – an ad valorem tax.
2. An indirect tax is a tax on expenditure, such as VAT.
3. The government could pass a law requiring manufacturers to label their products with more information about the contents. This could also include a health warning with information about the possible consequences of overconsumption. This would help to educate the public about the potential dangers and enable them to make a more informed choice and hopefully reduce consumption.
4. There are several reasons why the Mexican government wants to reduce obesity. There is a considerable cost involved in treating those who become ill as a result of obesity. According to the state health insurer, this was expected to increase by a factor of 4.5 by 2015 and is unsustainable. Those who become ill may not to be able to work and need some kind of benefit payments to survive. This is costly, and the funding may have to come from other areas of government spending such as education. Mexicans who are ill and cannot work are not contributing any tax and there is also a loss of output for the Mexican economy.
5. An increase in the soda tax will increase the price of soda and this will result in a fall in the quantity demanded. Sales of soda have already decreased by 7.6 per cent and the tax is expected to reduce obesity by 2.5 per cent by 2024. Therefore, a doubling of the tax should have a greater impact.
However, this does depend on the price elasticity of demand (PED) for the soda. If the PED is elastic, an increase in the tax would be effective, as the proportionate change (decrease) in quantity demanded would be greater than the proportionate change (increase) in price. The diagram below shows this clearly.

© Pearson Education Ltd 2018. Copying permitted for purchasing institution only. This material is not copyright free.
Figure 3
If PED is inelastic there will not be such a great change, as the proportionate change (decrease) in quantity demanded would be less than the proportionate change (increase) in price. The diagram below shows this clearly.
Figure 4
Soda is likely to be price inelastic because many people enjoy the drink and do not see it as having an acceptable alternative, therefore many Mexicans will continue to consume
Elastic demand
Inelastic demand

© Pearson Education Ltd 2018. Copying permitted for purchasing institution only. This material is not copyright free.
regardless of cost. The price of soda is also relatively low and even with a doubling of the tax it will still cost a small proportion of most Mexicans’ income.
This does not mean that doubling the tax is a bad idea. It has already been shown that a tax has some effect on sales and so further tax is also likely to deter some consumers. If the increase in tax is used alongside health campaigns and an education programme it may well have a more substantial impact than just the tax on its own.
14 Sources of market failure Exam practice
1. B – buyers have more information than sellers.
2. A private cost might be the suffering and/or loss of earnings if a person becomes ill due to the excessive pollution in New Delhi. The cost is borne by the person involved. If that person then requires medical treatment and healthcare, the cost is an external one as it is paid by a third party. In this case, it is likely to be the government, funded by the taxpayers.
3. A private benefit will be the reduction in travel times as the roads become less congested. The drivers now have more time to spend at home with their families rather than sitting in traffic queues. An external benefit would be the reduction in pollution which will decrease the chances of people becoming ill and imposing long-term healthcare costs on the government.
4. To an extent it will be effective because, if people obey the regulations, fewer cars on the road means less pollution. As with all regulations it will need to be enforced and this will impose costs on the police and justice system. Its success will also depend on the availability of public transport; those motorists who cannot use their cars that day need to be able to get to work. The scheme may also face opposition from motorists’ groups and the motor and fuel industries. Some motorists avoided a similar scheme in Singapore by purchasing two cars with different numbers and used them on alternate days.
5. Further restrictions on pollution are likely to improve the quality of the air in New Delhi and benefit its citizens, assuming that the measures are successful, of course. Any improvement will have a beneficial effect on the health and quality of life of individuals. Fewer illnesses resulting from pollution also means less strain on healthcare systems and resources. A healthier population is also a more productive one, with less unemployment due to illness. More people working means that more tax will be paid and fewer benefits will need to be paid to the sick. Greater tax receipts enable the government to spend more in other areas which, in turn, will be of long-term benefit to the city, such as education and infrastructure. As things improve, more international businesses may move in to New Delhi, providing employment and stimulating the local economy.
However, as the extract shows, not everyone is happy with such an outcome. The motor industry feels that they are being unduly punished, with adverse effects on their sales and incomes. Those businesses that rely on lorries and vans to move stock may incur extra costs as they have to buy cleaner vehicles. Construction firms will face similar problems, as they control the pollution from their building sites. Energy generators will have to replace the polluting coal-fired power plants or take significant steps to improve emissions. Alternative sources of cooking fuel may be more expensive, decreasing the disposable income of consumers, and this is likely to have more of an impact on New Delhi’s poorer inhabitants.

© Pearson Education Ltd 2018. Copying permitted for purchasing institution only. This material is not copyright free.
Finally, further restrictions have to be implemented and enforced, placing further costs and burdens on the authorities and justice system.
These are all short-term problems and while this will cause difficulties and increased costs for many businesses and individuals, it has to be balanced against the long-term benefits of reducing pollution. Some of these benefits will not be immediately apparent but the improvement in health, the reduction of externalities and the effect on economic development suggest that further restrictions to reduce pollution will have a positive impact on New Delhi.
15 Positive and negative externalities Activity 1
The photograph shows an example of topiary – cutting a hedge or tree to a particular shape. Passers-by are likely to find this attractive, but will not pay for the pleasure they receive, so the social benefit is likely to be higher than the private benefit. Therefore, it is an example of a positive externality.
The cartoon shows two sources of air pollution: motor vehicles and emissions from industrial plants. These are negative externalities, where the creator of the costs does not pay the full cost to society of its activity. In the cartoon, the cyclist and the mother and child in a pushchair are losers from the air pollution created by firms and motorists.
Activity 2
(a) An externality occurs when there is a difference between social costs and benefits and private costs and benefits. In this case, there has been a discharge of an unknown pollutant into the city of Jingjiang’s water supplies. This has imposed costs on the citizens of the city because they are no longer able safely to drink the water. However, the firm that made the discharge has not paid for the costs that it has imposed. The disruption to citizens caused by polluted water is the externality created. It is the difference between social costs, all the costs of the firm or firms that created the pollution including the costs of contamination of the city’s water supplies, and private costs, the costs the firm or firms pay for production.
(b) A misallocation of resources occurs when production fails to take place at the point where marginal social cost equals marginal social benefit. In Figure 1, the shipbuilding and textiles firms that created the Jingjiang pollution have marginal private costs, shown by the curve MPC. However, they have failed to invest in technology or training of their workforce that would have prevented the contamination of Jingjiang’s water supplies. The result is that the cost to society of their activities is higher because of the contamination. This is shown by the curve MSC. Firms produce at 0B, where marginal private cost equals the marginal private benefit to the firms. The optimal level of output is 0A, where marginal social cost equals marginal social benefit (in this case, assumed to be equal to marginal private benefit). Output is too high by AB to achieve an optimal allocation of resources.

© Pearson Education Ltd 2018. Copying permitted for purchasing institution only. This material is not copyright free.
Figure 1
Exam practice
1.(a) The number of obese boys in this period increased from 6 million to 74 million.
Percentage change =
74m - 6m × 1006m = 1113.33%
(b) The number of obese girls in this period increased from 5m to 50m.
Percentage change =
50m - 5m × 1005m = 900%
2. Market failure happens when resources are not allocated in the most efficient way. The market mechanism has resulted in a less than perfect outcome, the social costs outweigh the social benefits. If the market mechanism was working perfectly there would not be obesity or people who are underweight.
In this case, there are both obese people and underweight people. Both groups cause health issues which are externalities, as other people bear the cost of treatment. This also has an opportunity cost, in that scarce resources are used to treat the problems which may be better used elsewhere, for example in education or investment. People that are obese or underweight are also less likely to be productive and so economic growth is less than it could be.
3. Market failure occurs when production and consumption are not at the socially optimal level. In the case of sugar, this occurs because there are negative consumption externalities.

© Pearson Education Ltd 2018. Copying permitted for purchasing institution only. This material is not copyright free.
Too much sugar is being consumed because the private benefit of eating sugar is greater than the social benefit, as shown in Figure 2.
Figure 2
Sugar consumption per person is declining, as the problem of obesity gets worse, it points out.
Reduced exercise is clearly one reason for worsening obesity problems. The less exercise taken, the fewer the calories needed to maintain a stable weight. For this reason, video games, the Internet, television, mobile phones and cinemas are all partly responsible for less active lifestyles and, therefore, growing problems of obesity.
However, sugar is not the only dietary problem. As we eat more and more processed food and less fresh food, we tend to eat more fat, which increases the calories in our diets. Equally, processed convenience food encourages snacking where people are eating many times a day rather than just at a few mealtimes. Fat and sugar in processed foods combine with the ready availability of food at the point we want to eat it to cause overeating and obesity.
The impact of market failure falls disproportionally on low-income households that, for a variety of reasons, tend to gain a large proportion of their calories from processed foods compared to higher-income households. Raising households out of poverty would be likely to have some impact on market failure due to excessive sugar consumption because low-income individuals would be likely to reduce their sugar consumption as they ate more non-processed food.
Overall, overconsumption of sugar is, indeed, a significant cause of market failure, but it is not the only cause leading to obesity and other health problems. The sugar industry is correct in pointing to other causes apart from sugar. However, sugar currently remains a problem, with too much sugar being consumed. This is despite food industry efforts to reduce the amount of sugar in food over time. Exactly what would be an optimal level of

© Pearson Education Ltd 2018. Copying permitted for purchasing institution only. This material is not copyright free.
sugar to consume would depend on other lifestyle factors. However, it would almost certainly be lower than current average levels of consumption.
16 Non-provision of public goods Activity 1
A public good is one that possesses two characteristics. First, consumption of the good by one individual does not reduce the amount available for consumption by another individual. Second, once produced, no individual can be excluded from benefiting. In the case of street lights, the lighting given to one person does not diminish in any way the ability to give lighting to other people. Furthermore, once provided, it is impossible to exclude people in the area from benefiting, whether or not they have contributed to the upkeep of the lighting.
Exam practice 1. A public good will not be provided by the free market and is said to be non-rivalrous and non-excludable, i.e. consumption by one person does not prevent consumption by another and consumption cannot be prevented, A private good is a good which possesses the characteristics of rivalry and excludability, i.e. once consumed, it cannot be consumed by anyone else and it is possible to prevent someone else from consuming the good.
2. Bangladeshi television can be classified as a public good because, like many other state-owned broadcasters in other countries, some of its content is unlikely to be shown by commercial television companies in the free market. In addition, it is non-rivalrous: a person watching a programme does not decrease the availability of that programme for anyone else. It is also non-excludable: anyone with a television set can receive its programmes, whether they have paid for a licence or not.
3. It can be argued that Channel i and Gazi Television can be classified as private goods because they operate in the free market and viewers must pay to watch their programmes. They are also excludable services: it is not possible to receive the programmes unless a fee is paid to the companies. It could also be said that the private television stations have some of the characteristics of a public good, in that once a fee has been paid, consumption by one viewer does not diminish the availability of a programme for another fee-paying viewer.
17 Imperfect market Activity 1
(a) In today’s world, consumers can face a bewildering choice of alternative products or services. To find out all the information necessary to make a rational choice would take a long time. These websites aggregate all the information into one place enabling consumers not just to save time, but to have more information at their fingertips and so reduce asymmetric information.
(b) Not necessarily. The assumption is that these websites have done all the work and gathered all the information needed. However, this may not be the case and therefore the consumer may not get the opportunity to maximise their utility. There has also been the

© Pearson Education Ltd 2018. Copying permitted for purchasing institution only. This material is not copyright free.
suspicion that some websites may give preference to suppliers who might pay them more or offer other inducements.
Exam practice
1.(a) Tobacco is a good that creates considerable negative externalities when consumed. Illness and health problems resulting from its use create significant external costs. The cost of providing healthcare and benefits for those too ill to work is borne by the state and funded by taxpayers. These resources carry an opportunity cost: the finance needed may be better spent elsewhere, in order to create external benefits such as education.
(b) In theory, a rational consumer might weigh up the disadvantages of tobacco consumption and balance them against the satisfaction gained from doing so. Leaving aside the problem of addiction, a rational consumer in full possession of the facts is likely to cease consumption. However, as the extract suggests, such information is not always available. This may be due to lack of government provision and a lack of motivation on behalf of the tobacco companies who do not want to discourage sales.
2. A tax on tobacco would shift the supply curve vertically upwards by the amount of the tax, thus creating a higher equilibrium price. This would also reduce consumption and, in turn, reduce some of the negative externalities. However, the extent to which quantity will be reduced depends on the PED. A price elastic demand curve as shown in Figure 1 will see a much greater reduction in quantity from Q1 to Q2 than the price inelastic one in Figure 2.
Figure 1

© Pearson Education Ltd 2018. Copying permitted for purchasing institution only. This material is not copyright free.
Figure 2
Tobacco is very price inelastic because it is addictive. Not only are there no substitutes, but cutting consumption is not an attractive option either. A tax on tobacco will have some impact, but it may be a relatively small one. From the government’s point of view, it does go some way to raising the revenue needed to cope with some of the negative externalities created by tobacco. It is fair to say that taxes are more effective if used in conjunction with other measures such as education and programmes to help smokers quit.
18 Moral hazard, speculation and market bubbles
Activity 1
(a)
• It can be argued that the threat of losing one’s job, if a mistake is made or performance is not up to standard, motivates employees. Without that threat there is a risk of complacency and substandard work. This can have a negative impact on the service provided to the public, without risk to the employee.
• Knowing that the state will always provide free healthcare may make citizens less likely to be careful in the way they behave. Basic preventative routines may be ignored and bad habits developed.
• There has long been a controversial argument that welfare benefits make it too easy to remain unemployed. The cushion of a regular, although limited income, perhaps reduces the urgency of finding a job.
Activity 2
(a) There has been a large surge in demand caused by a fall in interest rates; this makes it much cheaper to borrow the money to buy property. At the same time, demand for buy-to-let

© Pearson Education Ltd 2018. Copying permitted for purchasing institution only. This material is not copyright free.
property has risen. Given a static supply of housing, prices have risen rapidly to create a property bubble.
(b) The supply of houses will increase as builders respond to higher property prices and the attraction of higher profits. This will begin to counter the surge in demand and cause prices to fall. If there is a rise in unemployment some people may be unable to continue with the payments on their homes and be forced to sell, which will also cause a rise in supply and downwards pressure on prices.
Exam practice
1. In 2016, house prices in China rose by as much as 40 per cent. This is much more than would normally be expected, even in a growing economy. In cities such as Shanghai and Beijing, prices rose by 5 per cent a month. The article also states that investors were rushing to invest in the property market, thus fuelling demand and driving up prices even further. These are all symptomatic of a bubble.
2. Investors want to make money and so choose an investment that will yield a return. Those with spare capital are likely to choose the area that will yield the most profit. Traditionally property markets increase in value, in real terms, over time and are often considered a safe bet. This is particularly so in China where a stock market crash meant many investors withdrew from stocks and bought property, encouraged by increasing property values.
3. Worried about the effects of the property bubble, the Chinese authorities began to increase regulation in the property market and began to make it harder to obtain a mortgage. Financial regulators also began to restrict property developers. The results were dramatic, with the price rise halting and even decreasing by 0.1 per cent and 0.4 per cent. Analysts expect prices to fall further by up to 5 per cent.
The problem for the government and local authorities is that the property boom has created wealth. Construction and real estate contributed 20 per cent of GDP growth in the first half of 2016. Construction creates jobs directly and indirectly, generating tax revenues and a demand for goods and services that fuels economic growth. The danger is that any further regulation might burst the property bubble causing a sudden drop in property prices as investors leave the market. This may cause a collapse of the construction industry with serious consequences for the Chinese economy in terms of employment and growth.

© Pearson Education Ltd 2018. Copying permitted for purchasing institution only. This material is not copyright free.
19 Purpose and methods of government intervention Activity 1
(a)
Figure 1
A tax per unit of between SGD 10 (US$7) and SGD 20 (US$14) per tonne of greenhouse gas emissions will shift the supply MPC upwards by the amount of the tax. If the Singaporean government has calculated correctly, the increase in tax will cover the difference between MPC and MSC so that the new equilibrium position is reached at 0B where MSB = MSC
(b) In 2015, the government reduced carbon tax on long-haul flights. The cut in tax will lower the cost of flying and lead to increased numbers of passengers flying. The data states that ‘£65 million in tax would be gained because of increased ticket sales’. Whether or not there is increased market failure as a result of the cut in carbon tax depends on whether or not current passenger levels are at the socially optimal level. In Figure 1, the socially optimal level of output is 0B where marginal social cost equals marginal social benefit. If current passenger numbers are currently 0C, then passenger numbers are below their optimal level. A cut in tax as proposed in 2015 will raise passenger numbers and move actual output towards 0B. If on the other hand, current passenger numbers are at their socially optimal level of 0B, the cut in tax will create market failure by increasing passenger numbers towards 0A. If current passenger numbers are currently greater than 0B, then the cut in carbon tax will increase market failure.

© Pearson Education Ltd 2018. Copying permitted for purchasing institution only. This material is not copyright free.
Activity 2
(a)
Figure 2
Without a subsidy the output in the kerosene market would be 0A. This level of consumption is below the optimal level of output 0B and does not maximise welfare. In the case of kerosene, it means that some poorer people would not be able to afford heating and lighting. By using a subsidy output increases to 0B where MSB = MSC.
(b) The government claimed that it expected a lower take-up of its subsidy scheme than proved to be the case. By 2014 it had already fulfilled its objectives in terms of solar farms, earlier than expected. Hence it decided to scrap the subsidy.
This can also be shown in a marginal social cost and benefit diagram. In Figure 3, the marginal private cost curve is MPC without a subsidy and equilibrium output is 0A. With the subsidy for the full period, the marginal cost curve shifts downwards to MC, leading to output of 0C. However, this is above the socially optimal level of output of 0B. So, the government cuts the subsidy partway through the programme to ensure that only 0B is produced.
Figure 3

© Pearson Education Ltd 2018. Copying permitted for purchasing institution only. This material is not copyright free.
Activity 3
(a) By reducing the price paid for a stent, the Indian government is imposing a maximum price 0F as shown in the diagram.
Figure 4
The result is that quantity demanded at the new lower price 0C exceeds the quantity supplied of 0A. In other words, there is a shortage.
(b)(i) At the original high cost of $3000 for a stent, the price of medical treatment was more than some people could afford. This meant an increase in the number of sick people who may not have been able to work and look after their families. This can be seen as an example of market failure which creates external costs, and as a result the government decided to intervene.
(ii) It all depends on the reaction of the suppliers. The extract states that the cost of production for Boston Scientific was $750. Given a maximum imposed price of $450 they would make a loss of $300, which is not sustainable. They may refuse to supply any more stents to the Indian market and the intervention is likely to have been unsuccessful. If, however, cheaper stents are available from other suppliers, or the government decides to subsidise the stents, then the intervention may be successful.
Activity 4
(a) The original use of asbestos, particularly in the 1950s and 1960s, has had a long-term impact on the health of some people, with 170 people dying each year. This creates negative externalities in terms of healthcare and the suffering of the victims and their families, which is a form of market failure.
To prevent further health problems, asbestos has to be removed very carefully and, in this case, it did not happen. Asbestos dust was released, which may create future illnesses and further market failure.
(b) By imposing regulations on the removal of asbestos, firms know that they must follow the correct procedures to avoid pollution and resulting externalities. If firms attempt to cut corners in order to save money they may be prosecuted and taken to court and fined. This is

© Pearson Education Ltd 2018. Copying permitted for purchasing institution only. This material is not copyright free.
what happened to Sealtec Otago Ltd. This case acts as a deterrent, both to the firm involved and to other contractors, thus preventing further market failure.
Activity 5
Street lighting is arguably a public good. It has the characteristics of both non-rivalry and non-excludability. It is non-rival because an individual receiving benefit from a street light does not prevent another person receiving the same benefit. It is non-excludable because once provided it is effectively impossible to prevent others from benefiting, given that streets and roads can be used by everyone.
(a) If left to free market forces, it is likely that there would be very few street lights. Households and firms would be reluctant to pay for street lights when others would receive most of the benefit. It could be the case that residents in a street or businesses on a particular road might club together to provide street lighting. However, they would face the free rider problem. Any household or businesses on the street could benefit without paying if everyone else paid. Moreover, the question states that households or firms would have to provide the land on which the street light would be erected. This further increases the likelihood that households or firms would not co-operate because of the free rider problem. One house might provide land for a street light that covered, say, ten houses. However, there is no obvious way in which the decision could be taken as to which house it would be.
(b) Subsidising households and firms would lead to greater provision of street lights than if left to free market forces. However, the extent to which a comprehensive system of street lighting would exist would be dependent on the extent of the subsidy. If the subsidy covered only a small fraction of the costs, take-up would be very small. If the subsidy covered almost all the costs, take-up would be much larger. However, the free rider problem would still exist. Many would not want a street light on their land. They would, instead, hope that a neighbour would provide the street light. They would also hope that someone else would pay the subsidy.
(c) Government providing street lighting and raising the revenue needed to cover costs through taxation is the only solution which is likely to lead to a systematic and comprehensive network of street lights. Government provision avoids the free rider problem. One problem with government provision is that households or firms might not want street lighting outside their homes or premises. Another problem is that the amount they pay in tax might not equal the benefit they individually put on street lighting. These are problems which occur with all government provided services.
Exam practice
1. D – reduce supply
2. An ad valorem tax is a tax that is placed on the value of a product. For example, in the UK, VAT is an ad valorem tax. The standard rate of VAT is 20 per cent and this is imposed at a set rate on motor fuel. So, if the cost of motor fuel is £1 before VAT, 20p tax is levied, leading to a final price of £1.20.
A specific tax is a tax placed on the volume sold of a product. So, fuel duty is imposed in the UK on motor fuel on each litre of motor fuel sold.
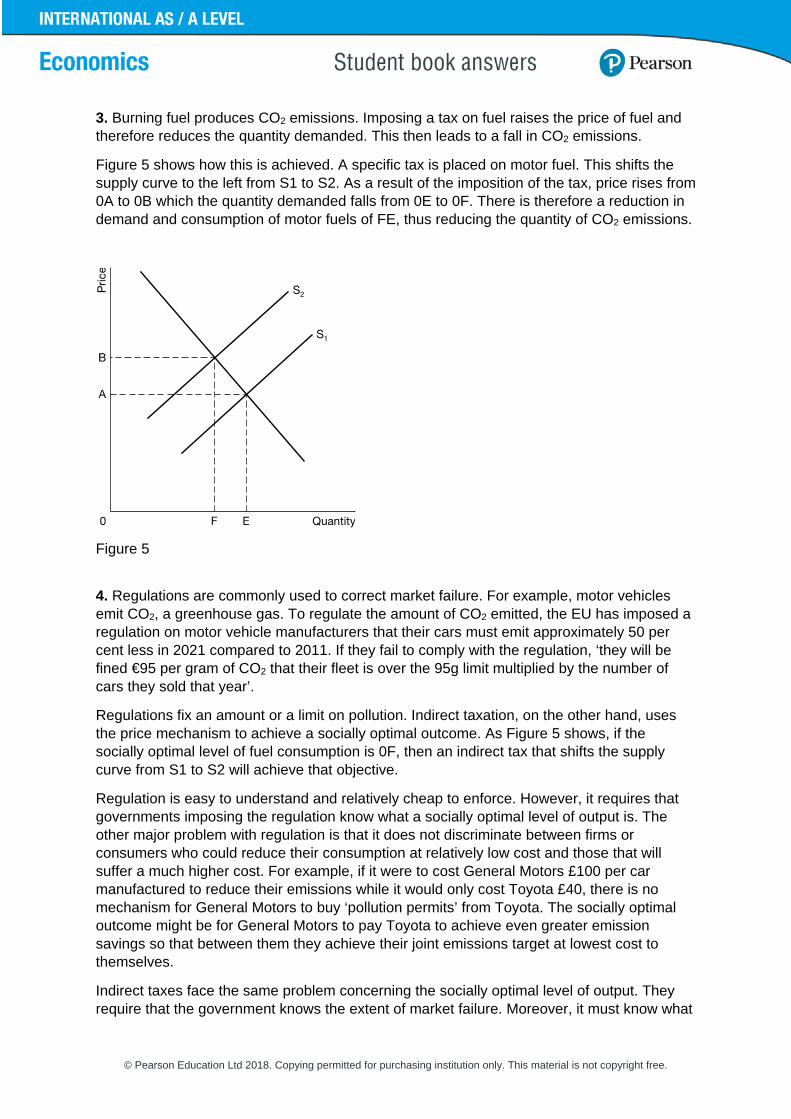
© Pearson Education Ltd 2018. Copying permitted for purchasing institution only. This material is not copyright free.
3. Burning fuel produces CO2 emissions. Imposing a tax on fuel raises the price of fuel and therefore reduces the quantity demanded. This then leads to a fall in CO2 emissions.
Figure 5 shows how this is achieved. A specific tax is placed on motor fuel. This shifts the supply curve to the left from S1 to S2. As a result of the imposition of the tax, price rises from 0A to 0B which the quantity demanded falls from 0E to 0F. There is therefore a reduction in demand and consumption of motor fuels of FE, thus reducing the quantity of CO2 emissions.
Figure 5
4. Regulations are commonly used to correct market failure. For example, motor vehicles emit CO2, a greenhouse gas. To regulate the amount of CO2 emitted, the EU has imposed a regulation on motor vehicle manufacturers that their cars must emit approximately 50 per cent less in 2021 compared to 2011. If they fail to comply with the regulation, ‘they will be fined €95 per gram of CO2 that their fleet is over the 95g limit multiplied by the number of cars they sold that year’.
Regulations fix an amount or a limit on pollution. Indirect taxation, on the other hand, uses the price mechanism to achieve a socially optimal outcome. As Figure 5 shows, if the socially optimal level of fuel consumption is 0F, then an indirect tax that shifts the supply curve from S1 to S2 will achieve that objective.
Regulation is easy to understand and relatively cheap to enforce. However, it requires that governments imposing the regulation know what a socially optimal level of output is. The other major problem with regulation is that it does not discriminate between firms or consumers who could reduce their consumption at relatively low cost and those that will suffer a much higher cost. For example, if it were to cost General Motors £100 per car manufactured to reduce their emissions while it would only cost Toyota £40, there is no mechanism for General Motors to buy ‘pollution permits’ from Toyota. The socially optimal outcome might be for General Motors to pay Toyota to achieve even greater emission savings so that between them they achieve their joint emissions target at lowest cost to themselves.
Indirect taxes face the same problem concerning the socially optimal level of output. They require that the government knows the extent of market failure. Moreover, it must know what

© Pearson Education Ltd 2018. Copying permitted for purchasing institution only. This material is not copyright free.
level of tax is required to achieve the socially optimal level of outcome. It could be, for example, that current indirect taxes on motor fuel are either too high or too low to achieve the socially optimal level of CO2 emissions. Indirect taxes take money away from taxpayers, whether households or firms. There may be unintended consequences of this. For example, if higher indirect tax revenues allow for direct taxes such as income tax to be lower, this might lead to increased inequality in society. A desire to raise more in tax, or reduce taxes, to fund government spending or reduce fiscal deficits may conflict with the objective of reducing market failure. Indirect taxes are also politically unpopular. Governments may not set indirect taxes high enough to eliminate market failure, for fear that they might lose the next election.
So, regulations and indirect taxes both have their advantages and drawbacks. What is also correct is that, in some cases, other solutions to correcting market failure are better than both of these methods. For example, with public goods, what is needed is direct government provision. Ensuring that the population is housed at reasonable cost might need the government to subsidise house building. Regulations and indirect taxes are just two of many policies that can be used to reduce market failure. Each individual situation might require a slightly different mix of policies to ensure a socially optimal allocation of resources at lowest cost.
20 Government failure Activity 1
(a) Markets fail, according to the data, because producers are able to sell goods that are not fit for human consumption. Consumers do not necessarily have the knowledge about the products they buy, which would enable them to make rational choices. So consumers, even in Victorian times, would not have wanted to buy diluted sulphuric acid when they thought they were buying vinegar. However, the data is also implying that consumers may be willing to buy goods, such as eggs, where they pay only the private cost and not the full social cost. Markets in countries such as Argentina, India, Ukraine and the USA are unlikely to take into account the value of cruelty to animals in the production of food. Hence, externalities are created.
(b) There is little disagreement that governments should intervene to make sure that firms sell products which are safe, and which conform to the description given to them. However, it could be argued that government regulation is too tight. It restricts the ability of individuals, for instance, to set up new businesses. Excessive government regulation, which discourages new businesses, creates costs, such as higher unemployment or loss of wealth generation. It also drives up the price of products. In the case of animal welfare, many food producers, including farmers, do not agree that practices such as battery hen production are cruel to animals. They, therefore, deny that such farming practices create externalities. If this were the case, then tighter government regulation to improve the living conditions of animals on farms is an unnecessary expense and simply leads to consumers having to pay too high a price for their food. Resources are misallocated because, instead of being able to spend more on clothes or holidays, consumers are being forced to pay for unnecessarily high standards of farming practice. Animal welfare groups would disagree and would probably argue that there are still considerable externalities present in the production of food. At its most extreme, this argument would suggest that any system that kills animals for food creates an externality in that humans have no right to kill any animal to eat.

© Pearson Education Ltd 2018. Copying permitted for purchasing institution only. This material is not copyright free.
Exam practice
1. B – the administrative cost is greater than the social benefits.
2. Market failure occurs where resources are inefficiently allocated due to imperfections in the working of the market mechanism. The existence of externalities, for example, shows there is market failure. Government failure occurs when government intervention leads to a net welfare loss compared to the free market solution. For example, government failure would occur if government intervened in a market and created even larger externalities than the ones already present.
3.(a) It can be argued that there is market failure in the fuel market. This is because the burning of fossil fuels, such as coal and gas, create greenhouse gas emissions that, in turn, create global warming. The market price of coal and gas does not reflect the value of these externalities. Therefore, too much coal and gas is burnt.
Biofuels are a potential solution to this market failure. Biofuels are a form of renewable energy. They generate approximately zero greenhouse gas emissions in the fuel cycle. This is because, although they create greenhouse gases when burnt, they absorb the equivalent amount of greenhouse gases when they grow. Hence, they are a way of solving the problem of market failure in the market for fuel.
(b) Increasing the output of biofuels could create an example of government failure because it might increase the incidence of market failure. When fuels are created from crops, it reduces the amount of food crops available to the market. If this raises the price of food crops and results in low-income households around the world being able to buy less food as a result, then the benefits from fewer greenhouse emissions may be outweighed by the losses from increased malnutrition. Government intervention in the market has led to an overall loss of welfare, an example of government failure.
In the case of wood pellets, critics of their use claim that some are coming from the chopping down of whole trees. Wood is being burnt which creates greenhouse gases. However, if the trees are not replaced, then the carbon is not reabsorbed back into the newly planted growing trees. This is no worse than burning coal or gas. However, it does not lessen market failure. This policy, therefore, would not be an example of government failure, but it is an example of where government intervention fails to improve market outcomes.
4. There are many sources of government failure. Information gaps are just one of them. Governments make a wide variety of decisions. The longer the time period involved, the more likely it is that there will be government failure. Take, for example, the case of global warming. Scientists disagree about the exact causes of global warming, its extent and how best to tackle the issue. Despite this, governments are having to act now to mitigate future temperature rises. Burning wood pellets, described in the data, might seem a good solution to reduce carbon emissions. However, according to the data, both the UK government and US regulators lack information about where the wood is being sourced. It makes a difference if the wood pellets are coming from virgin trees that are not being replaced, rather than offcuts or thinnings.
Policies to combat global warming also illustrate another source of government failure: unintended consequences. It might seem a good idea to burn crops for conversion to biofuels. However, an unintended consequence might be greater levels of malnutrition in developing countries when the price of food rises due to a fall in production.

© Pearson Education Ltd 2018. Copying permitted for purchasing institution only. This material is not copyright free.
‘Food versus fuel’ illustrates another source of government failure: conflicting objectives. The UK government may decide that making a contribution to reducing greenhouse gas emissions is more important than preventing a rise in world food prices. Governments in countries such as India or Kenya may disagree. It may only be in 100 years’ time that a valid analysis can be made about who was correct. If global warming has been much worse than expected and billions of humans have died as a result, then some extra cases of malnutrition today might be a small price to pay for preventing even further rises in temperature in the future. If global warming has been much less severe than predicted, then a higher value might be put on preventing malnutrition today. Another example of this issue is provided in the data. Should releasing coal reserves in Queensland, Australia, by building the world’s largest seaport, be deemed more important than resulting potential damage to the Great Barrier Reef?
Biofuels can also illustrate the problem of distortion of price signals. When governments intervene in markets, such as subsidising biofuels, they distort free market signals. In the case of wood pellets, for example, subsidies create a demand for wood pellets that, in turn, act as an incentive to cut down virgin trees. Yet there may be a loss of welfare if the trees are not replanted. Distorting free market signals may cause more problems than the problems that are resolved as a result.
Excessive administrative costs are another source of government failure. An example would be attempts by government to place unemployed workers in a job. Reducing unemployment is generally considered to have positive benefits. However, some government schemes have been failures because the cost of placing a worker in a job has been so high. If it costs £60,000 to place a worker in a job paying £15,000 a year, there is likely to have been government failure.
Politicians maximising their own welfare is another source of government failure. In the case of the new port at Abbot Point in Australia, it could be that individual politicians in government responsible for making the decision decided that it was in their best interests to give the go ahead for the port despite knowing that, overall, there would be a loss of economic welfare due to the damage to the Great Barrier Reef. Politicians need to win elections in order to survive. Making decisions that are most likely to help them win elections may or may not coincide with making decisions that maximise the welfare of those they represent.
Overall, information failure is only one of many sources of government failure. In individual cases, it may be the most important source. Overall, however, it is unlikely to the main source of government failure.