1 do women pay more for credit? evidence from italy alberto alesina - harvard university francesca...
TRANSCRIPT

1
Do Women Pay More for Credit?
Evidence from Italy
Alberto Alesina - Harvard University
Francesca Lotti, Paolo E. Mistrulli
Bank of Italy
The views expressed here are those of the authors and do not necessarily reflect those of the Bank of Italy

2
Why should we care?Virtually every agenda drafted by the European Commission states that…
Women are an untapped resource for growth,
both as enrtrepreneurs and as workers
Many workplaces not only have a glass ceiling
but also a glass door, which keeps out women
and ethnic minorities

3
Some figures (I)

4
Some figures (II)

5
Or focus is…… on microfirms and self employment.
Those sole proprietorship firms account for nearly 68% of the total in IT (> 3 million of firms out of 5). Of these small firms, one out of four is owned by a woman
Why this kind of firm?– Gender classification is straightforward– Self employment and greenfield entry mainly occur in this
category– Heavily rely on banks as a source of external finance– More likely to suffer from credit constraints

6
Or focus is…… on overdraft facilities (credit lines) held by those microfirms.
Why this kind of loan?
– for very small firms and self-employed individuals, overdraft facilities are the main form of credit and liquidity management.
– these loans are highly standardized among banks– are not granted for some specific purpose: so their
pricing is highly associated with the borrower-lender relationship, thus providing us with a better tool for testing gender discrimination.

7
Digression on discrimination
Literature on discrimination focused mainly on the labor market
“Collective” vs “competitive” models- In collective models, groups acts collectively against
each other
- Competitive models study individual maximizing behavior that may include discrimination
- Taste-based (Becker, ‘57)
- Statistical models of discrimination (Phelps, ‘72 & Arrow, ‘73)

8
Digression on discrimination
Statistical models of discrimination, are the solution to a signal extraction problem.
Firms have limited information about the skills of job applicants. This gives them an incentive to use easily observable characteristics such as race or gender to infer the expected productivity of applicants, if there are reasons to believe that these characteristics are correlated with productivity (“profiling behavior”).

9
Digression on discrimination
Becker’s 1957 book introduced the first economic model of discrimination (Taste-based discrimination).
In this model, employers hold a “taste for discrimination”, meaning that there is a disamenity value to employing minority workers.
Minority workers may have to “compensate” employers by being more productive at a given wage or, equivalently, by accepting a lower wage for identical productivity.

10
Discrimination in the credit markets
Discrimination in credit markets can work along different dimensions:
- loan approval rates or
- interest rates charged
differ across groups with equal ability to repay.
End of the digression.

11
Back to the questionDo Women-Owned Business Pay More for Credit?
Yes, we find robust evidence that female owned firms pay, at least, 30 basis point more than their male counterparts.
Our strategyWe try to address - and control for - every possible (meaning feasible) hyphothesis that economic theory would suggest, until we are left with a unique explanation
Taste-based discrimination

12
Taste based discrminination in the credit market
Mainly on the US, focused on racial discrimination. - Cavalluzzo and Cavalluzzo ‘98; Blanchflower, Levine
and Zimmerman ‘03. Evidence that is consistent with discrimination against African-Americans in the market for small business loans. Little evidence on gender.
- They focus not on interest rates charged but on denials of credit applications.
More recently:- Ravina ‘08: personal characteristics like beauty (and
race) seem to be correlated with credit conditions, even though not correlated with repayment records.

13
The Data (I)Two main sources:
1) Central Credit Register run by the Bank of Italy- Detailed information on firms and individuals whose
loans are > 75,000 euro.
2) Bank of Italy Loan Interest Rate Survey - Information on interest rates charged on each bank loan
granted by a sample of about 200 Italian banks. The sample is highly representative of the Italian market for loans to small firms.
- These banks account for over 80 percent of the total lending granted to self employed and microfirms.
- The sample is representative of the universe of Italian banks in terms of bank size, category and location.

14
The Data (II)Our sample:• 1.2 million loans (16% F)• to nearly 150 thousand firms (18% F)• for 12 quarters, from Jan 2004 to Dec 2006.
Cleaning:• trimming to the 1-99 pct of the interest rate distribution. • excluded those firms recipients of government subsidies
subsidized interest rate + exclusion of “marginal” firms, i.e. those firms that wouldn't enter the market without a subsidy and/or that may be listed in a woman's name just to receive state aids.

15
Credit lines & small firms (I)
Female Male Female Male
North East 17.2 82.8 15.4 84.6North West 16.8 83.2 14.8 85.2Center 20.4 79.6 18.0 82.0South & Islands 18.3 81.7 16.9 83.1
Total 18.0 82.0 16.1 83.9
Firms Credit lines
Table 2 - Firms and credit lines: geographical distribution (in %)
FEMALE firms have, on average, less credit lines than MALE firms.This may hint at the possibility of a higher denial ratio for women (no data, unfortunately) recall that one firm out of four is female-run, according to the business register.
25% F firms, 18% with loans > 75th euros, 16 % credit lines to F.

16
Credit lines & small firms (II)Table 3 - Firms and credit lines: sectorial distribution (in %)
Female Male Female Male
Manufacturing 17.9 82.1 15.8 84.2
Constructions 2.8 97.2 2.5 97.5
Retail & Wholesale trade 25.1 74.9 22.9 77.1
Hotels & Restaurants 34.3 65.7 32.8 67.2Credit & Insurance interm. (excl. banks) 6.9 93.1 6.4 93.6
Business Services 17.0 83.0 14.3 85.7
Total 18.0 82.0 16.1 83.9
Share of firms Share of loans

17
Credit lines & small firms (III)Table 4 - Credit lines' size (in euro)
Credit lines to women tend to be smaller
Global loans size a
Female Male Female Male
Below 250,000 65.1 55.5 34,060 36,850Between 250,000 and 2,500,000 34.2 42.7
84,889 83,388
Between 2,500,000 and 100,000,000 0.7 1.8
253,401 305,205
Total 100 100 53,048 61,511
(a) Loan size refers to the firms' total outstanding loans.
Share of credit lines in %Average granted credit
per line in euro

18
Credit lines & small firms (IV)Table 5 - Average credit drawn per line (in euro)
Average drawn from credit line in absolute value is similar betweenmen and women, but women draw a slightly higher share of their lines.
Global loans size a
Female Male Female Male
Below 250,000 27,840 28,749 81.7 78.0Between 250,000 and 2,500,000
59,757 59,886 70.5 71.9
Between 2,500,000 and 100,000,000
177,526 219,884 70.0 72.1
Total 39,850 45,455 75.2 73.9
(a) Loan size refers to the firms' total outstanding loans.(b) The credit line usage is the ratio of drawn to granted credit, in percentage.
Average drawn credit per line in euro Credit line usage b

19
Credit lines & risk perceptionTable 6 - Share of secured loans (in %)
A higher percentage of loans to women are accompanied by external guarantees, often a person guarantor.
Global loans sizea
Female Male
Below 250,000 58.0 54.0
Between 250,000 and 2,500,000 60.0 53.8Between 2,500,000 and 100,000,000 62.0 42.9
Total 58.7 53.7
(a) Loan size refers to the firms' total outstanding loans.(b) Secured loans are backed up by either physical and financial assets posted by a third party, which the lender can realize
Share of secured credit linesb

20
Are Female firms worse borrowers?• Presence of bad loans:
0.46% for M versus 0.44% for F (credit lines) 1.3% for M, 1.1% for F (firms)
• Bankruptcies, from the Chamber of Commerce. 2.2% for M, 1.9% for F (failure rate) 6.0% for M, 4.9% for F (includes liquidations)
So, there is no evidence that firms owned by women go bankrupt more than firms owned by men.

21
Summing up …
• Female firms are roughly equally distributed
across Italy• Women-owned businesses obtain somewhat
smaller loans• Women seem to have a better credit history then
men on average and are less likely to go bankrupt.
• Nevertheless, more women are asked to post a
guarantee when they obtain a loan.

22
The modeling framework
i = f (gender, fixed effects) BASELINE SPECIFICATION
then ADD more controls & variables, like• other firm’s characteristics• bank’s charact.• credit market charact.• social capital• credit history (reputation)
and look at the coeff of the gender variable
Fixed effects: quarterly, industry (3dgt), province dummiesi = net interest rate (observed interest rate minus ECB marginal rate on lending facilities)

23
Basic regression(1) (2) (3) (4) (5) (6)
Female 0.285*** 0.274 *** 0.291*** 0.178*** 0.163*** 0.202***(0.019) (0.018) (0.020) (0.019) (0.018) (0.020)
Craftsmen -0.073*** -0.023 -0.099***(0.020) (0.020) (0.021)
Age -0.017*** -0.904*** -0.018***(0.001) (0.026) (0.001)
Loan size (class) -0.248*** -0.264*** -0.171***(0.005) (0.005) (0.004)
Bad Loans 1.805*** 1.724*** 0.526***(0.068) (0.064) (0.053)
Bank fixed effects No Yes No No Yes No
Estimate OLS OLS Panel R.E. OLS OLS Panel R.E.
N. obs. 1,209,078 1,209,078 1,209,078 1,122,556 1,122,556 1,122,556

24
Interest rates & secured loans
(1) (2) (3) (4)
Female 0.280*** 0.382*** 0.395*** 0.246***(0.019) (0.026) (0.022) (0.020)
Guarantor 0.104*** 0.133***(0.012) (0.013)
Male Guarantor 0.186***(0.026)
Female Guarantor -0.048***(0.014)
Female* Guarantor -0.183***(0.032)
Female * Male Guarantor -0.426***(0.040)
Female * Female Guarantor 0.428***(0.062)
N. obs. 1,209,078 1,209,078 1,209,078 1,209,078
A female borrower guaranteed by a female pays nearly 43 basis points more than anon-guaranteed man and 62 more than a woman guaranteed by a man.
25
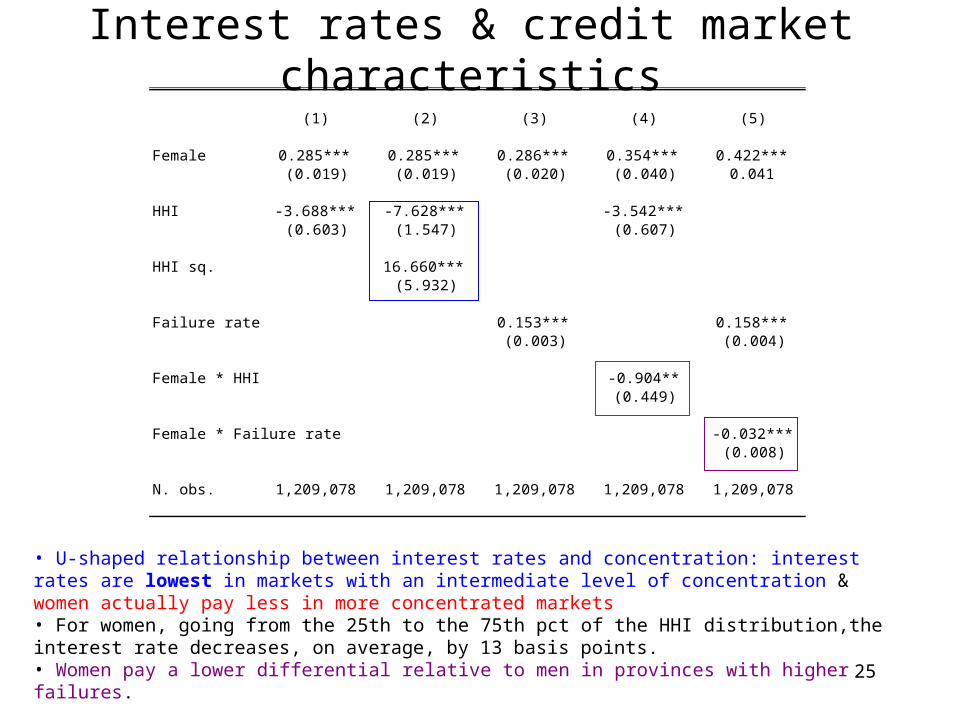
Interest rates & credit market characteristics
• U-shaped relationship between interest rates and concentration: interest rates are lowest in markets with an intermediate level of concentration & women actually pay less in more concentrated markets• For women, going from the 25th to the 75th pct of the HHI distribution,the interest rate decreases, on average, by 13 basis points.• Women pay a lower differential relative to men in provinces with higher failures.
(1) (2) (3) (4) (5)
Female 0.285*** 0.285*** 0.286*** 0.354*** 0.422***(0.019) (0.019) (0.020) (0.040) 0.041
HHI -3.688*** -7.628*** -3.542***(0.603) (1.547) (0.607)
HHI sq. 16.660***(5.932)
Failure rate 0.153*** 0.158***(0.003) (0.004)
Female * HHI -0.904**(0.449)
Female * Failure rate -0.032***(0.008)
N. obs. 1,209,078 1,209,078 1,209,078 1,209,078 1,209,078

26
Social Capital & Interest RatesSocial capital and different levels of trust may be associated with more or less “secure” relationships between a borrower and a bank.
Thus, in a place with higher trust, a bank may charge lower interest rates.
Accordingly, we investigate whether this is the case and whether the male/female rate differential is present only in low social capital places and is the result of lack of generalized trust.
Measure of Social Capital: newspapers, blood donations, members of sport associations.

27
Social Capital & Interest Rates
More social capital and trust bring about lower rates of interest. 25th-75 pct of the social capital distribution interest rates decrease by 20 basis points.
Failure rate does not wipe out the social capital coefficients: the effect of social capital cannot be that failure rates are lower with more social capital.
If the F/M differential were driven mostly or exclusively by provinces with low social capital, the coefficient on the female dummy should go down when we control for social capital, but it does not!
(1) (2) (3) (4) (5) (6)
Female 0.278*** 0.278*** 0.282*** 0.289*** 0.289*** 0.288***(0.020) (0.020) (0.020) (0.020) (0.020) (0.020)
N. of newspapers -0.426*** -0.450***(0.016) (0.016)
Blood Donations -0.661*** -0.492***(0.023) (0.023)
Members of sport associations -0.219*** -0.069***(0.015) (0.015)
Failure rate 0.156*** 0.142*** 0.149***(0.003) (0.003) (0.003)
N. obs. 1,209,078 1,209,078 1,209,078 1,209,078 1,209,078 1,209,078

28
Social Capital & Interest Rates
Social capital reduces rates on all borrowers but more on men than on women.
The beneficial effect of social capital is unevenly distributed across genders.
(1) (2) (3)
Female -0.154 -0.080 -0.145(0.179) (0.184) (0.161)
N. of newspapers -0.442***(0.017)
Blood Donations -0.680***(0.025)
Members of sport associations -0.235***(0.016)
Female * N. of newspapers 0.099**(0.041)
Female * Blood Donations 0.112*(0.057)
Female * Sport associations 0.103***(0.039)
N. obs. 1,209,078 1,209,078 1,209,078
29
Relationship Banking & Interest Rates
The theory suggests that the length of the banking relationship can ease credit conditions.
If there is a problem of signaling, we would expect banks to lower interest rates to the same firm with time passing by.
In other words, once firms’ characteristics are revealed to the bank, the loan should be priced correctly.

30
“Reputation” & Interest Rates
(1) (2) (3) (4)
Female 0.217*** 0.246*** 0.108*** 0.130***(0.019) (0.019) (0.032) (0.040)
Length of bank relationship -0.025*** -0.026***(0.001) (0.001)
Dummy (length relationship>3 yrs) -0.501*** -0.531***(0.013) (0.015)
Female * 0.005*** Length of bank relationship (0.001)
Female * 0.165*** Dummy (length relationship>3 yrs) (0.033)
N. obs. 1,209,078 1,209,078 1,209,078 1,209,078
For all firms, every year - on average, interest rates decrease by 2.5x4=10 basis points
Firms w/ a bank relationship >3 yrs, have an average “discount” of 53 b.p., but for F the discount is lower, i.e. 36 b.p.

31
“Reputation” & Interest RatesWe then estimate the impact of the length banking relationship
on interest rates, separately for M and F
-1
-0.8
-0.6
-0.4
-0.2
0
0.2
0 4 8 12 16 20 24 28 32 36
Quarters
Females
Males

32
Robustness checks
• In order to rule out the possibility that a F firm is a “sham” business just listed in a woman’s name, we excluded from the sample those F firms whose proprietor has co-signed a loan with someone who defaulted;
• also, we excluded the South from the analysis…
• … but the results hold.
33
Summing up • We have examined the pattern of lending rates on overdraft facilities in Italy with a unique and large data set.
• We document that women pay a higher interest rate even after controlling for a host of characteristics of the borrower, the bank and the structure of the banking sector.
• We tried to control as well as we could for risk factors like type of business, past credit history and the presence of guarantors, but the differential remains.

34
Summing up
• In places with higher social capital and trust, banks charge lower interest, and the amount of this effect is quite large…
• but the differential between male and female borrowing rates is not confined in places with low social capital.
• Both men and women pay lower interest in places with high social capital, but women benefit less.

35
Summing up• Women show a better credit history then men
• Guarantors are considered a risk factor for men:• male borrowers are charged more if they have to post a guarantor;
• for women, it is the opposite: when they post a male guarantor, their interest goes down, but, interestingly, if they have a female guarantor, the interest they pay goes way up.
• Length of banking relationship helps lowering interest rate, more for M then for F. More interestingly, F seem to suffer from a “skepticism” period.

36
Conclusions The perfect test would have required to look at the differential behavior of “female banks”, but in Italy the presence of women in banks’ board is rarefied.
Women-owned firms pay more than men in Italy for overdraft facilities…
…and this difference does not seem to be explained by any variable capturing observable differential risk, directly or indirectly.