1 copyright © 2013, oracle and/or its affiliates. all rights … · •enhanced support for...
TRANSCRIPT

Copyright © 2013, Oracle and/or its affiliates. All rights reserved. 1
<Insert Picture Here>
Improve Efficiency With Anytime Access to Business Intelligence
Robin J Hazel, Oracle, Director of BI and EPM Solutions
Kshitij Kumar, Apps Associates, CTO and Global VP of BI/EPM
Copyright © 2013, Oracle and/or its affiliates. All rights reserved. 3
The following is intended to outline our general product direction. It is
intended for information purposes only, and may not be incorporated into
any contract. It is not a commitment to deliver any material, code, or
functionality, and should not be relied upon in making purchasing
decisions. The development, release, and timing of any features or
functionality described for Oracle’s products remains at the sole
discretion of Oracle.
Copyright © 2013, Oracle and/or its affiliates. All rights reserved. 4
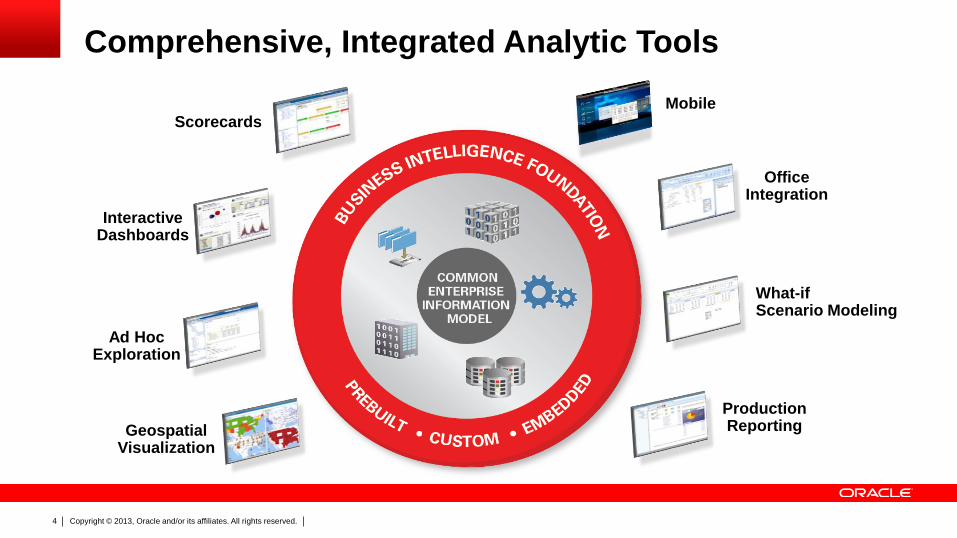
Comprehensive, Integrated Analytic Tools
Office Integration
What-if Scenario Modeling
Mobile
Production Reporting Geospatial
Visualization
Ad Hoc Exploration
Scorecards
Interactive Dashboards
Copyright © 2013, Oracle and/or its affiliates. All rights reserved. 5
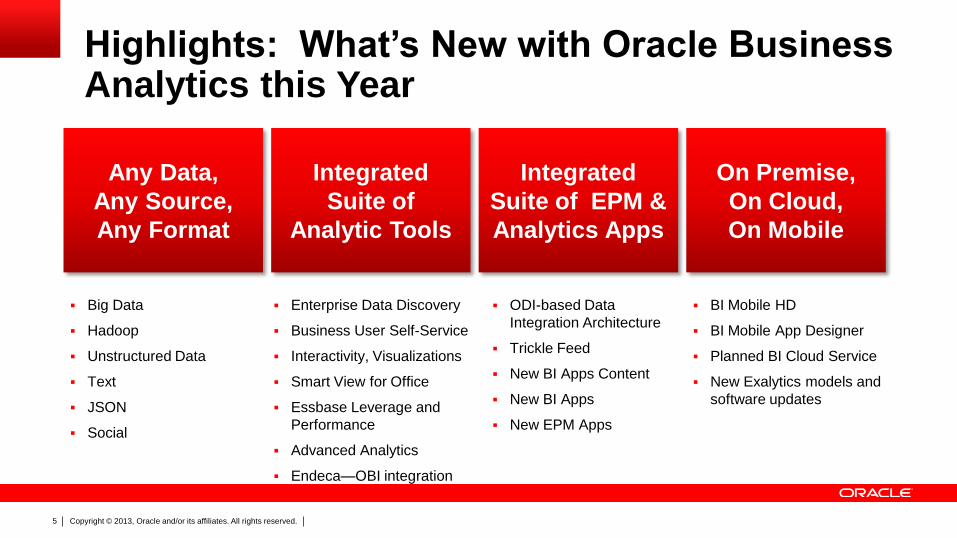
Highlights: What’s New with Oracle Business Analytics this Year
Integrated
Suite of EPM &
Analytics Apps
Any Data,
Any Source,
Any Format
Integrated
Suite of
Analytic Tools
On Premise,
On Cloud,
On Mobile
Enterprise Data Discovery
Business User Self-Service
Interactivity, Visualizations
Smart View for Office
Essbase Leverage and
Performance
Advanced Analytics
Endeca—OBI integration
ODI-based Data
Integration Architecture
Trickle Feed
New BI Apps Content
New BI Apps
New EPM Apps
BI Mobile HD
BI Mobile App Designer
Planned BI Cloud Service
New Exalytics models and
software updates
Big Data
Hadoop
Unstructured Data
Text
JSON
Social
Copyright © 2013, Oracle and/or its affiliates. All rights reserved. 6
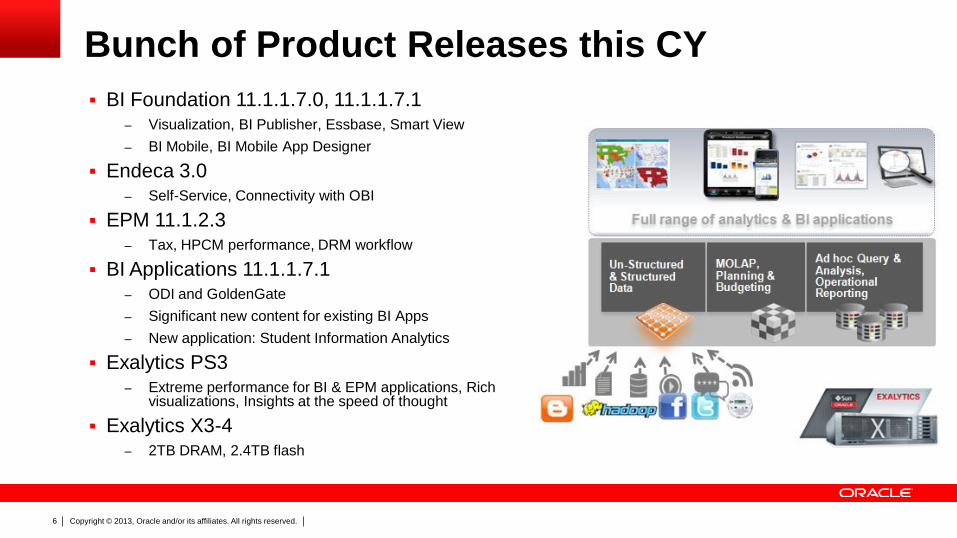
Bunch of Product Releases this CY
BI Foundation 11.1.1.7.0, 11.1.1.7.1 – Visualization, BI Publisher, Essbase, Smart View
– BI Mobile, BI Mobile App Designer
Endeca 3.0 – Self-Service, Connectivity with OBI
EPM 11.1.2.3 – Tax, HPCM performance, DRM workflow
BI Applications 11.1.1.7.1 – ODI and GoldenGate
– Significant new content for existing BI Apps
– New application: Student Information Analytics
Exalytics PS3 – Extreme performance for BI & EPM applications, Rich
visualizations, Insights at the speed of thought
Exalytics X3-4 – 2TB DRAM, 2.4TB flash

Copyright © 2013, Oracle and/or its affiliates. All rights reserved. 7
BI Foundation 11.1.1.7 New and Improved Visualizations
100% Stacked Bar Compare distributions within categories and also
display the differences between categories
View Suggestions An algorithm will determine which visualization type
would be best suited for the display of current data
Freeze Headers Anchor the header for large tables or pivot views
Trellis Chart Grid Data-dense view type displays large amounts of
data for comparative analysis.
Performance Tiles Immediately reveals summary metrics to the end
user that will likely also be presented in larger, more
detailed Dashboard views.
Waterfall Determine how an initial value is affected by a
series of intermediate positive or negative values
Copyright © 2013, Oracle and/or its affiliates. All rights reserved. 8
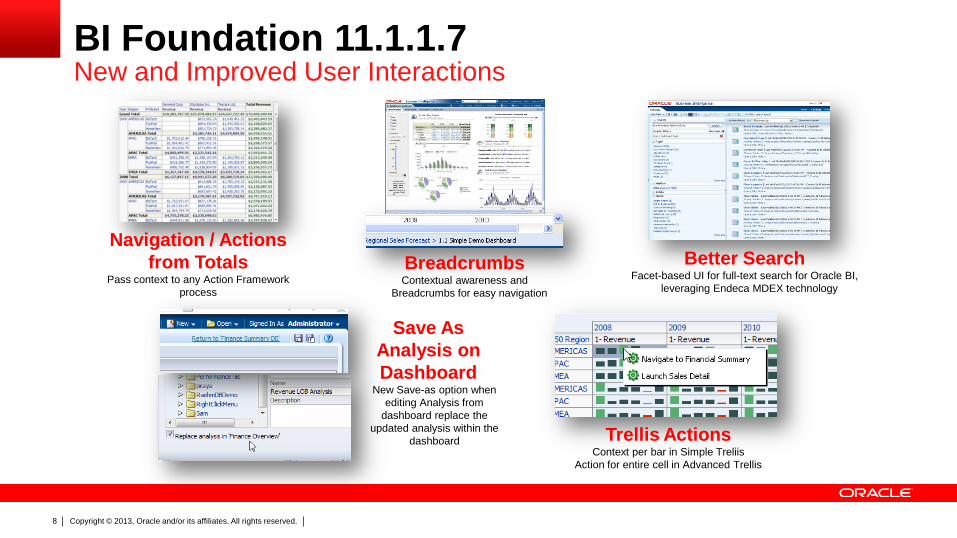
BI Foundation 11.1.1.7 New and Improved User Interactions
Better Search Facet-based UI for full-text search for Oracle BI,
leveraging Endeca MDEX technology
Save As
Analysis on
Dashboard New Save-as option when
editing Analysis from
dashboard replace the
updated analysis within the
dashboard
Breadcrumbs Contextual awareness and
Breadcrumbs for easy navigation
Trellis Actions Context per bar in Simple Treliis
Action for entire cell in Advanced Trellis
Navigation / Actions
from Totals Pass context to any Action Framework
process

Copyright © 2013, Oracle and/or its affiliates. All rights reserved. 9
BI Foundation 11.1.1.7 Shared Office Integration between EPM and BI with SmartView
BI Presentation Catalog in Smart View
• Smart View 11.1.2.2 replaces the existing Oracle
BI Add-in as the primary Office application
• Full support for BI dashboard page and report
prompts
• Enhanced security including single sign-on
Export Dashboards & Dashboard Content
• Export Report in Native Excel & PowerPoint
formats (2003, 2007+)
• Export Dashboard or Dashboard page; Dashboard
pages appear as separate Excel worksheets
BI View Creation in Smart View
• Answers View creation from Excel
• Save in Excel or as an Answers View
• Publish and save in the OBIEE Web Catalog
• OBI Data is accessible to other Smart View
providers (e.g. Planning, HFM, DM)
Copyright © 2013, Oracle and/or its affiliates. All rights reserved. 10
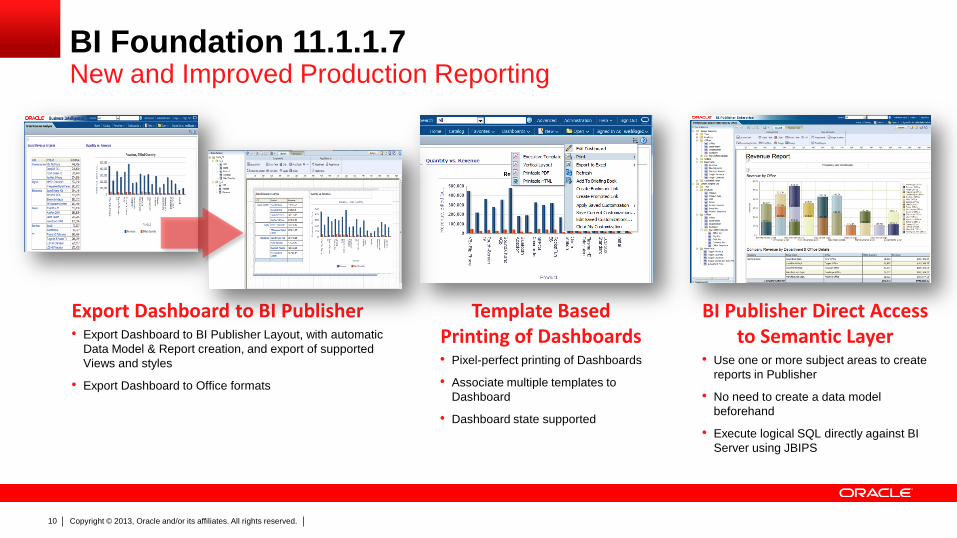
BI Foundation 11.1.1.7 New and Improved Production Reporting
Export Dashboard to BI Publisher • Export Dashboard to BI Publisher Layout, with automatic
Data Model & Report creation, and export of supported
Views and styles
• Export Dashboard to Office formats
Template Based Printing of Dashboards • Pixel-perfect printing of Dashboards
• Associate multiple templates to
Dashboard
• Dashboard state supported
BI Publisher Direct Access to Semantic Layer
• Use one or more subject areas to create
reports in Publisher
• No need to create a data model
beforehand
• Execute logical SQL directly against BI
Server using JBIPS
Copyright © 2013, Oracle and/or its affiliates. All rights reserved. 11
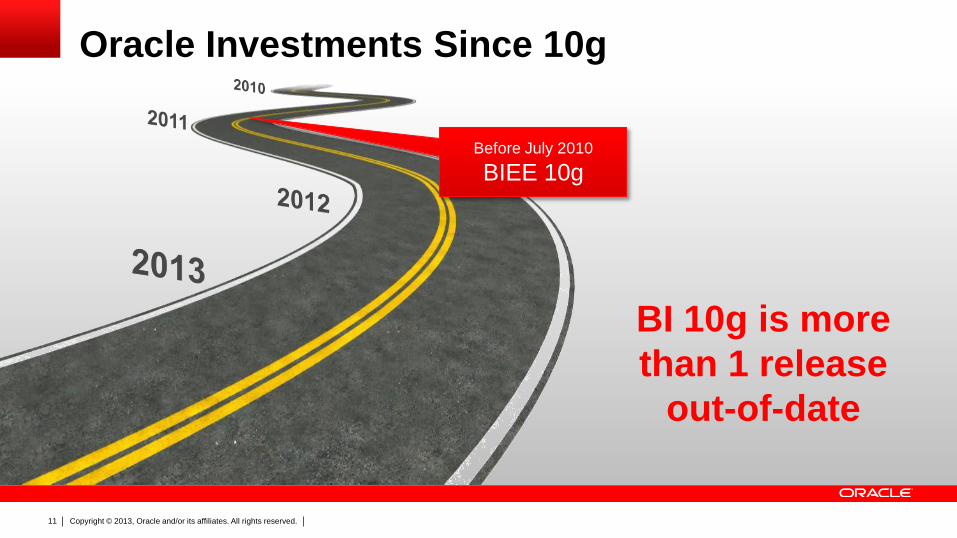
Oracle Investments Since 10g
Before July 2010
BIEE 10g
BI 10g is more
than 1 release
out-of-date
Copyright © 2013, Oracle and/or its affiliates. All rights reserved. 12
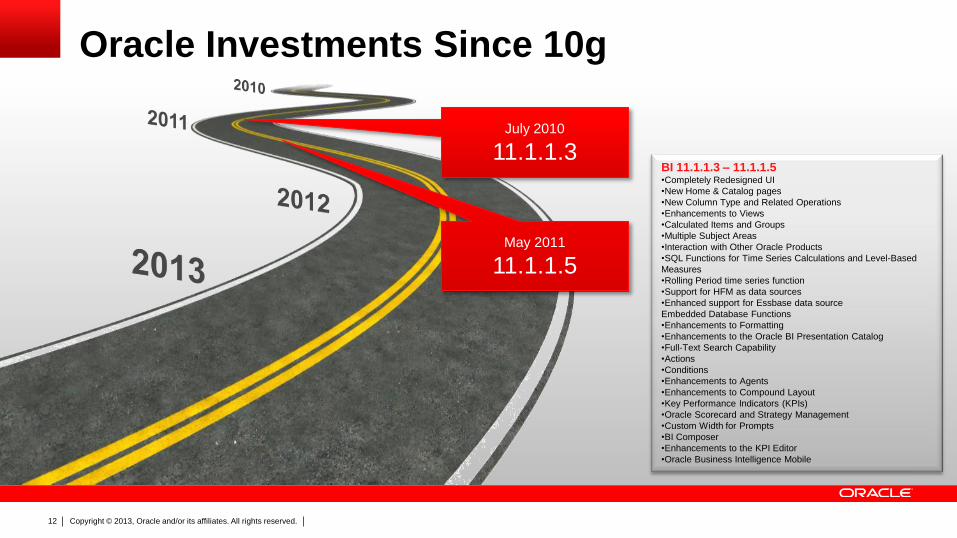
Oracle Investments Since 10g
July 2010
11.1.1.3
May 2011
11.1.1.5
BI 11.1.1.3 – 11.1.1.5 •Completely Redesigned UI
•New Home & Catalog pages
•New Column Type and Related Operations
•Enhancements to Views
•Calculated Items and Groups
•Multiple Subject Areas
•Interaction with Other Oracle Products
•SQL Functions for Time Series Calculations and Level-Based
Measures
•Rolling Period time series function
•Support for HFM as data sources
•Enhanced support for Essbase data source
Embedded Database Functions
•Enhancements to Formatting
•Enhancements to the Oracle BI Presentation Catalog
•Full-Text Search Capability
•Actions
•Conditions
•Enhancements to Agents
•Enhancements to Compound Layout
•Key Performance Indicators (KPIs)
•Oracle Scorecard and Strategy Management
•Custom Width for Prompts
•BI Composer
•Enhancements to the KPI Editor
•Oracle Business Intelligence Mobile
Copyright © 2013, Oracle and/or its affiliates. All rights reserved. 13
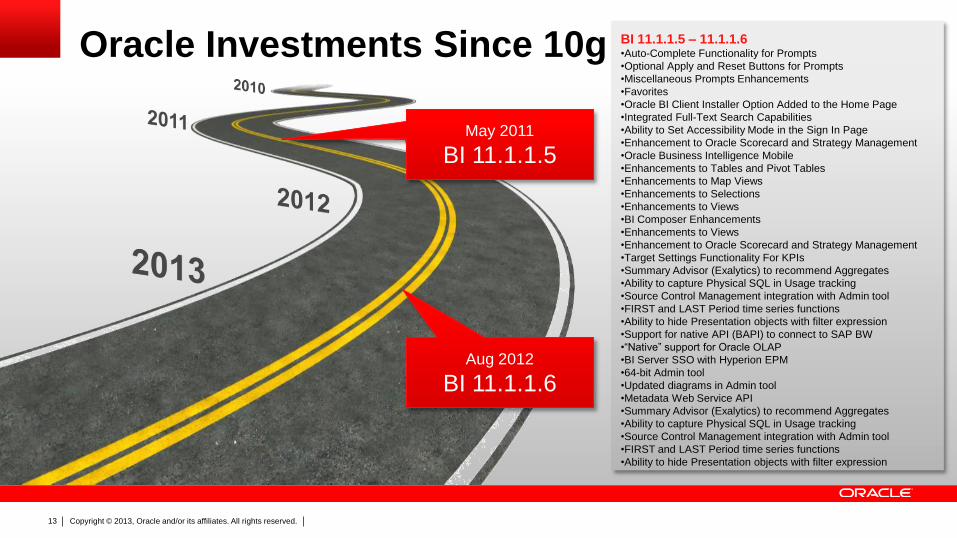
Oracle Investments Since 10g
BI 11.1.1.5 – 11.1.1.6 •Auto-Complete Functionality for Prompts
•Optional Apply and Reset Buttons for Prompts
•Miscellaneous Prompts Enhancements
•Favorites
•Oracle BI Client Installer Option Added to the Home Page
•Integrated Full-Text Search Capabilities
•Ability to Set Accessibility Mode in the Sign In Page
•Enhancement to Oracle Scorecard and Strategy Management
•Oracle Business Intelligence Mobile
•Enhancements to Tables and Pivot Tables
•Enhancements to Map Views
•Enhancements to Selections
•Enhancements to Views
•BI Composer Enhancements
•Enhancements to Views
•Enhancement to Oracle Scorecard and Strategy Management
•Target Settings Functionality For KPIs
•Summary Advisor (Exalytics) to recommend Aggregates
•Ability to capture Physical SQL in Usage tracking
•Source Control Management integration with Admin tool
•FIRST and LAST Period time series functions
•Ability to hide Presentation objects with filter expression
•Support for native API (BAPI) to connect to SAP BW
•“Native” support for Oracle OLAP
•BI Server SSO with Hyperion EPM
•64-bit Admin tool
•Updated diagrams in Admin tool
•Metadata Web Service API
•Summary Advisor (Exalytics) to recommend Aggregates
•Ability to capture Physical SQL in Usage tracking
•Source Control Management integration with Admin tool
•FIRST and LAST Period time series functions
•Ability to hide Presentation objects with filter expression
Aug 2012
BI 11.1.1.6
May 2011
BI 11.1.1.5
Copyright © 2013, Oracle and/or its affiliates. All rights reserved. 14
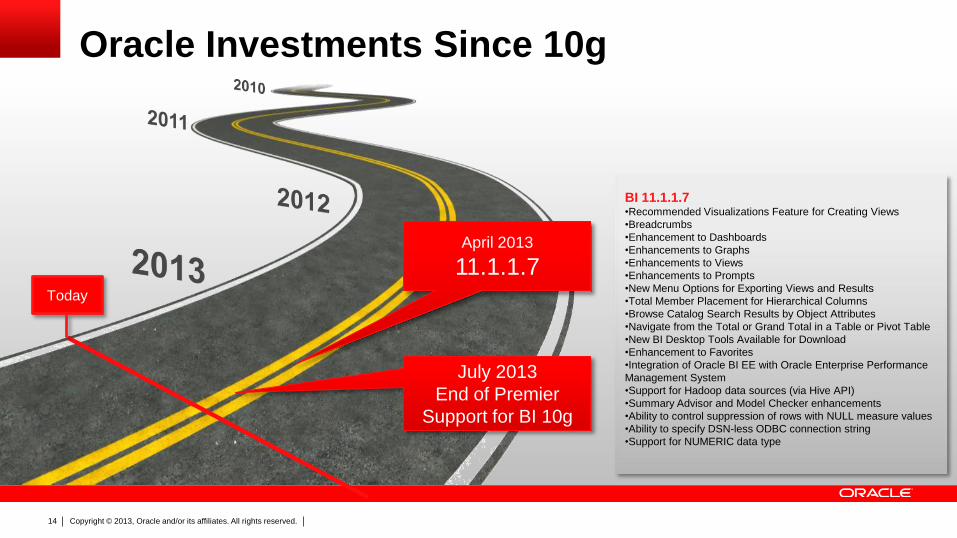
Oracle Investments Since 10g
April 2013
11.1.1.7
BI 11.1.1.7 •Recommended Visualizations Feature for Creating Views
•Breadcrumbs
•Enhancement to Dashboards
•Enhancements to Graphs
•Enhancements to Views
•Enhancements to Prompts
•New Menu Options for Exporting Views and Results
•Total Member Placement for Hierarchical Columns
•Browse Catalog Search Results by Object Attributes
•Navigate from the Total or Grand Total in a Table or Pivot Table
•New BI Desktop Tools Available for Download
•Enhancement to Favorites
•Integration of Oracle BI EE with Oracle Enterprise Performance
Management System
•Support for Hadoop data sources (via Hive API)
•Summary Advisor and Model Checker enhancements
•Ability to control suppression of rows with NULL measure values
•Ability to specify DSN-less ODBC connection string
•Support for NUMERIC data type
July 2013
End of Premier
Support for BI 10g
Today
Copyright © 2013, Oracle and/or its affiliates. All rights reserved. 15
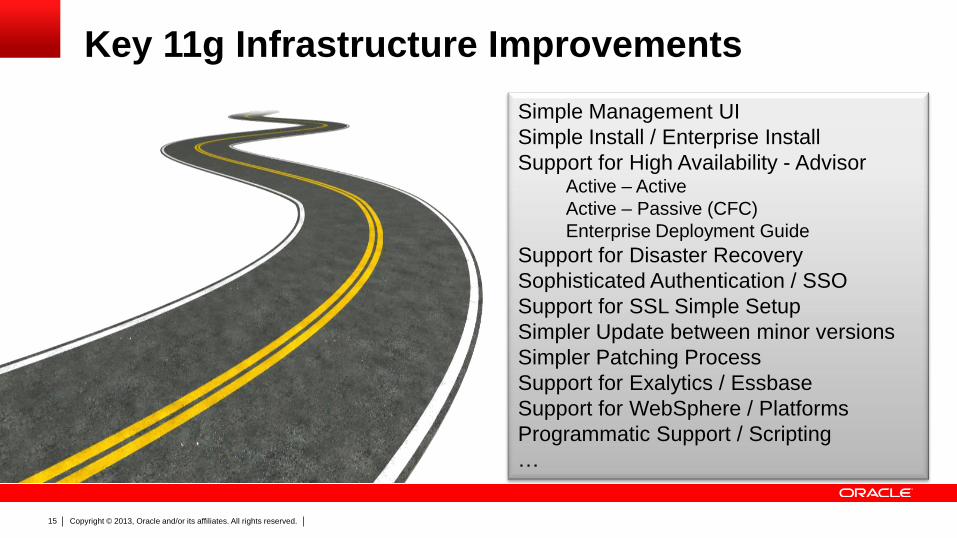
Key 11g Infrastructure Improvements
Simple Management UI
Simple Install / Enterprise Install
Support for High Availability - Advisor Active – Active
Active – Passive (CFC)
Enterprise Deployment Guide
Support for Disaster Recovery
Sophisticated Authentication / SSO
Support for SSL Simple Setup
Simpler Update between minor versions
Simpler Patching Process
Support for Exalytics / Essbase
Support for WebSphere / Platforms
Programmatic Support / Scripting
…
Copyright © 2013, Oracle and/or its affiliates. All rights reserved. 16
Top 10 Reasons to Get to 11g
10. What-if Analysis and Essbase Integration
9. Modern interactive visualizations
8. Scorecard
7. Smart View Office integration
6. Mobile BI
5. Access predictive analytics
4. Use latest OBI Apps
3. Exalytics In-Memory Machine
2. Path to the Cloud
1. Enterprise Management and lifecycle
Copyright © 2013, Oracle and/or its affiliates. All rights reserved. 17
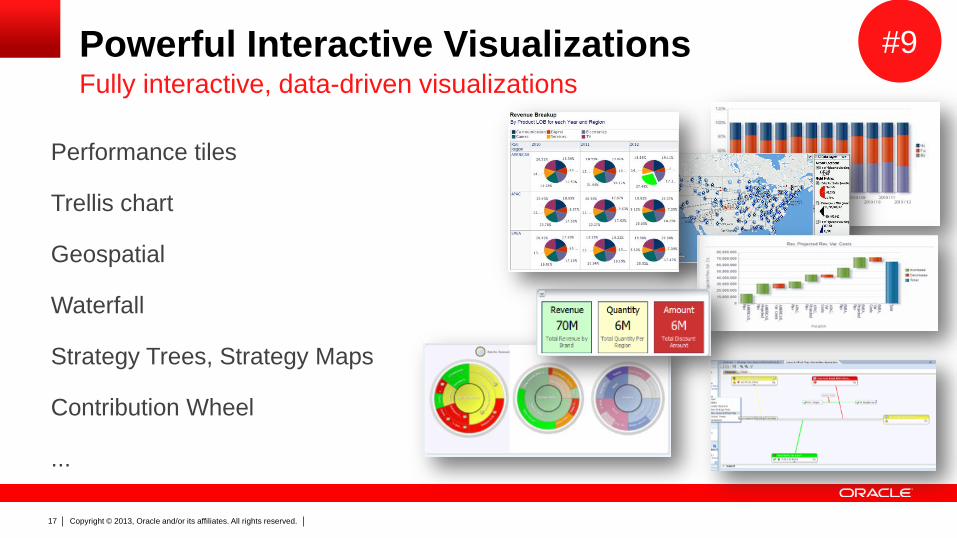
Powerful Interactive Visualizations Fully interactive, data-driven visualizations
Performance tiles
Trellis chart
Geospatial
Waterfall
Strategy Trees, Strategy Maps
Contribution Wheel
...
#9
Copyright © 2013, Oracle and/or its affiliates. All rights reserved. 18
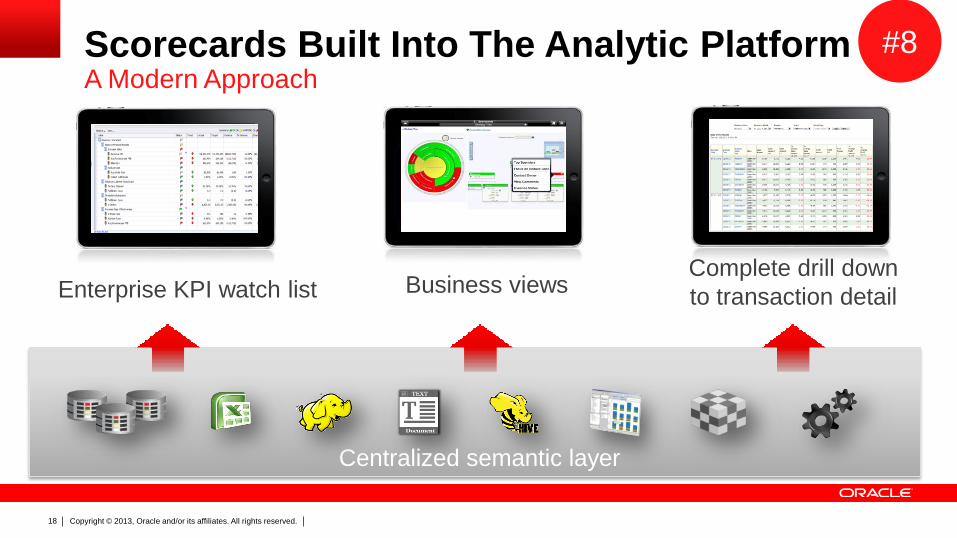
Business views
Scorecards Built Into The Analytic Platform A Modern Approach
Complete drill down
to transaction detail Enterprise KPI watch list
Centralized semantic layer
#8
Copyright © 2013, Oracle and/or its affiliates. All rights reserved. 19
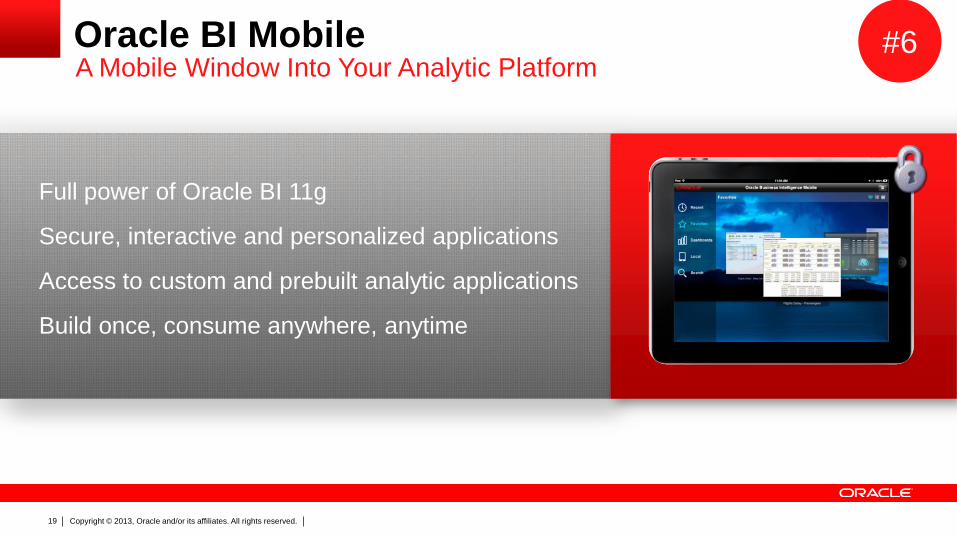
Full power of Oracle BI 11g
Secure, interactive and personalized applications
Access to custom and prebuilt analytic applications
Build once, consume anywhere, anytime
A Mobile Window Into Your Analytic Platform Oracle BI Mobile #6
Copyright © 2013, Oracle and/or its affiliates. All rights reserved. 20
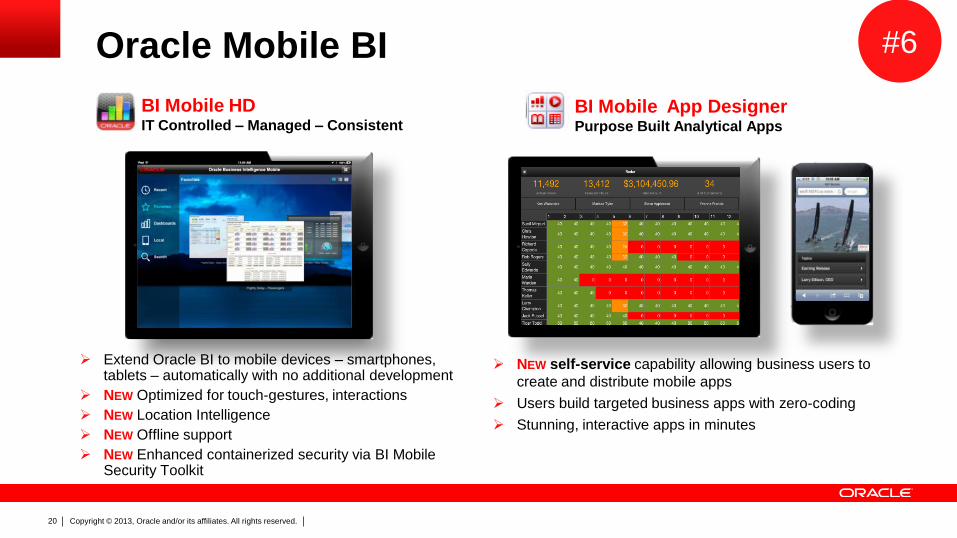
Oracle Mobile BI
Extend Oracle BI to mobile devices – smartphones, tablets – automatically with no additional development
NEW Optimized for touch-gestures, interactions
NEW Location Intelligence
NEW Offline support
NEW Enhanced containerized security via BI Mobile Security Toolkit
NEW self-service capability allowing business users to
create and distribute mobile apps
Users build targeted business apps with zero-coding
Stunning, interactive apps in minutes
BI Mobile HD IT Controlled – Managed – Consistent
BI Mobile App Designer Purpose Built Analytical Apps
#6
Copyright © 2013, Oracle and/or its affiliates. All rights reserved. 21
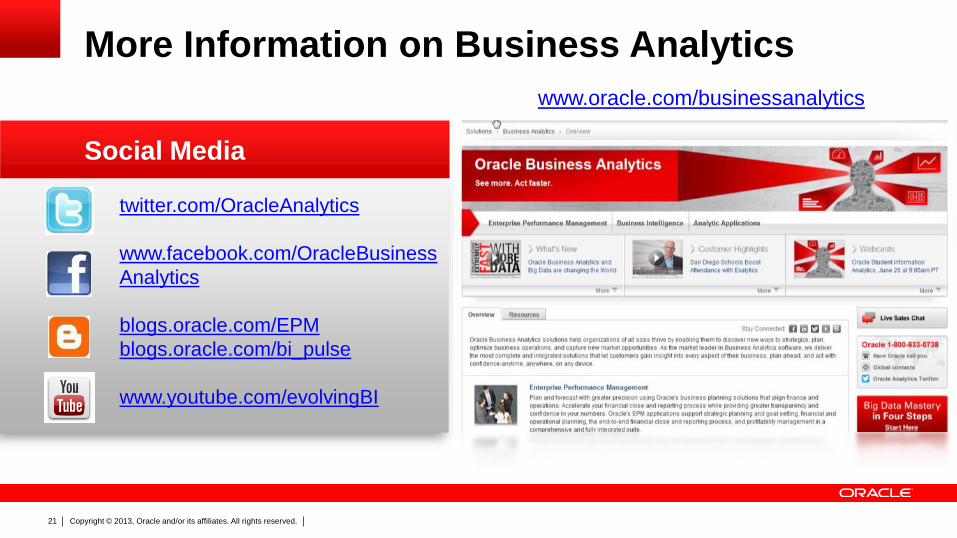
More Information on Business Analytics
Social Media
twitter.com/OracleAnalytics
www.facebook.com/OracleBusiness
Analytics
blogs.oracle.com/EPM
blogs.oracle.com/bi_pulse
www.youtube.com/evolvingBI
www.oracle.com/businessanalytics
Copyright © 2014, Oracle and/or its affiliates. All rights reserved. 23
Apps Associates
Leading Provider of Next Generation
Data Analytics Solutions
© Copyright 2014. Apps Associates LLC. 24
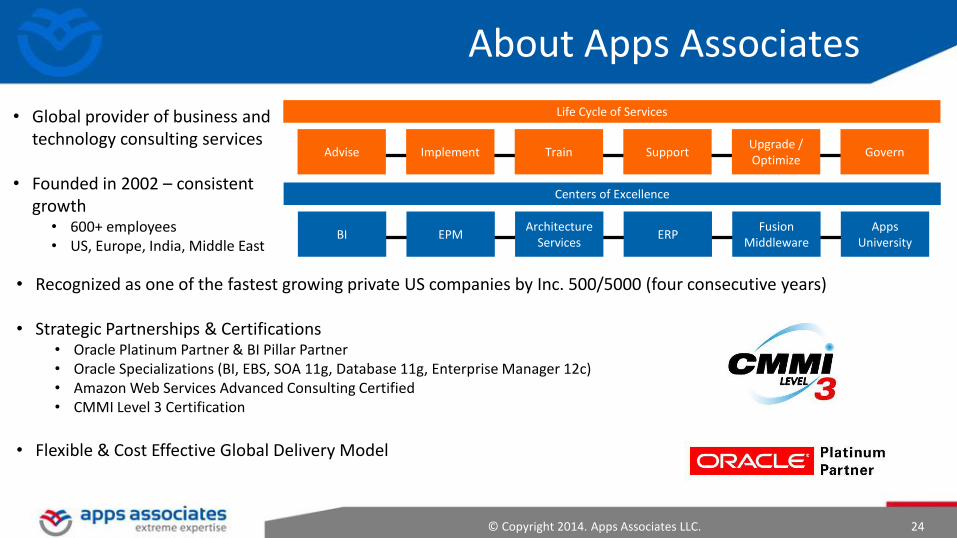
• Global provider of business and technology consulting services
• Founded in 2002 – consistent growth
• 600+ employees • US, Europe, India, Middle East
About Apps Associates
Life Cycle of Services
Advise Implement Train Support Upgrade / Optimize
Govern
Centers of Excellence
BI EPM Architecture
Services ERP
Fusion Middleware
Apps University
• Recognized as one of the fastest growing private US companies by Inc. 500/5000 (four consecutive years)
• Strategic Partnerships & Certifications • Oracle Platinum Partner & BI Pillar Partner • Oracle Specializations (BI, EBS, SOA 11g, Database 11g, Enterprise Manager 12c) • Amazon Web Services Advanced Consulting Certified • CMMI Level 3 Certification
• Flexible & Cost Effective Global Delivery Model

© Copyright 2014. Apps Associates LLC. 25
Power of Visualization
Country Billion Barrels
USA 30.9
Libya 46.4
Russia 77.4
Kazakhstan 39.8
Kuwait 101.5
Saudi Arabia 264.5
UAE 97.8
Nigeria 37.2
Iraq 115.0
Venezuela 211.2
Canada 32.1
© Copyright 2014. Apps Associates LLC. 26
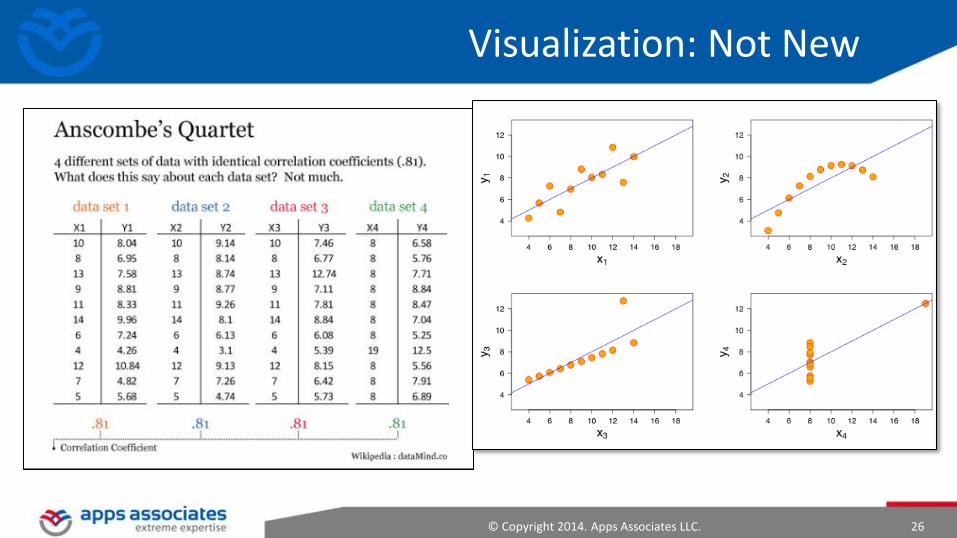
Visualization: Not New
© Copyright 2014. Apps Associates LLC. 27
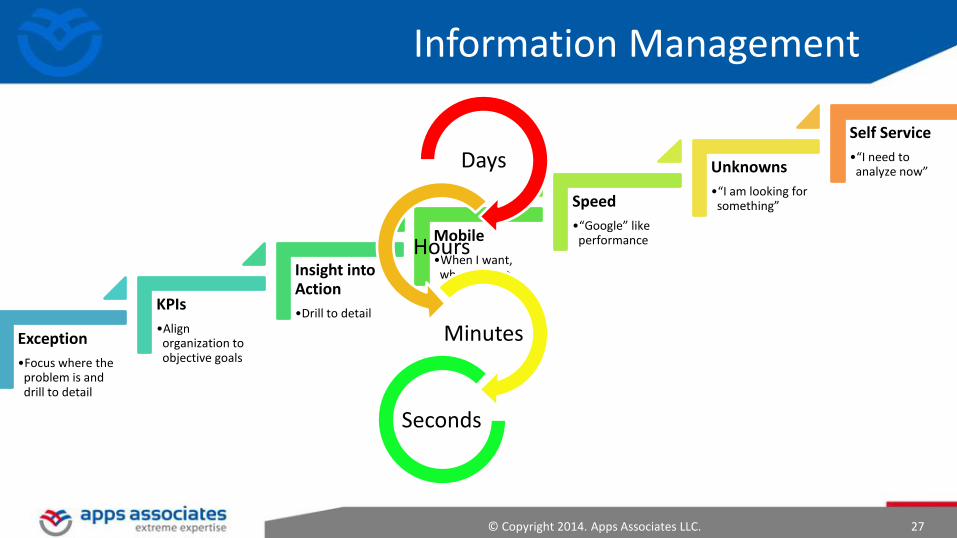
Exception
•Focus where the problem is and drill to detail
KPIs
•Align organization to objective goals
Insight into Action
•Drill to detail
Mobile
•When I want, where I want
Speed
•“Google” like performance
Unknowns
•“I am looking for something”
Self Service
•“I need to analyze now”
Days
Hours
Minutes
Seconds
Information Management
© Copyright 2014. Apps Associates LLC. 28
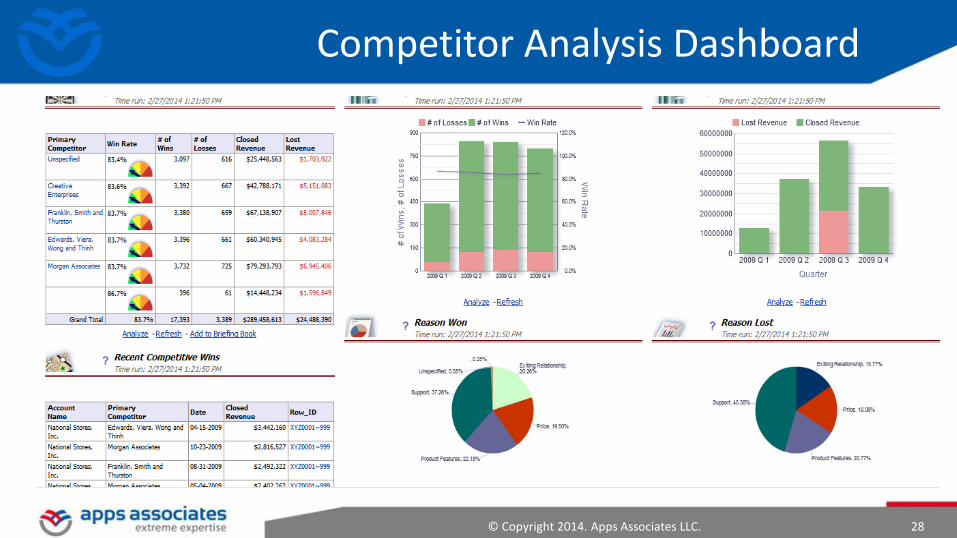
Competitor Analysis Dashboard
© Copyright 2014. Apps Associates LLC. 29
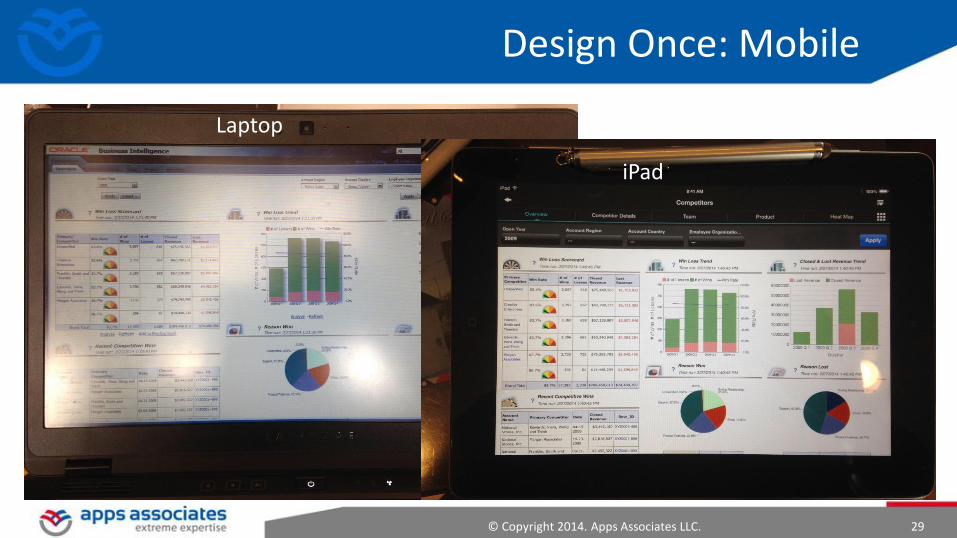
Laptop
iPad
Design Once: Mobile
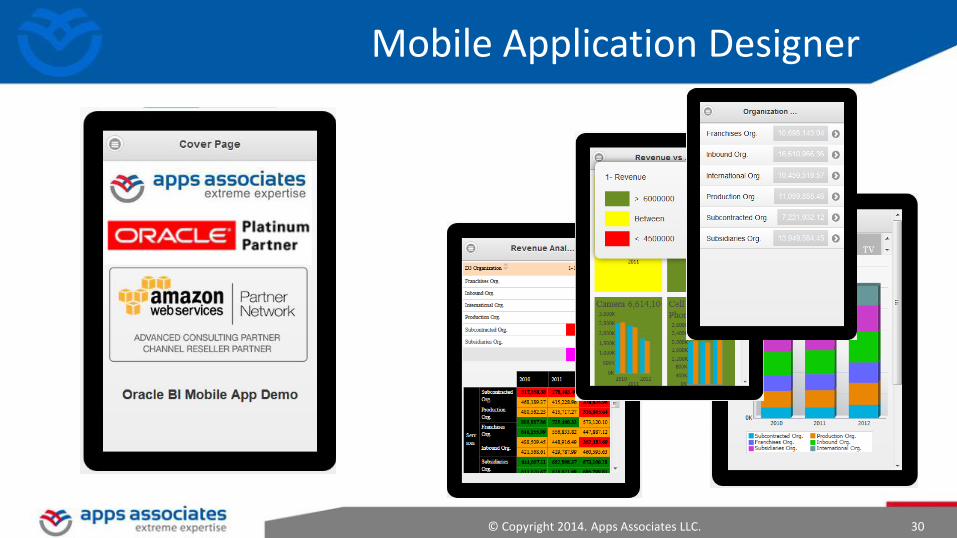
© Copyright 2014. Apps Associates LLC. 30
Mobile Application Designer
© Copyright 2014. Apps Associates LLC. 31
Separator title goes here
Advanced Visualization Use Cases
© Copyright 2014. Apps Associates LLC. 32
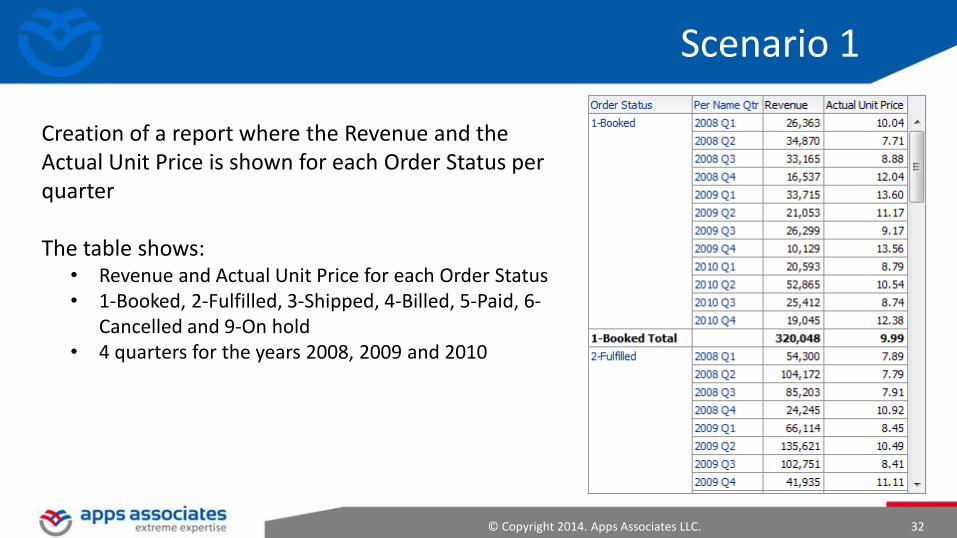
Creation of a report where the Revenue and the Actual Unit Price is shown for each Order Status per quarter The table shows:
• Revenue and Actual Unit Price for each Order Status • 1-Booked, 2-Fulfilled, 3-Shipped, 4-Billed, 5-Paid, 6-
Cancelled and 9-On hold • 4 quarters for the years 2008, 2009 and 2010
Scenario 1
© Copyright 2014. Apps Associates LLC. 33
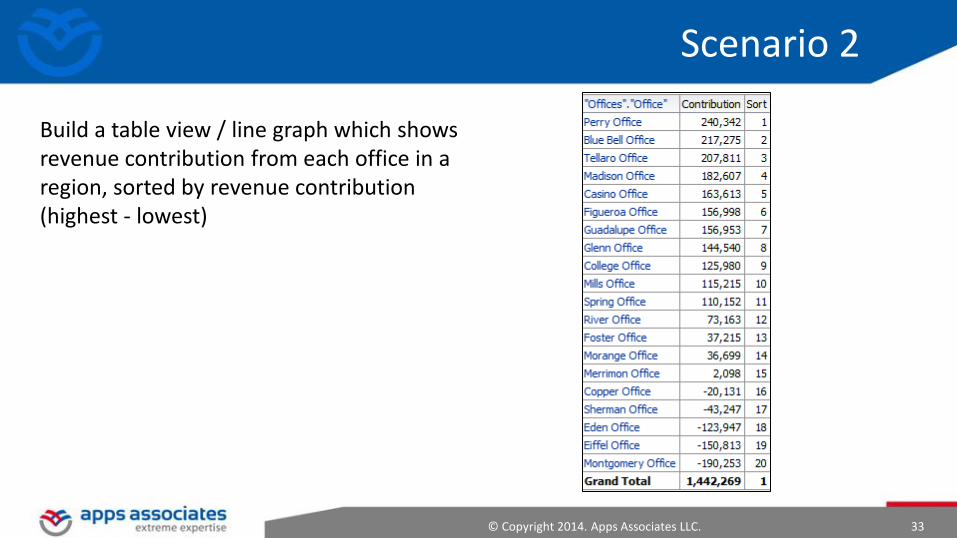
Build a table view / line graph which shows revenue contribution from each office in a region, sorted by revenue contribution (highest - lowest)
Scenario 2

© Copyright 2014. Apps Associates LLC. 34
Creation of a report where in the Revenue and the Target Revenue can be analyzed for the Line of Business per Year
Scenario 3
© Copyright 2014. Apps Associates LLC. 35
Mobile Visualization
© Copyright 2014. Apps Associates LLC. 36
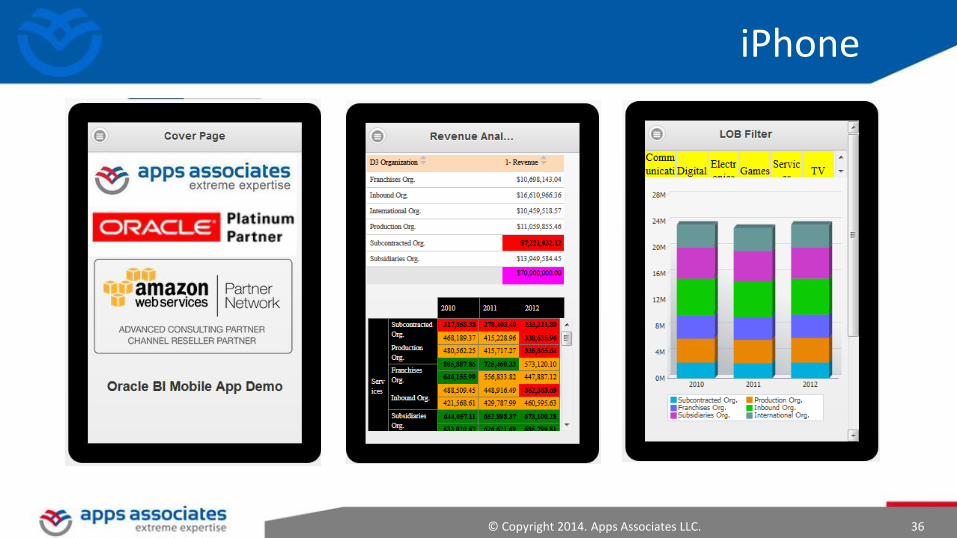
iPhone
© Copyright 2014. Apps Associates LLC. 37
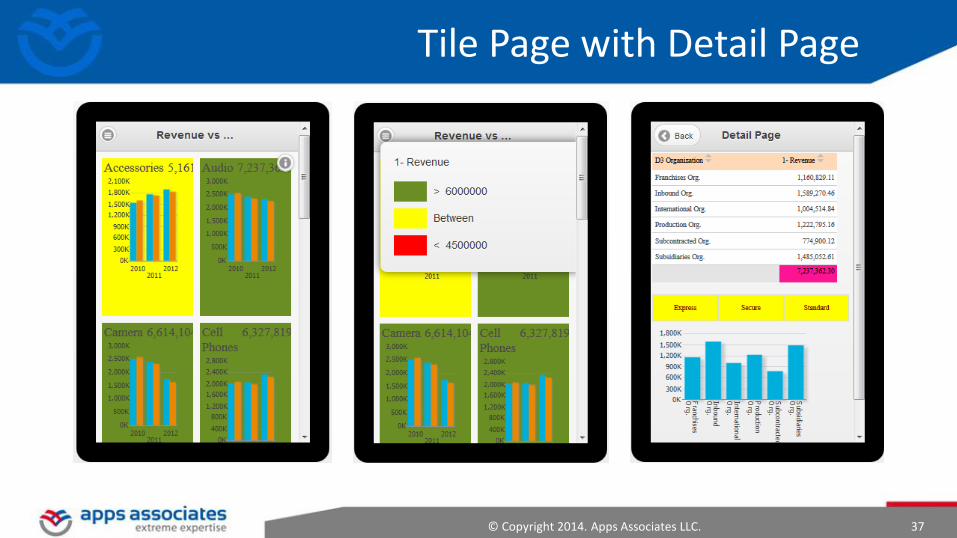
Tile Page with Detail Page
© Copyright 2014. Apps Associates LLC. 38
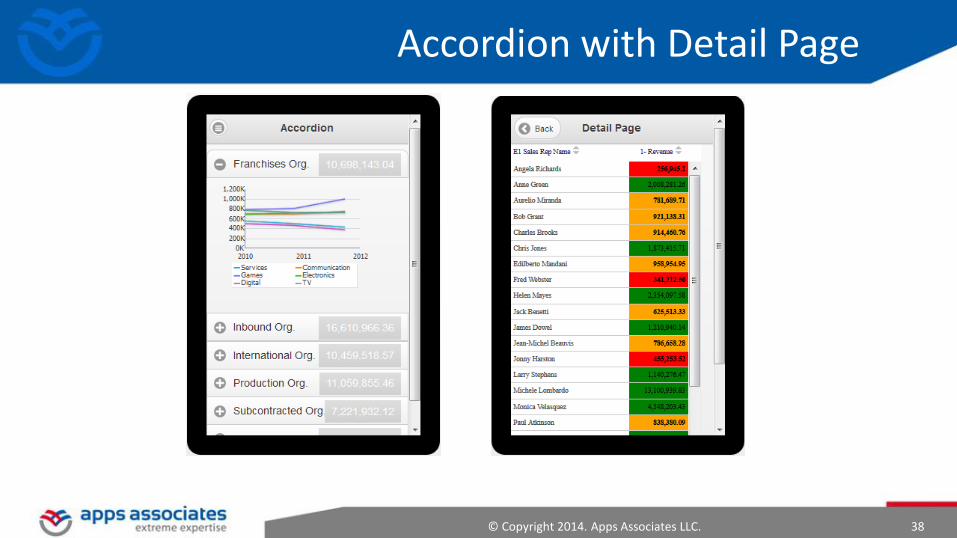
Accordion with Detail Page
© Copyright 2014. Apps Associates LLC. 39
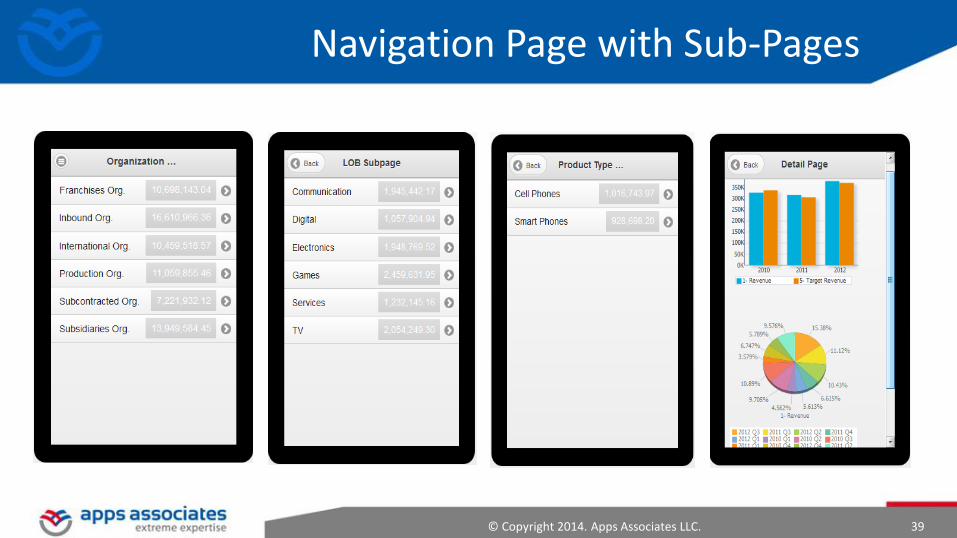
Navigation Page with Sub-Pages

© Copyright 2014. Apps Associates LLC. 40
iPad: Table and Pivot View

© Copyright 2014. Apps Associates LLC. 41
iPad: Tile Page with Detail Page
© Copyright 2014. Apps Associates LLC. 42
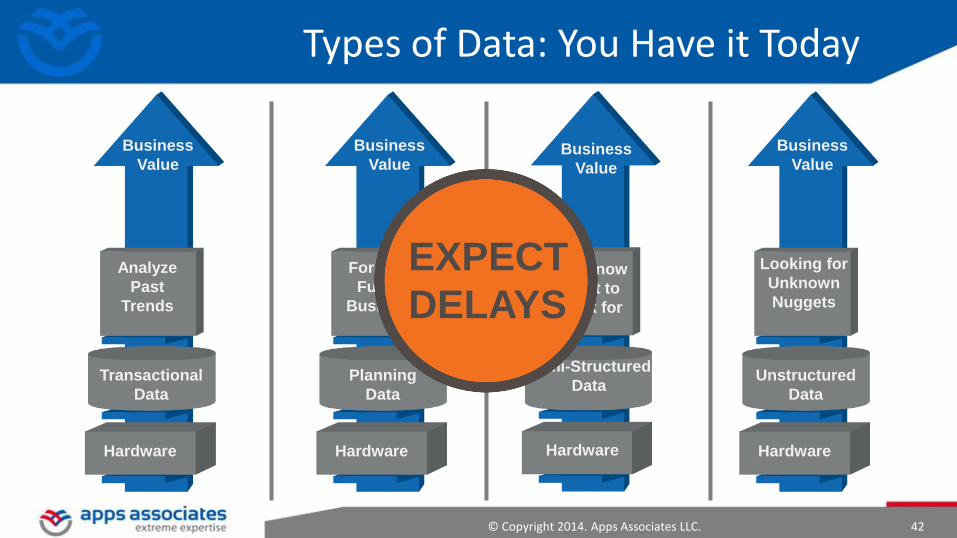
Looking for
Unknown
Nuggets
Unstructured
Data
Hardware
Business
Value
You know
What to
Look for
Semi-Structured
Data
Hardware
Business
Value
Forecast
Future
Business
Planning
Data
Hardware
Business
Value
Analyze
Past
Trends
Transactional
Data
Hardware
Business
Value
EXPECT
DELAYS
Types of Data: You Have it Today

© Copyright 2014. Apps Associates LLC. 43
Proactive – Monitor and Predict Problems Faster Root Cause Analysis Faster Remediation and Planning
Manage Customer Sentiment Increased Employee Satisfaction Up-Sell/Cross-Sell Opportunities
Consolidated Analysis
© Copyright 2014. Apps Associates LLC. 44
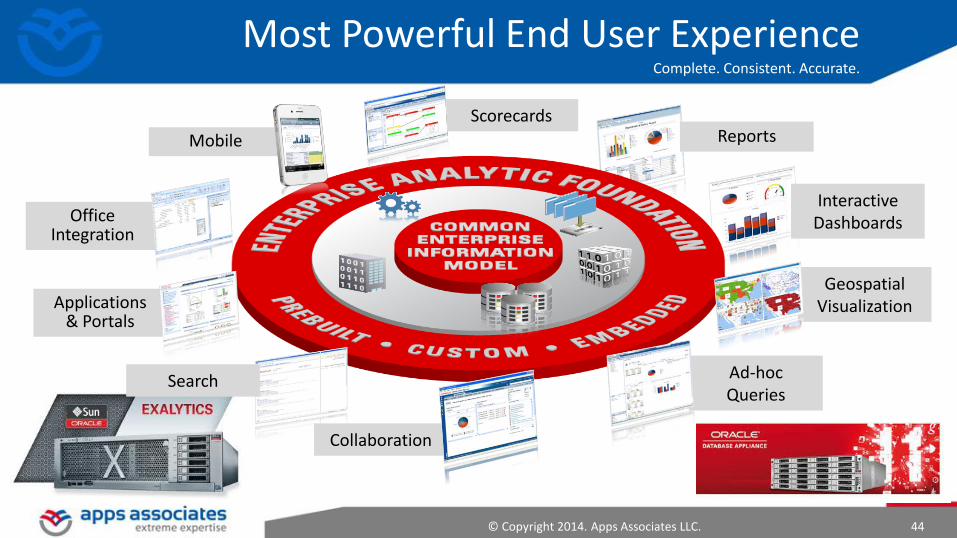
Interactive Dashboards
Geospatial Visualization
Office Integration
Mobile Reports
Applications & Portals
Ad-hoc Queries
Collaboration
Scorecards
Most Powerful End User Experience Complete. Consistent. Accurate.
Search
© Copyright 2014. Apps Associates LLC. 45
For more information, please visit www.appsassociates.com/business-intelligence-analytics.php
© Copyright 2014. Apps Associates LLC. 46
Connect with Us
Web: www.appsassociates.com
Email: [email protected] | [email protected]
YouTube: www.youtube.com/user/AppsAssociates
LinkedIn: www.us.linkedin.com/company/Apps-Associates
Twitter: @AppsAssociates
Facebook: www.facebook.com/AppsAssociatesGlobal
Google+: www.plus.google.com/+AppsAssociatesGlobal/
Thank You!