1 complexation and reduction/oxidation reactions of selected flavonoids with iron and iron...
TRANSCRIPT
1
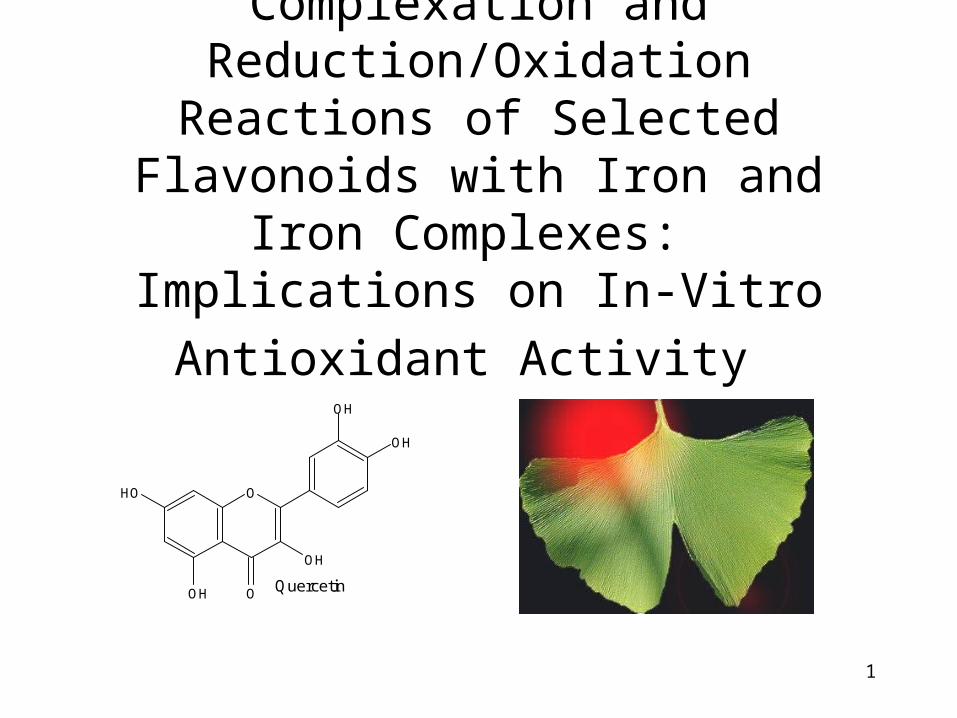
Complexation and Reduction/Oxidation Reactions of Selected Flavonoids with Iron and Iron Complexes: Implications
on In-Vitro Antioxidant Activity
O
O
OH
OH
OH
OH
OH
Quercetin
2
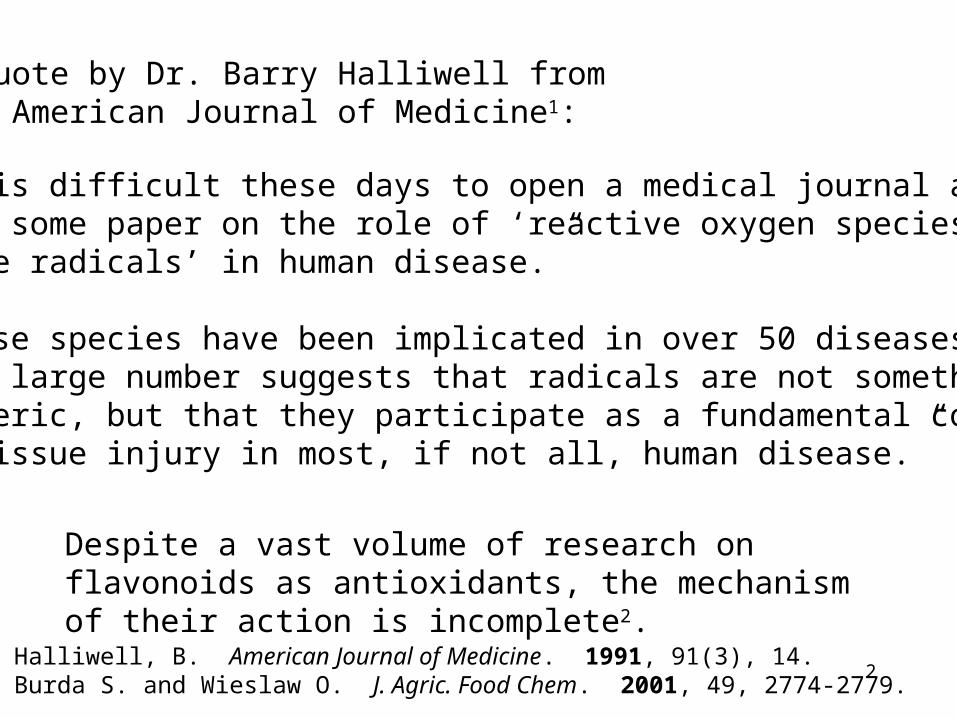
A quote by Dr. Barry Halliwell from the American Journal of Medicine1:
“It is difficult these days to open a medical journal and not find some paper on the role of ‘reactive oxygen species’ or‘free radicals’ in human disease.”
“These species have been implicated in over 50 diseases.This large number suggests that radicals are not somethingesoteric, but that they participate as a fundamental componentof tissue injury in most, if not all, human disease.”
1. Halliwell, B. American Journal of Medicine. 1991, 91(3), 14.2. Burda S. and Wieslaw O. J. Agric. Food Chem. 2001, 49, 2774-2779.
Despite a vast volume of research on flavonoids as antioxidants, the mechanism of their action is incomplete2.
3
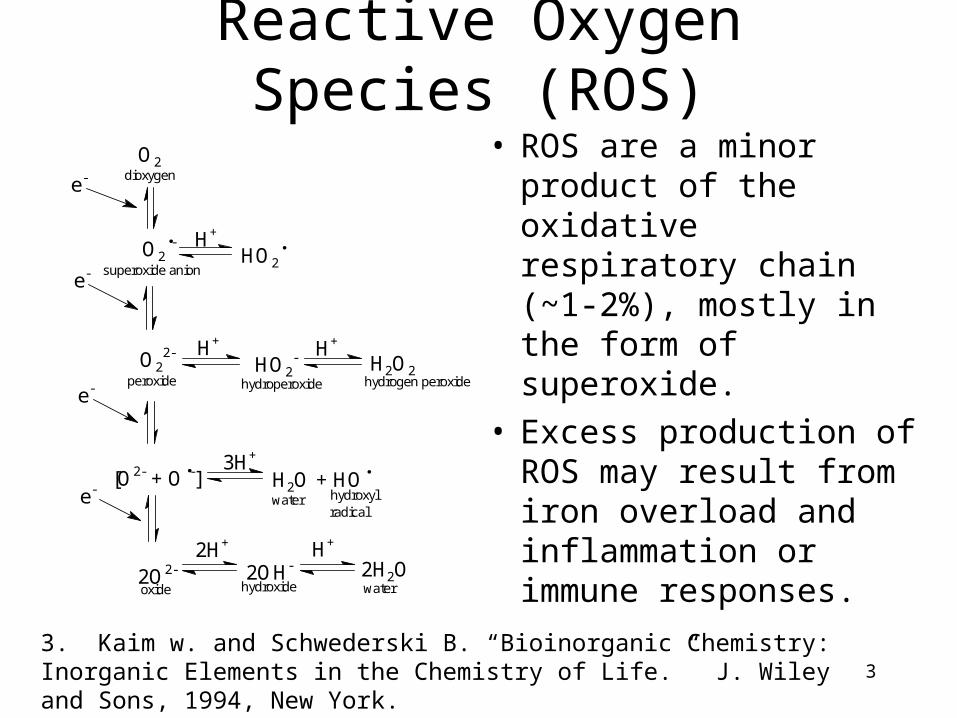
Reactive Oxygen Species (ROS)
• ROS are a minor product of the oxidative respiratory chain (~1-2%), mostly in the form of superoxide.
• Excess production of ROS may result from iron overload and inflammation or immune responses.
O2
2O2-
O2
.-
O22-
[O2- + O.-]
e-
e-
e-
e-
HO2
.H+
H+
3H+
2H+
HO2-
H2O + HO.
2OH-
H2O2
2H2O
H+
H+
dioxygen
oxide
peroxide
superoxide anion
hydroxide water
water hydroxyl
hydrogen peroxidehydroperoxide
radical
3. Kaim w. and Schwederski B. “Bioinorganic Chemistry: Inorganic Elements in the Chemistry of Life.” J. Wiley and Sons, 1994, New York.
4
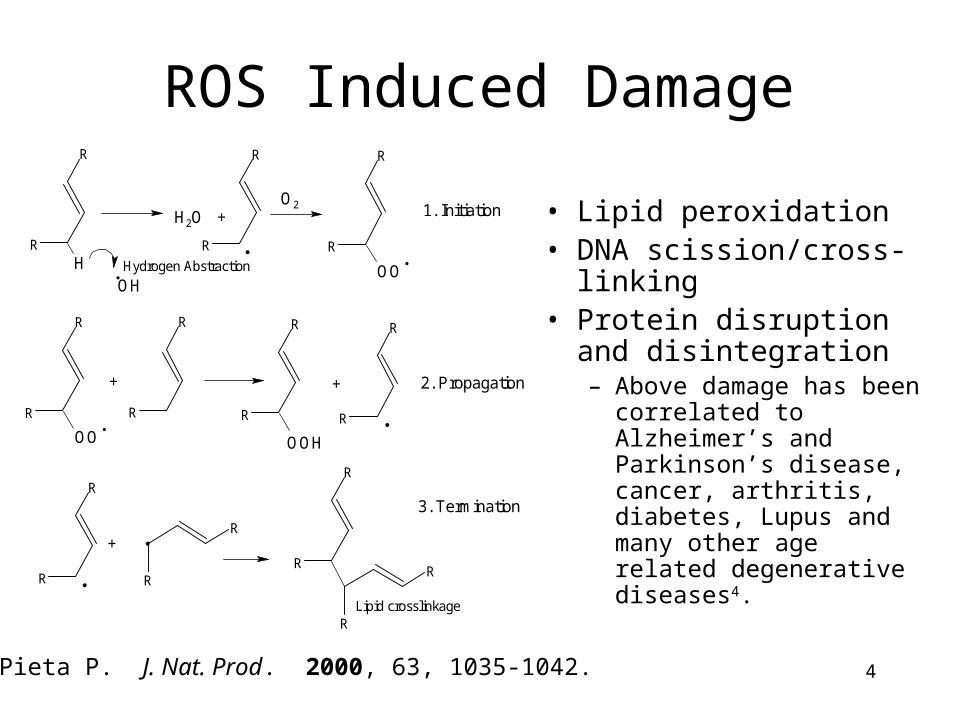
ROS Induced Damage
• Lipid peroxidation• DNA scission/cross-
linking• Protein disruption and
disintegration– Above damage has been
correlated to Alzheimer’s and Parkinson’s disease, cancer, arthritis, diabetes, Lupus and many other age related degenerative diseases4.
R
R
.OH
H
H2O +
R
R
.
R
R
O2
.R
R
OO.
R
R
OO.
R
R
+
R
R
OOH
+
R
R
. R
R.+R
R
R
R
1. Initiation
2. Propagation
3. Termination
Lipid crosslinkage
Hydrogen Abstraction
4. Pieta P. J. Nat. Prod. 2000, 63, 1035-1042.

5
Natural ROS Defenses
2O2
.- + 2H+ H2O2 + O2
SOD
2H2O2 2H2O + O2
catalase
2GSH + R-OOH
glutathioneperoxidase
GSSG + R-OH + H2O

6
Hydroxyl Radical and The Fenton Reaction
• H2O2 + e- HO• + HO- E°’ = 0.30 V, S.H.E., pH 7.0
• Fe(II) Fe(III) + e- E°’ = depends on complex
• Fe(II) + H2O2 Fe(III) + HO• + HO-
– The impact of Ferrous salts on H2O2 reduction was discovered over 100 years ago.5
– The Fenton reaction in form above, including the hydroxyl radical, was suggested over 75 years ago.6
5. H.J.H. Fenton. J. Chem. Soc. 1894, 65, 889.6. F. Haber and J.J. Weiss. Proc. Roy. Soc. London, Ser. A. 1934, 147, 332.

7
Peroxy-FeEDTA and the Fenton Reaction
[FeIIIEDTA-O2H]2- + e- [FeIIEDTA-O2H]3-
[FeIIEDTA-O2H]3- + H+ [FeIIIEDTA]- + HO. + HO-
8
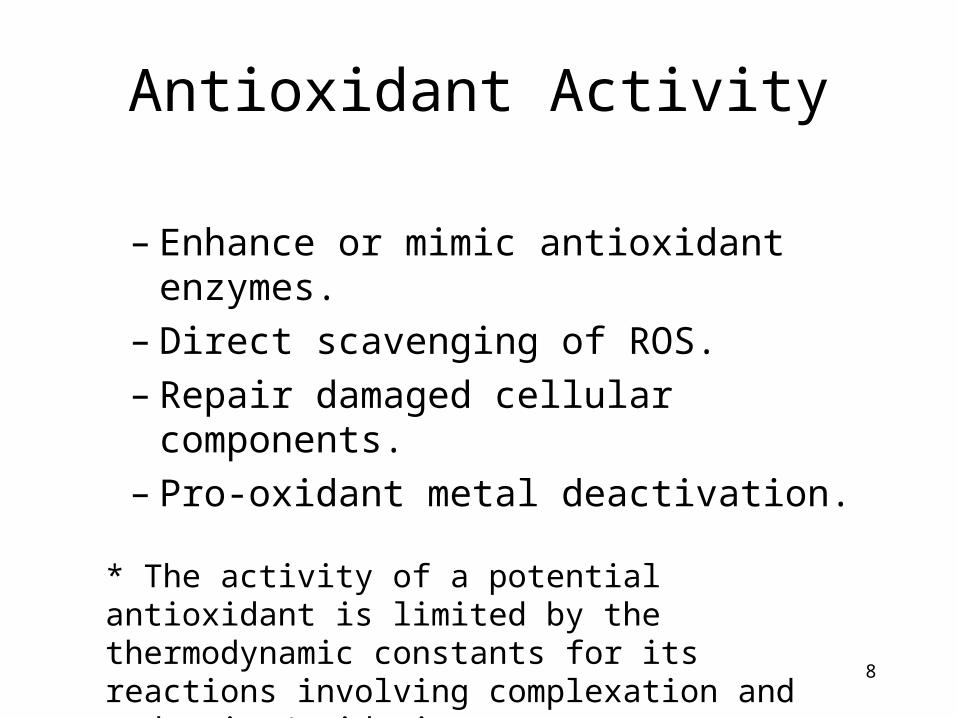
Antioxidant Activity
– Enhance or mimic antioxidant enzymes.– Direct scavenging of ROS.– Repair damaged cellular components.– Pro-oxidant metal deactivation.
* The activity of a potential antioxidant is limited by the thermodynamic constants for its reactions involving complexation and reduction/oxidation.

9
Fenton Metal Deactivation
FeIIATP+ H2O2 FeIIIATP + HO. + HO
-
ATP
FeIIL + H2O2
(antioxidant)+L
+L
(pro-oxidant ligand
[FeII(ATP)L] + H2O2
displacement) No Reaction
No Reaction
7. F. Cheng and K. Breen. Biometals. 2000, 13, 77-83.
Quercetin deactivates the Fe-ATP complex7, although the precise mechanism is still unclear. The use of a strong chelate, like EDTA, should provide additional insight.

10
Flavonoid Structure
O
A
B
C
1
2
3
45
6
7
8 1'
2'
3'
4'
5'
6'
O
OH
A
B
C
1
2
5
6
7
8 1'
2'
3'
4'
5'
6'
O
O
A
B
C
1
2
3
5
6
7
8 1'
2'
3'
4'
5'
6'
O
O
A
B
C
1
2
5
6
7
8 1'
2'
3'
4'
5'
6'
O
O
OH
A
B
C
1
2
5
6
7
8 1'
2'
3'
4'
5'
6'
4
3
Base Structure
Flavanonol
Flavone
Flavanone
Flavonol
A
B
C
1
2
5
6
7
8
1'
2'
3'
4'
5'
6'
O
O
Isoflavone
O
O
OH
OH
OH
OH
OH
O
O
OH
OH
OH
OH
OH
O
O
OH
OH
OH
OH
O
O
OH
OH
OH
OH
OH
OH
Quercetin Taxifolin
Kaempferol Myricetin
O
O
OH
OH
OH
O
O
OH
OH
O
O
OH
OH
OH
OH
OH
O
O
OH
OH
OH
Baicalein Chrysin
Morin Galangin
11
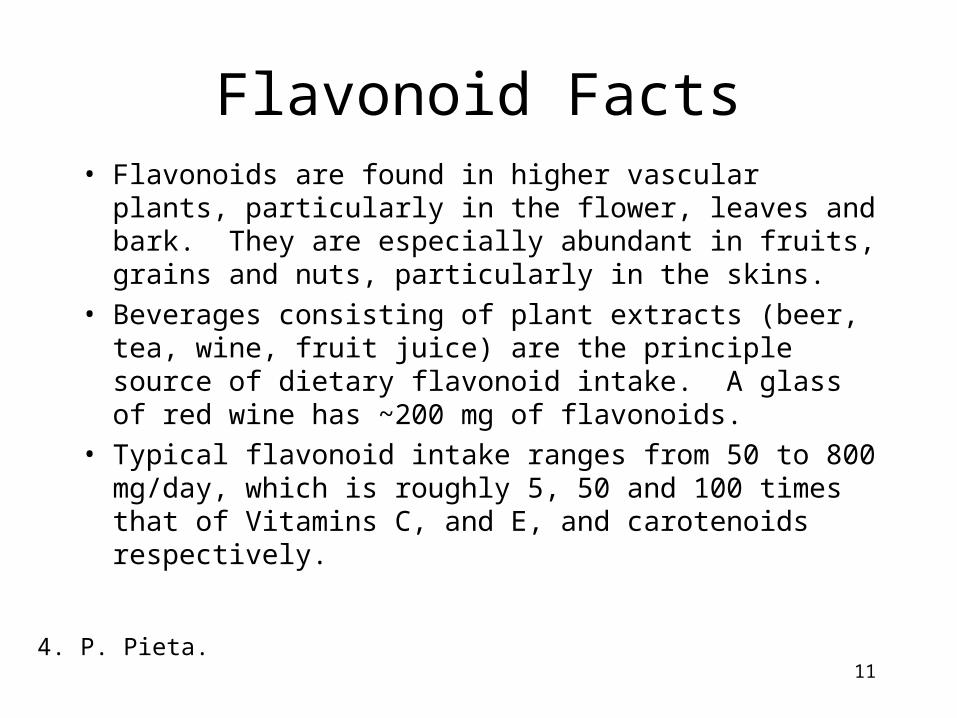
Flavonoid Facts• Flavonoids are found in higher vascular plants, particularly
in the flower, leaves and bark. They are especially abundant in fruits, grains and nuts, particularly in the skins.
• Beverages consisting of plant extracts (beer, tea, wine, fruit juice) are the principle source of dietary flavonoid intake. A glass of red wine has ~200 mg of flavonoids.
• Typical flavonoid intake ranges from 50 to 800 mg/day, which is roughly 5, 50 and 100 times that of Vitamins C, and E, and carotenoids respectively.
4. P. Pieta.

12
Experimental Design
• Observe Metal-Flavonoid binding interactions via shifts in the visible spectrum of the flavonoid when in the presence of the metal.
• Investigate the electrochemical behavior of the FeEDTA, and peroxy-FeEDTA complexes for the purpose of assaying flavonoid antioxidant activity and elucidating flavonoid antioxidant mechanisms.
• Measure the proton, metal and mixed-ligand binding constants for the flavonoids using potentiometry.
• Correlate constants and observations to published antioxidant efficiency data for structure activity relationships and mechanism elucidation.

13
UV-visible Spectrophotometry
• HP 8453 UV-vis diode array. 25 M Metal, 25-75 M flavonoid, unbuffered and at pH 7.4 with 10 mM HEPES, 60/40 vol% water/dioxane.
• Flavonoid-metal interaction is easily observed via shifts in the visible spectrum.
Wavelength (nm)200 250 300 350 400 450 500 550
Abso
rban
ce (A
U)
0
0.5
1
1.5
2
2.5
3
3.5
Wavelength (nm)200 250 300 350 400 450
Abso
rban
ce (A
U)
0
0.5
1
1.5
2
2.5
FeII, Quercetin
Ca, Naringenin
1:3 (M:L)
1:10:1
1:3
1:1 (dashed), 0:1 (solid)

14
FeII FeIII CuII CaII ZnII
Quercetin + + + - + 7.4
Galangin + + + - + 7.4
Fisetin + + + - + 7.4
Chrysin - - - - -
Naringenin - - - - -
Iron is the most abundant physiological transition metal; copper is second. Ca is the fifth most abundant element (by mass, behind O, C, H, and N) in the human body at ~ 1 kilogram present. Both Ca and Zn are commonly implicated in pro- and anti- oxidant processes.
15
O
O
OH
OH
OH
OH
OH
QuercetinO
O
OH
OH
OH
Naringenin
O
O
OH
OHChrysin
O
O
OH
OH
OHOH
Fisetin
O
O
OH
OH
OH Galangin
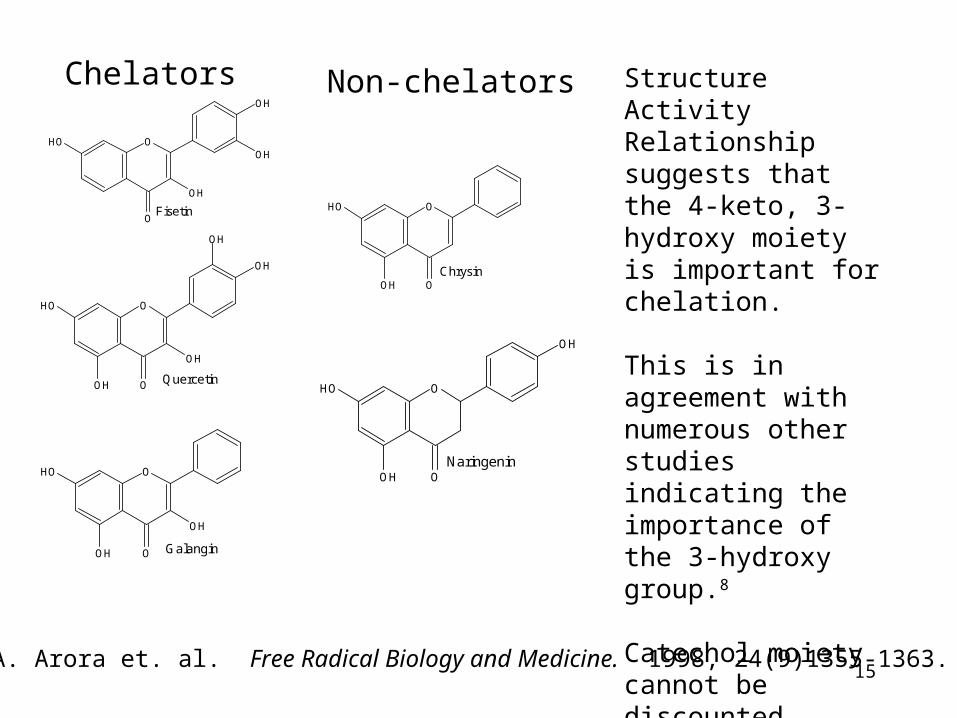
Chelators Non-chelators Structure Activity Relationship suggests that the 4-keto, 3-hydroxy moiety is important for chelation.
This is in agreement with numerous other studies indicating the importance of the 3-hydroxy group.8
Catechol moiety cannot be discounted without testing a flavonoid that lacks the 3-hydroxy group.
8. A. Arora et. al. Free Radical Biology and Medicine. 1998, 24(9)1355-1363.

16
Voltammetry
FeIIIEDTA
-1
-0.5
0
0.5
1
-0.6-0.300.30.6
potential (V)
cu
rre
nt
(A
)
FeIIIEDTA + e- FeIIEDTA
FeIIIEDTA + e- FeIIEDTA
Conditions:-0.20 mM Fe(NO3)3
-0.10 M NaNO3
-20 mM HEPES pH 7.4-25 mV/s, carbon disk-Ag/AgCl reference-Pt wire counter electrode
Gamry PC4 Potentiostatwith CMS100 frameworkand CMS130 voltammetrysoftware
Fe
N
O
N
OO
O
O
O
O
O
17
Why EDTA?
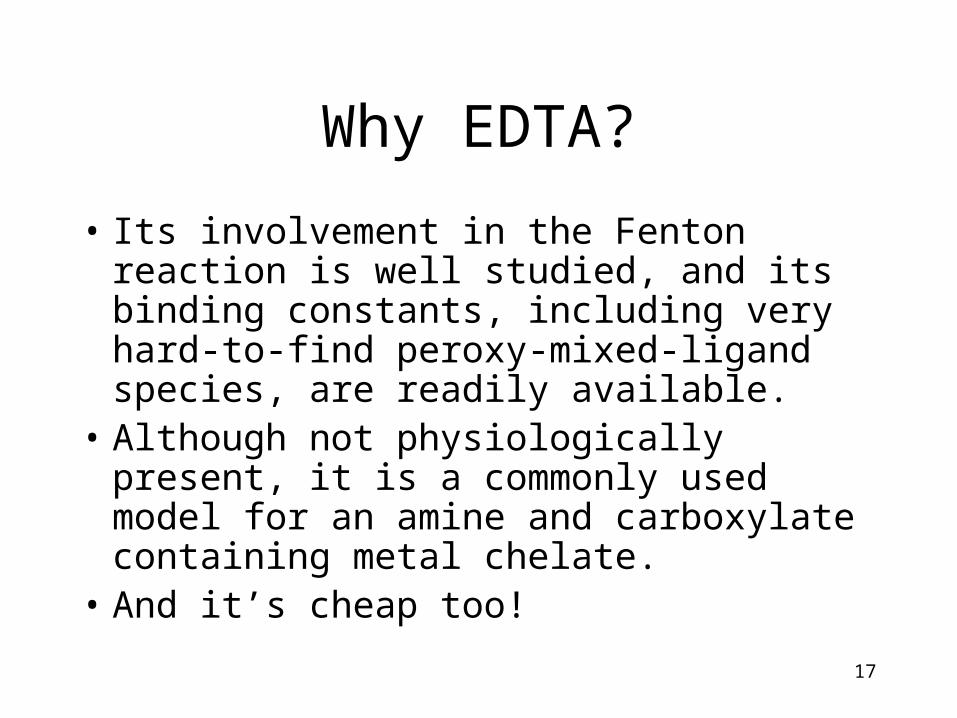
• Its involvement in the Fenton reaction is well studied, and its binding constants, including very hard-to-find peroxy-mixed-ligand species, are readily available.
• Although not physiologically present, it is a commonly used model for an amine and carboxylate containing metal chelate.
• And it’s cheap too!

18
Fe(III)EDTA
0 4 8 12pH
0
20
40
60
80
100%
form
atio
n re
lativ
e to
Fe
FeHEDTA
FeEDTAHO-FeEDTA
(HO)2-FeEDTA
Hyperquad Speciation and Simulation software (HySS) by Peter Gans Formation Constants obtained from Robert M. Smith and Arthur E. Martell
-0.1 mM FeII/III
-0.1 mM EDTAFe(II)EDTA
0 4 8 12pH
0
20
40
60
80
100
% fo
rmat
ion
rela
tive
to F
e
Fe
FeHEDTA
FeEDTA
HO-FeEDTA
(HO)2-FeEDTA

19
0.20 mM Fe(III)EDTA (1:1) unbuffered
-2
0
2
4
6
8
10
-1.2-0.7-0.20.3
potential (V)
cu
rre
nt
(A
)
pH = 4.1
pH = 6.1
pH = 7.2
pH = 7.7
pH = 8.2
pH = 9.1
pH = 9.6
pH = 10.1

20
Nernst Equation
E = E0 - 0.059 x log[FeIIEDTA][OH-]
[FeIIIEDTA-OH]
E = 0.059(log[OH-]) + E0 - log [FeIIEDTA]
[FeIIIEDTA-OH]

21
FeEDTA E1/2 pH Dependence
y = -0.0849x + 0.5574
R2 = 0.986-0.35
-0.3
-0.25
-0.2
-0.15
-0.1
-0.05
0
0 5 10 15
pH
E1
/2 (
V v
s A
g/A
gC
l)
FeEDTA
FeEDTA-OH/FeEDTA-(OH)2
Linear (FeEDTA-OH/FeEDTA-(OH)2)

22
-1
0
1
2
3
4
5
6
-0.5-0.3-0.10.10.30.5
voltage (V)
curr
en
t (
A, r
ela
tive
)
H2O2 + e- HO. + HO-
FeIIIEDTA + e- FeIIEDTA
FeIIIEDTA + HO. + HO-FeIIEDTA + H2O2
Conditions:-0.20 mM FeEDTA-0.10 M NaNO3
-20 mM HEPES, 7.4-9.5 mM H2O2
-25 mV/s, C disk-Ag/AgCl reference-Pt wire counter electrode
The electrocatalytic current (EC’) is highly dependant on pH, [H2O2] and [EDTA].

23
-20
0
20
40
60
80
100
120
140
-1.2-0.8-0.400.40.8
potential (V)
cu
rre
nt
(A
)
1:1:540
1:1:140
1:1:40
1:1:10
Conditions:-0.10 mM Fe(NO3)3
-0.10 mM EDTA-1.0-54 mM H2O2
-0.10 M NaNO3
-20 mM HEPES pH 7.4-25 mV/s, carbon disk-Ag/AgCl reference-Pt counter electrode
-ratios are labeled according to Fe:EDTA:H2O2
EC' Current Dependence on relative [H2O2]
0
20
40
60
80
100
120
140
0 100 200 300 400 500 600
[H2O2] excess, relative to FeEDTA
cu
rre
nt
(A
)
1:1:10

24
4 6 8 10pH
0
20
40
60
80
100
% fo
rmat
ion
rela
tive
to F
e
HOO-FeEDTA
FeEDTA
HO-FeEDTA
pH 7.4
Conditions:-0.10 mM FeEDTA (1:1)-4.0 mM H2O2 (top), 14 mM H2O2 (bottom).
4 6 8 10pH
0
20
40
60
80
100
% fo
rmat
ion
rela
tive
to F
e HOO-FeEDTAFeEDTA
HO-FeEDTA
pH 7.4
FeIIIEDTA, H2O2 Speciation

25
-5
0
5
10
15
20
-1.2-0.8-0.400.40.8
potential (V)
curr
ent (
A)
1:10:540
1:10:140
1:10:40
1:10:10
Conditions:-0.10 mM Fe(NO3)3
-1.0 mM Na2EDTA-0.10 M NaNO3
-1.0-54 mM H2O2
-20 mM HEPES pH 7.4-25 mV/s, carbon disk-Ag/AgCl reference-Pt counter electrode
-ratios are labeled according to Fe:EDTA:H2O2
EC' Current Dependence on relative [H2O2]
02468
1012141618
0 100 200 300 400 500 600
[H2O2] excess, relative to 1:10 FeEDTA
cu
rre
nt
(A
)
26
-2
-1
0
1
2
3
4
5
6
7
8
-1.2-0.8-0.400.40.8
potential (V)
cu
rre
nt
(A
)
1:1:40
1:10:40
1:1:10
1:10:10
Conditions:-0.10 mM Fe(NO3)3
-0.10/1.0 mM EDTA-1.0/4.0 mM H2O2
-0.10 M NaNO3
-20 mM HEPES pH 7.4-25 mV/s, carbon disk-Ag/AgCl reference-Pt counter electrode
-ratios are labeled according to Fe:EDTA:H2O2
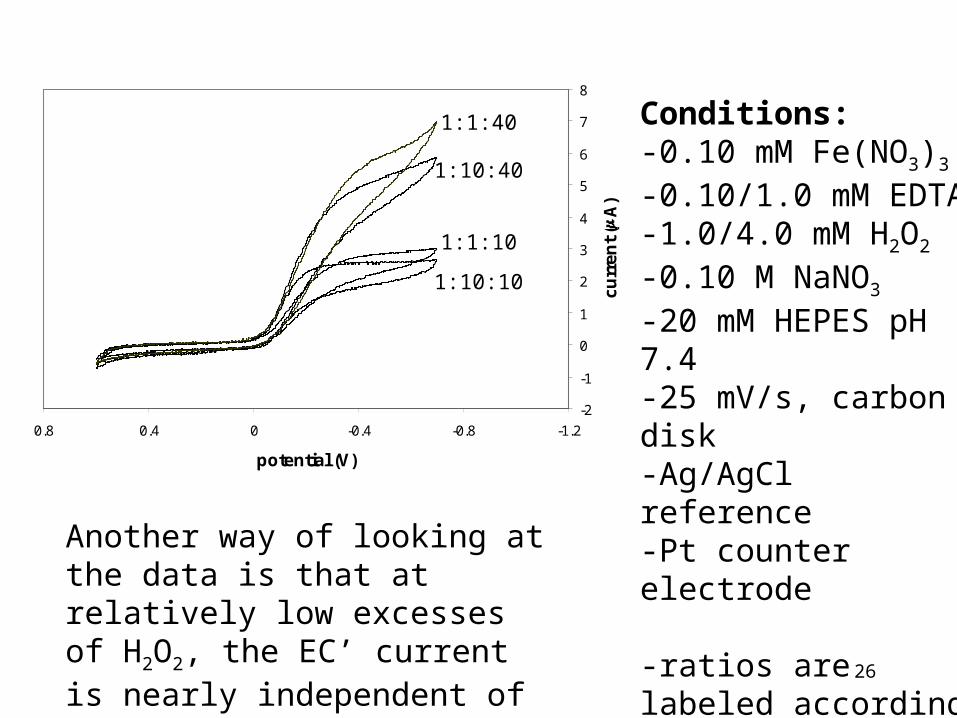
Another way of looking at the data is that at relatively low excesses of H2O2, the EC’ current is nearly independent of the Fe:EDTA ratio.
27
-20
0
20
40
60
80
100
120
140
-1.2-0.8-0.400.40.8
potential (V)
cu
rre
nt
(A
)
1:1:540
1:1:140
1:10:140
1:10:540
Conditions:-0.10 mM Fe(NO3)3
-0.10/1.0 mM EDTA-1.0-54 mM H2O2
-0.10 M NaNO3
-20 mM HEPES pH 7.4-25 mV/s, carbon disk-Ag/AgCl reference-Pt counter electrode
-ratios are labeled according to Fe:EDTA:H2O2
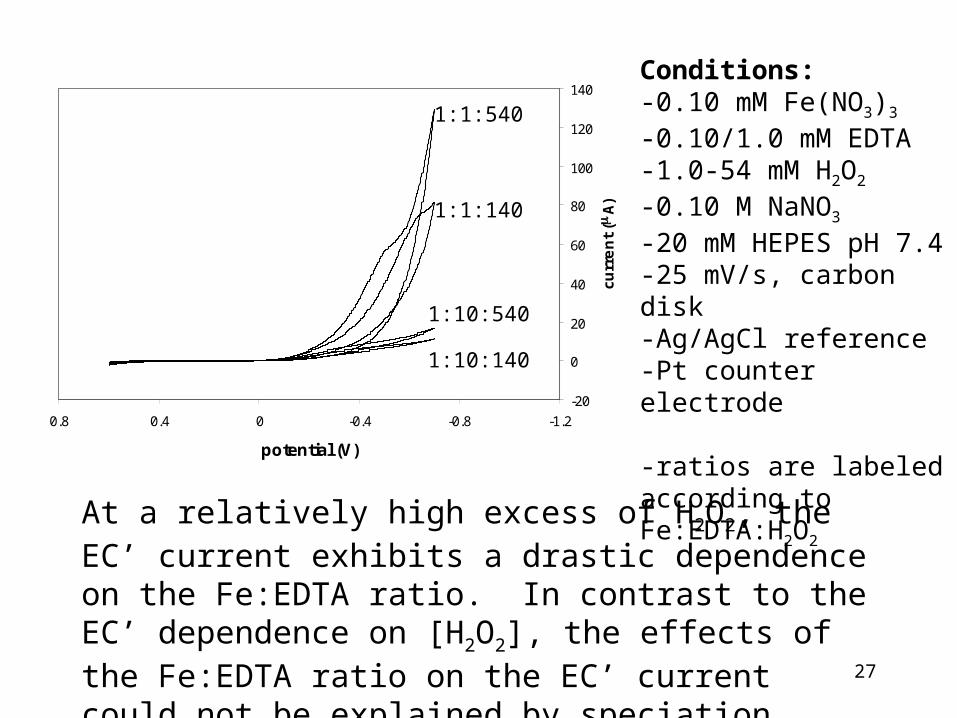
At a relatively high excess of H2O2, the EC’ current exhibits a drastic dependence on the Fe:EDTA ratio. In contrast to the EC’ dependence on [H2O2], the effects of the Fe:EDTA ratio on the EC’ current could not be explained by speciation calculations. Kinetic factors may be important.

28
FeEDTA, Quercetin Composite
-1
0
1
2
3
4
5
6
-0.8-0.400.40.8
potential (V, absolute)
cu
rre
nt
(A
, re
lati
ve
)
0.20 mMFe(III)EDTA (1:1)
0.20 mM quercetin
sum composite0.20 mMFe(III)EDTA-quercetin (1:1:1)
experimental 0.20mM Fe(III)EDTA-quercetin (1:1:1)
29
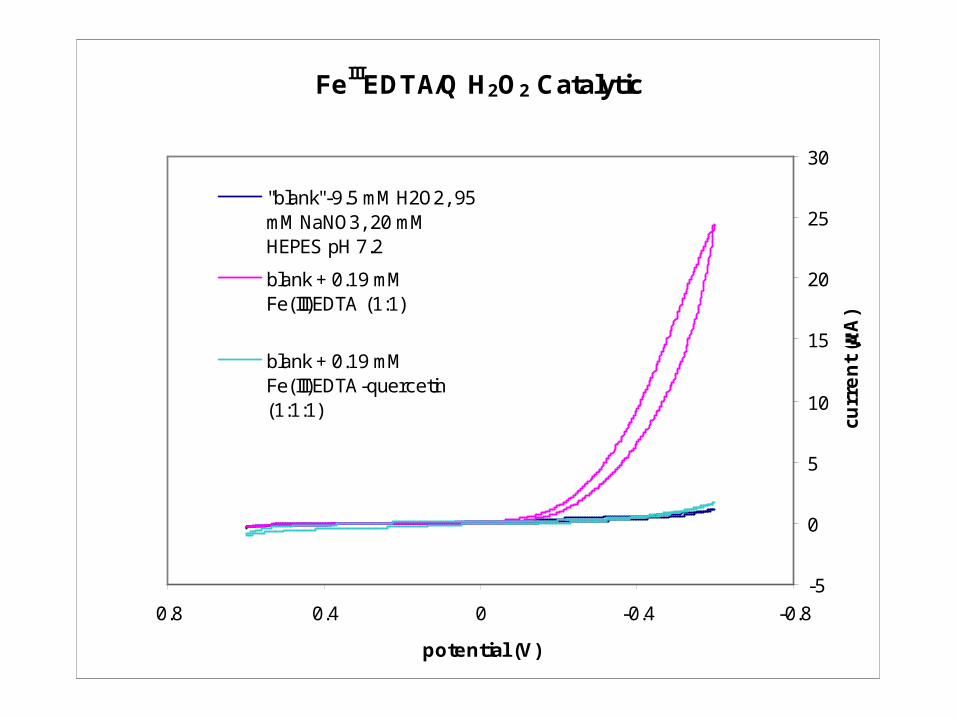
FeIIIEDTA/Q H2O2 Catalytic
-5
0
5
10
15
20
25
30
-0.8-0.400.40.8
potential (V)
curr
en
t (
A)
"blank"-9.5 mM H2O2, 95mM NaNO3, 20 mMHEPES pH 7.2
blank + 0.19 mMFe(III)EDTA (1:1)
blank + 0.19 mMFe(III)EDTA-quercetin(1:1:1)
30
Quercetin shifts the formal reduction potential, but what about the speciation of the peroxy-FeEDTA complex?

31
Formation Constant Refinement• Collect the experimental titration curve.• Simulate a titration curve using the same experimental
concentrations and estimated formation constants.• Use non-linear least squares regression analysis to
minimize the difference between the experimental data (pHexp) and the simulated curve (pHcalc).
• When the curves match, the formation constants have been determined.
• The curve fitting process provides a statistical evaluation of the data through sigma and Chi-square values.
32
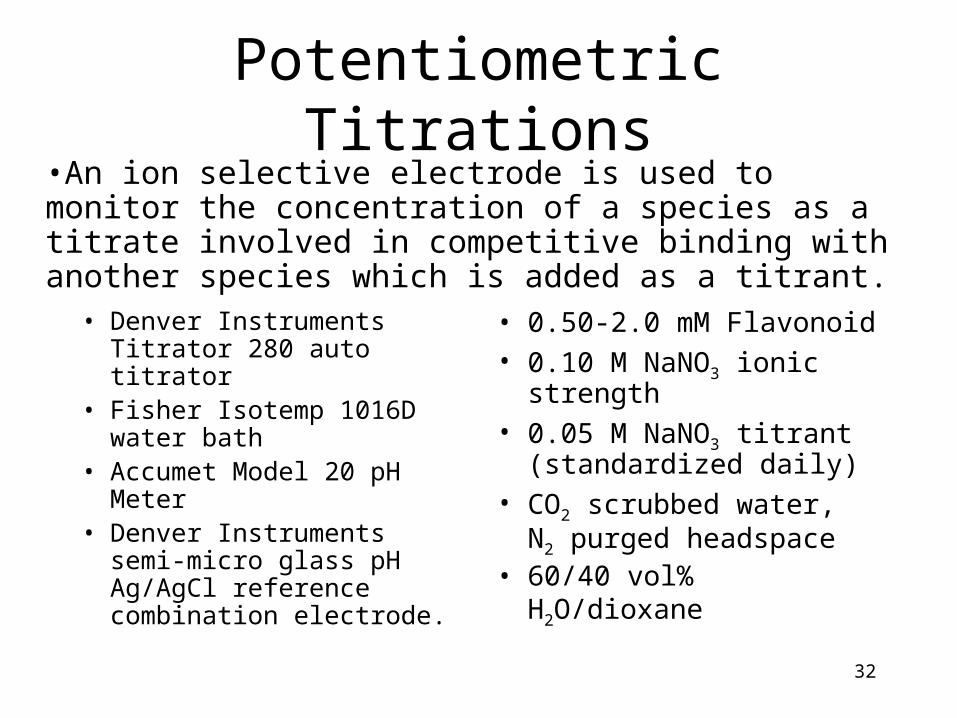
Potentiometric Titrations
• Denver Instruments Titrator 280 auto titrator
• Fisher Isotemp 1016D water bath
• Accumet Model 20 pH Meter• Denver Instruments semi-
micro glass pH Ag/AgCl reference combination electrode.
• 0.50-2.0 mM Flavonoid• 0.10 M NaNO3 ionic
strength• 0.05 M NaNO3 titrant
(standardized daily)• CO2 scrubbed water, N2
purged headspace• 60/40 vol% H2O/dioxane
•An ion selective electrode is used to monitor the concentration of a species as a titrate involved in competitive binding with another species which is added as a titrant.

33
residuals in pH for selected data. Unweighted rms=2.86e-02
0 10 20 30 40 50 60 70point number
-0.2
-0.1
0.0
0.1
0.2
Speciation and pH: data from c:\my documents\research\data\flavonoid ka's\fisetin 121101.ppd
0
10
20
30
40
50
60
70
80
90
100%
form
atio
n re
lativ
e to
H
pH
6
7
8
9
10
11
O
OH
OH
OH
OH
Fisetin
pka
11.906
11.773
9.965
8.405
sigma 1.54
chi2 11.9
34
residuals in pH for selected data. Unweighted rms=3.19e-02
0 20 40 60 80 100 120point number
-0.1
0.0
0.1
Speciation and pH: data from C:\My Documents\chrysin 092402.ppd
0
10
20
30
40
50
60
70
80
90
100
% fo
rmat
ion
rela
tive
to C
hry
pH
4
5
6
7
8
9
10
O
OH
OHChrysin
pka
11.406
7.983
sigma 1.62
chi2 73

35
residuals in pH for selected data. Unweighted rms=6.32e-03
0 10 20 30 40 50 60 70point number
-0.02
0.0
0.02
Speciation and pH: data from c:\my documents\mark's\research\data\flavonoid ka's\galangin 121301.ppd
0
10
20
30
40
50
60
70
80
90
100%
form
atio
n re
lativ
e to
H
pH
6
7
8
9
10
11
O
OH
OH
OH
Galangin
pka
11.694
10.684
8.232
sigma 0.53
chi2 10.7

36
residuals in pH for selected data. Unweighted rms=4.01e-02
0 10 20 30 40 50 60 70point number
-0.2-0.10.00.10.2
Speciation and pH: data from c:\my documents\mark's\research\data\flavonoid ka's\kaempferol 121201.ppd
0
10
20
30
40
50
60
70
80
90
100
% fo
rmat
ion
rela
tive
to H
pH
6
7
8
9
10
11O
O
OH
OH
OH Naringenin
sigma 1.61
chi2 7.74
pka
11.324
10.034
8.238
37
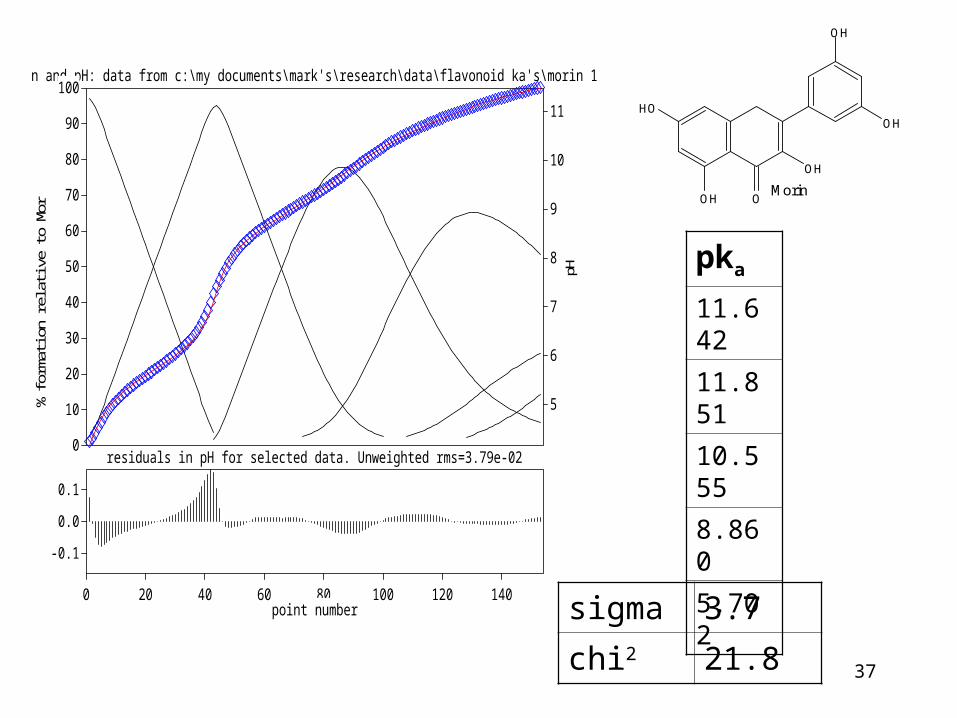
residuals in pH for selected data. Unweighted rms=3.79e-02
0 20 40 60 80 100 120 140point number
-0.1
0.0
0.1
Speciation and pH: data from c:\my documents\mark's\research\data\flavonoid ka's\morin 121401.ppd
0
10
20
30
40
50
60
70
80
90
100
% fo
rmat
ion
rela
tive
to M
or
pH
5
6
7
8
9
10
11
O
OH
OH
OH
OH
OH
Morin
sigma 3.7
chi2 21.8
pka
11.642
11.851
10.555
8.860
5.702
38
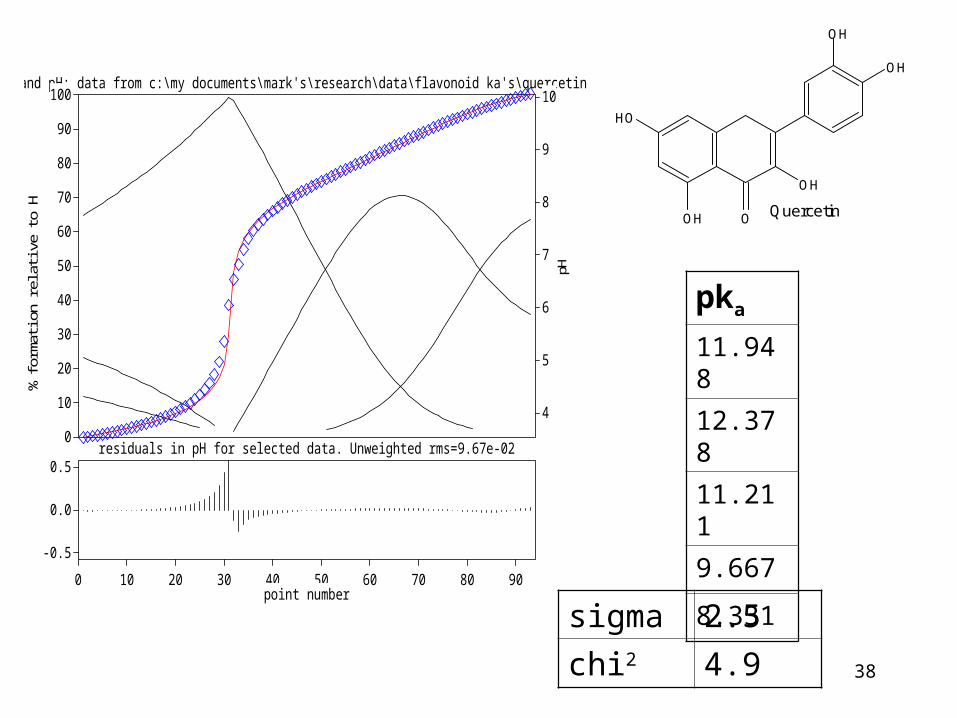
residuals in pH for selected data. Unweighted rms=9.67e-02
0 10 20 30 40 50 60 70 80 90point number
-0.5
0.0
0.5
Speciation and pH: data from c:\my documents\mark's\research\data\flavonoid ka's\quercetin 022602b.ppd
0
10
20
30
40
50
60
70
80
90
100
% fo
rmat
ion
rela
tive
to H
pH
4
5
6
7
8
9
10
O
OH
OH
OH
OH
OH
Quercetin
sigma 2.5
chi2 4.9
pka
11.948
12.378
11.211
9.667
8.331

39
quercetin morin naringin galangin chrysin Fisetin
pk1 8.331 5.702 8.238 8.232 7.983 8.405
pk2 9.667 8.860 10.034 10.684 11.406 9.965
pk3 11.211 10.555 11.324 11.694 11.773
pk4 11.948 11.642 11.906
pk5 12.378 11.851
40
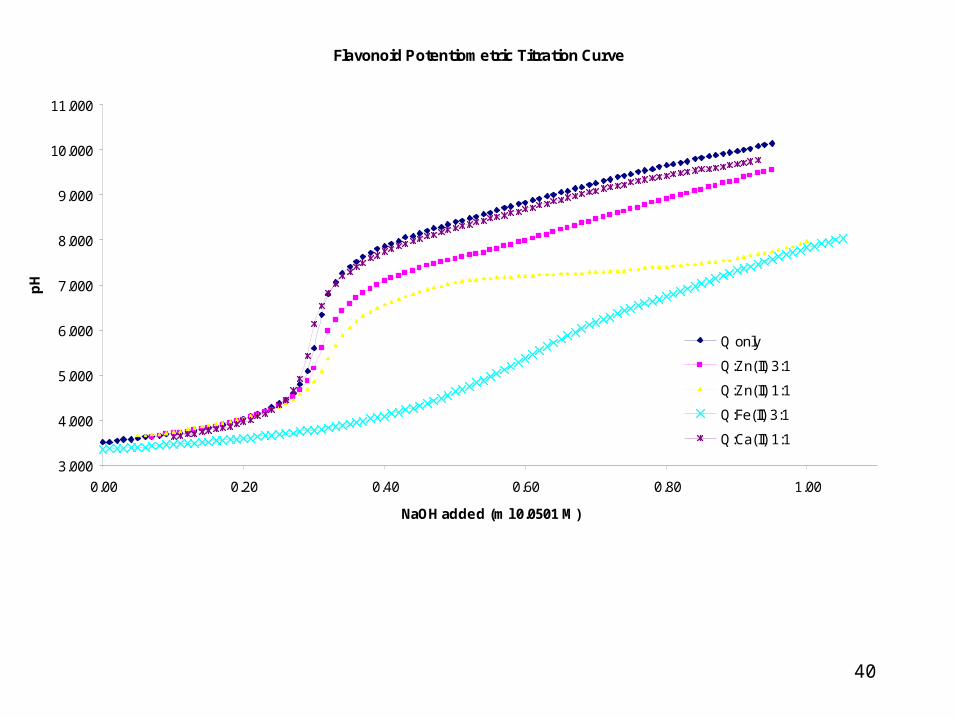
Flavonoid Potentiometric Titration Curve
3.000
4.000
5.000
6.000
7.000
8.000
9.000
10.000
11.000
0.00 0.20 0.40 0.60 0.80 1.00
NaOH added (ml 0.0501 M)
pH
Q only
Q:Zn(II) 3:1
Q:Zn(II) 1:1
Q:Fe(II) 3:1
Q:Ca(II) 1:1
41
Work in Progress
• Complete spectroscopic studies in order reveal SAR.
• Extend the EC’ assay to other flavonoids.
• Obtain FeEDTA-flavonoid mixed ligand binding constants.
42
4 6 8 10pH
0
20
40
60
80
100%
form
atio
n re
lativ
e to
Fe
4 6 8 10pH
0
20
40
60
80
100
% fo
rmat
ion
rela
tive
to F
e
FeEDTA
HO2-FeEDTA
Q-FeEDTA
HO-FeEDTA
Q-FeEDTA
HO2-FeEDTA
HO-FeEDTA
FeEDTA
pH 7.4
pH 7.4
[FeEDTA][H2Q]
[FeEDTA-H2Q]k = =1010
[FeEDTA][H2Q]
[FeEDTA-H2Q]k = =1013
Assuming 0.1 mMFeIIIEDTA, 14 mM H2O2, and 0.1 mM quercetin
Q = quercetinFe = ferric FeIII

43
Summary
• The mechanism of Flavonoid antioxidant activity by metal chelation is most likely two-fold:– Flavonoids that posses large enough affinity constants
for the mixed FeEDTA-flavonoid complex formation disfavor the speciation of the highly reactive FeEDTA-peroxy complex.
– The newly formed FeEDTA-flavonoid complex shifts the metal based electrochemistry beyond the range for Fenton redox cycling.

44
Acknowledgements:
Cheng GroupTom BrandtJessica PoindexterTerry HyattRob BobierKevin BreenRyan HutchesonChemistry department
National Institute of Health
Coworkers:
Financial:
Renfrew scholarship
...and for moral support:
The Engelmanns