1 child budgeting in india april 25, 2006 dr. loveleen kacker ministry of women and child...
TRANSCRIPT

1
Child Budgeting in India
April 25, 2006
Dr. Loveleen KackerMinistry of Women and Child Development
H

2
Overview of the Situation in India
• Significant results have been achieved for children and women in India over the past decade
• However, many trends in key indicators must accelerate if the national development targets are to be met

3
• Significant economic progress– Impressive economic growth since early 1990s
– Foreign Exchange reserves exceeding US$100 billion
– Global IT industry, outsourcing of business processes
• Growing global political influence and aspirations– Seat on Security Council
– India as donor to other developing countries
– Global champion of democracy
Even as some indicators on India show a country that is “shining”…
4
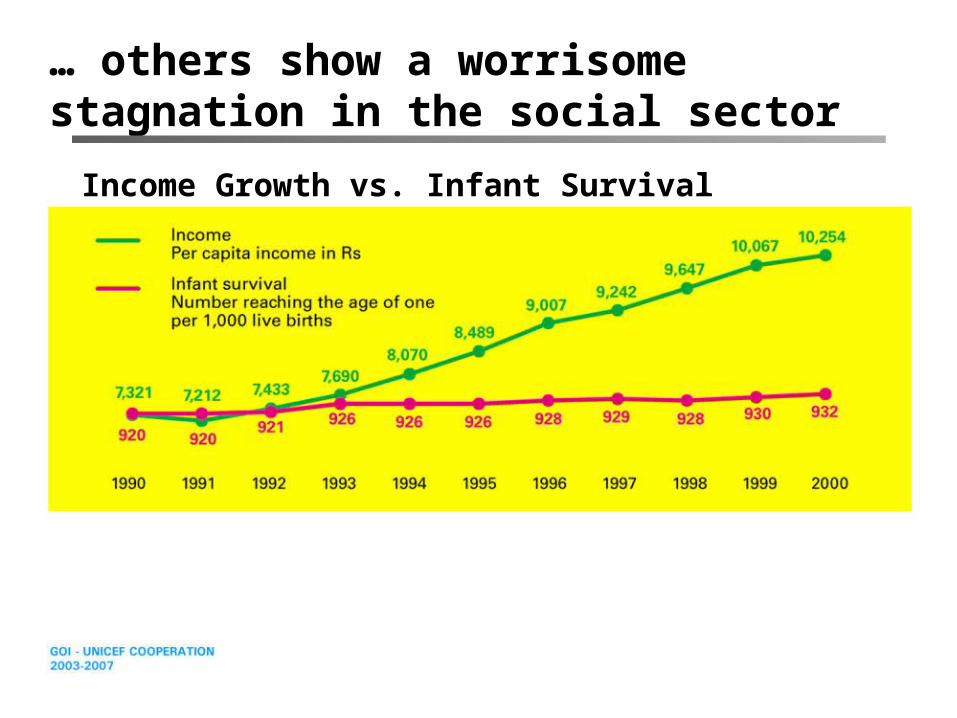
… others show a worrisome stagnation in the social sector
Income Growth vs. Infant Survival

5
0
20
40
60
80
100
120
1980
1982
1984
1986
1988
1990
1992
1994
1996
1998
2000
2002
Death
s p
er
1,0
00
liv
e b
irth
s
Target is to reduce Infant Mortality Rate (IMR) to 45 per 1000 live births by 2007
There was good progress in infant mortality reduction during the 1980s ...
… but progress has slowed since 1993.
Source: Sample Registration System 2002, India
60
Target :
45 by 2007
55

6
The national average IMR also conceals significant disparities between the states...
Uttar Pradesh
Madhya Pradesh
Karnataka
Lakshadweep U.T.
Maharashtra
Goa
KeralaTamil Nadu
Pondicherry
Andhra Pradesh
Dadra & Nagar Haveli
Rajasthan
Gujarat
Daman & Diu
Jammu & Kashmir
DelhiHaryana
PunjabChandigarh U.T.
BiharWest Bengal
Orissa
Andaman & Nicobar Islands
Mizoram
MeghalayaAssam
Sikkim
Manipur
Tripura
Arunachal Pradesh
Nagaland
Himachal Pradesh
Note : The boundaries and the names shown and the designations used on these maps do not imply official endorsement or acceptance by the United Nations.Source: Sample Registration System
Deaths per 1,000 live births
14 - 30.6030.60 - 47.2047.20 - 63.8063.80 - 80.4080.40 - 97
Missing Data
In 2003, there was a 77 point difference between Orissa (87 per 1,000) and Kerala (10 per 1,000)

Source: NFHS 1998-99
Basic Child Health still needs to be improved
Proportion (%) of young children (0 to 3 years) who are
Not fully vaccinated 58
Not vaccinated at all 14
Birth was not preceded by any antenatal checkup 34
Suffer from moderate or severe anaemia 51
Had fever during the last two weeks 30
Had diarrhoea during the last two weeks 19
Had symptoms of acute respiratory infection during the last two weeks 19

8
Child malnutrition in India remains a serious concern
51.7
55.1
43.9
49.6
28.6
26.936.7
37.7
50.6
45.1
34.5
34.734.6
28.7
54.448.7
54.4
27.7
37.936
20.6
27.5
24.3
24.1
43.6
Per cent
20-3030-4040-47National Average and Above (47 +)
Source: NFHS 1 & 2, 1992-93 & 1998-99
5347
20
25
30
35
40
45
50
55
60
1992-93 1998-99
India (% children moderately to severly underweight)

9
79.3
85.7
73.1
87.3
76.1
71.8
59.2
81.4
Total Male Female Urban Rural SC ST Others
Universal Primary Education has not yet been achieved
Children age 5-14 years currently attending school, 2000
Source: MICS, 2000
10
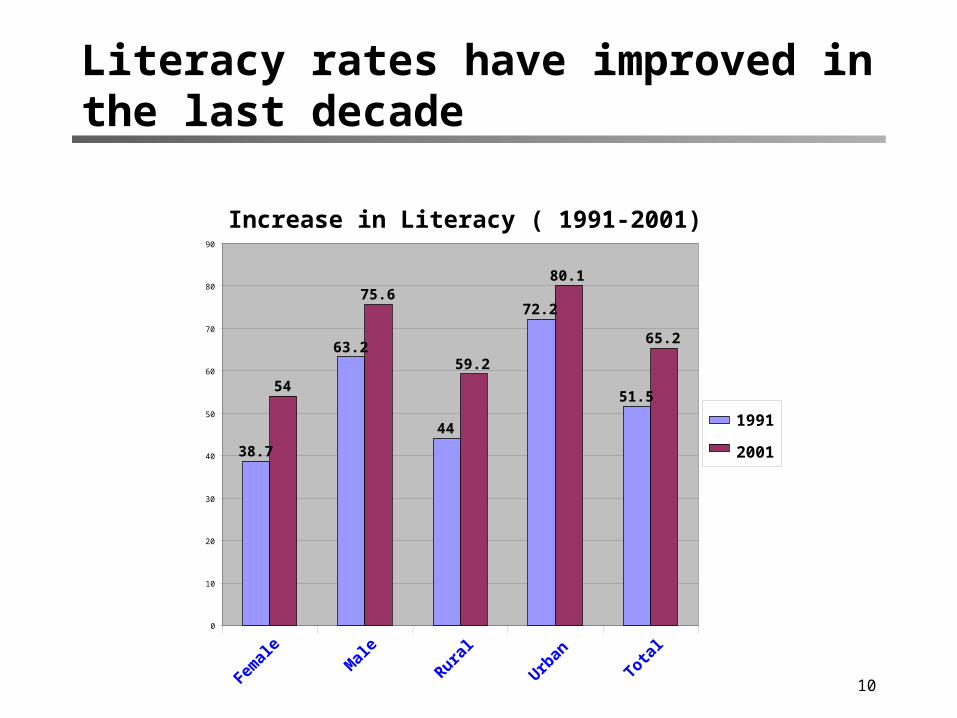
Literacy rates have improved in the last decade
Increase in Literacy ( 1991-2001)
38.7
63.2
44
72.2
51.554
75.6
59.2
80.1
65.2
0
10
20
30
40
50
60
70
80
90
Femal
eM
ale
Rural
Urban
Total
1991
2001

11
The girl child continues to be fatally discriminated against in many areas
Females per 1000 males
766 - 850851 - 900901 - 927928 - 1035
Missing data
Child Sex Ratio 2001 (by district)

12
• Birth registration• Street children• Child labour• Child marriage• Trafficking in children• Juvenile justice• Orphans/abandoned/destitute children• Adoption
Child Protection issues must also be addressed

13
• Reduce IMR to 45 per 1,000 live births by 2007• All children in school by 2003, all children to
complete five years of schooling by 2007• Reduce the gender gap in literacy by at least 50% by
2007• Increase literacy rates to 75 per cent by 2007• Reduce Maternal Mortality Rate (MMR) to 2 per
1000 live births by 2007
The 10th Plan outlines ambitious targets
The challenge is to ensure economic progress translates into social development

14
Rationale for Child Budgeting
• In unequal societies, protecting children´s rights (eg: health, education, nutrition) requires distribution of resources via State action (taxation and social spending)
• The current insufficient level of public resources allocated to the social sector is one important reason for this slow rate of progress.
• To secure children´s rights effectively, adequate funding is a necessary, but not sufficient condition
• Article 4 of the Convention of the Rights of the Child notes the obligation of States to implement rights to the maximum extent of their available resource; this implies an analysis of public budgets, including its effects on children, is necessary

15
Child Budgeting is one way to address these concerns and promote child rights
• Child Budgeting is an attempt to examine what resources government is allocating to programmes that benefit children, and whether these programmes adequately reflect the needs and rights of children.
• Several questions arise:– Does the State have enough resources?– Will these resources be available in a timely manner?– Are these resources used in an efficient and equitable way?

16
Objectives of a child budget initiative
1. Higher allocations for children in public budgets as required to reach national development targets and the MDGs
2. Improved utilisation of allocated provisions, through fiscal decentralization, participation, transparency and accountability

17
Child Budgeting initiatives are underway in numerous different countries
• Australia: “women’s budget” since 1984
• South Africa: children’s budget project since 1994
• Brazil: children’s budget project since 2001-2
• Kenya, Uganda, Tanzania: children’s budget project since 2005

18
The allocations for flagship programmes in 2006-7 increased by nearly 50% from 2005-6
Allocations for Flagship Programmes (INR crores)
Flagship Programme 2005-6 2006-7National Rural Employment Gurantee Scheme 11,000 14,300Sarva Siksha Abhiyan 7,156 10,041National Rural Health Mission 6,553 8,207Mid-day Meal Scheme 3,010 4,813Rajive Gandhi Drinking Water Mission 3,645 4,680Jawaharlal Nehru National Urban Renewal Mission N/A 4,595Integrated Child Development Services 3,315 4,087Total Sanitation Campaign 630 800Total: 35,309 51,523

19
Social sector expenditures have been increasing…
• Growing economy• Increased policy efforts and expansion of programmes
Union Govt. Expenditure on Social Services as a Proportion of GDP (%)
0
0.2
0.4
0.6
0.8
1
1.2
1996-97 1997-98 1998-99 1999-00 2000-01 2001-02 2002-03 2003-04 2004-05 2005-06RE
2006-07BE

20
Health expenditure, public (% GDP)
0 2 4 6 8 10
GermanyFrance
CanadaAustralia
JapanUK
ThailandSri
PakistanIndia

21
Health expenditure, private (% GDP)
0 0.5 1 1.5 2 2.5 3 3.5 4 4.5
United KingdomThailand
JapanSri Lanka
FranceAustralia
CanadaGermanyPakistan
India

22
…but this is still low in comparison to other developing countries
This is especially concerning since children comprise over one-third of India’s population
% of Central Govt. Expenditure Allocated to Social Sectors (1993-2004)
2 2
7
18
4
11
0
2
4
6
8
10
12
14
16
18
20
Health Education
India
Bangladesh
Developing Countries
Source: State of the World's Children 2006

23
Total budgetary provisions for children as a proportion of total expenditure has increased
• 2.11% in 2001-02 (RE) to 4.86 % in 2006-07 • Child Protection continues to be neglected
Allocations on Children as a Proportion of Total Expenditure by Union Government
0123456
2001-02RE
2002-03RE
2003-04RE
2004-05RE
2005-06RE
2006-07BE
Protection
Education
Health
Development

24
1999-002000-
01 2001-02 2002-03 2003-04 2004-05 2005-06% increase since 99/00
Elementary Education 2852 3150 3732 4302 4900 8000 12532 339
Health 1062 1250 1393 1480 1651 2211 2908 174
Family Welfare 3120 3200 3506 4174 4955 5300 6424 106
Women & Child Development 1250 1350 1642 2085 2600 2400 3875 210
Water & Sanitation 2250 2750 3300 4750
Central Plan Outlay in Core Rs.
Source: Government of India, Budget Document

25
Child Budgeting in India
Of every 100 Rupee allocated by the government, only three rupees and seventy-seven paise is being allocated for children
Total Union Budget
Child Budget
Child Development
Child Health
Education
Child Protection

26
Percentage Share of Various Sectors in the Total Child Budget
Year Total Child Budget
% Share of Child Development (DWCD)
% Share of Child Health (Health and Family Welfare)
% Share of Education (Elementary and Secondary Education)
% Share of Child Protection (MSJE and
Labour)
2003-04 10234.73 21.4 14.7 62.9 1.0
2004-05 11678.02 17.3 17.3 64.2 1.2
Data: GOI Expenditure Budget 2003-04, 2004-05 (Vols 1&2).
Source: HAQ Centre for Child Rights
27
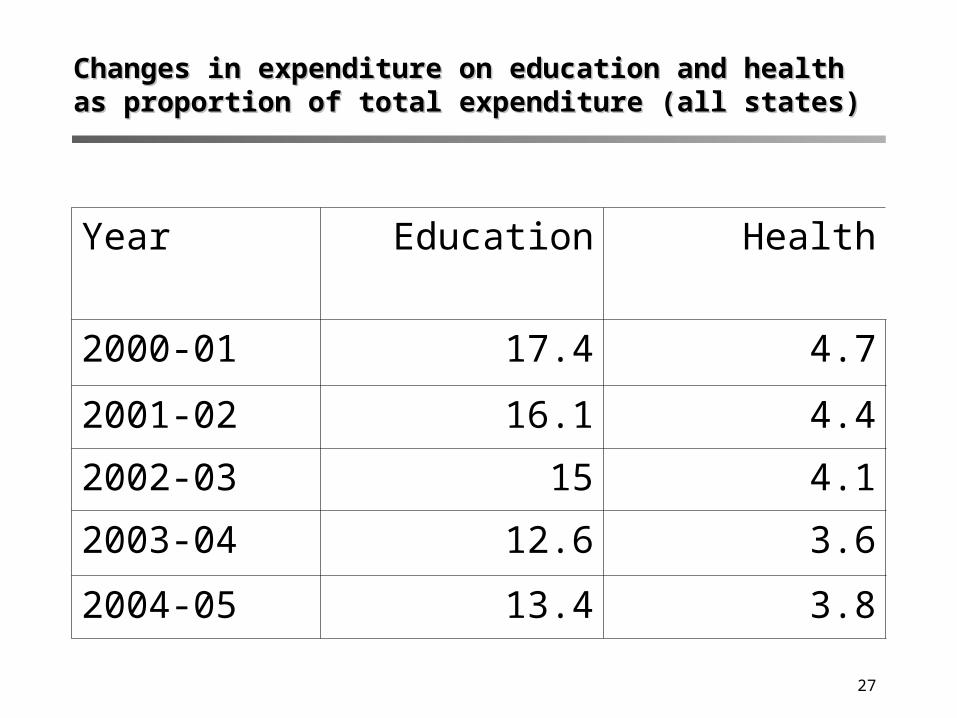
Changes in expenditure on education and health as proportion of Changes in expenditure on education and health as proportion of total expenditure (all states)total expenditure (all states)
Year Education Health
2000-01 17.4 4.7
2001-02 16.1 4.4
2002-03 15 4.1
2003-04 12.6 3.6
2004-05 13.4 3.8

28
Importance of States
• States are primarily responsible for the provision of social sector services, yet are dependent to a certain extent on flows from the Central government.
• Ironically, state governments tend to cut back their spending as allocations by the Centre increase.
• There is a wide variance across states in social sector expenditures

29
Issues for concern
• Weak monitoring systems and limited use of evidence at local levels: Absence of performance appraisal – field reports are not verified, quality is not measured
• Poor accountability & high absenteeism: Frequent transfers, vacant posts particularly in remote locations, poor performance of service-providers
• Uncertainty about release of funds• Predominance of vertical, issue-specific approaches: about 240
centrally sponsored schemes to monitor• Low levels of community involvement in management of services• Management and systemic bottlenecks particularly in
disadvantaged states• Greater efforts to improve delivery needed in poorer states which
have capacity constraints

30
Taking Child Budgeting forward…
• State-level exercises on Child Budgeting, led by the Ministry of Women and Child Development in partnership with Planning and Finance Departments are being initiated in 2006 across the country
• These are aimed at strengthening the planning process for the 11th Plan period (2007-2012) and beyond.

31
…will go hand in hand with the Outlays to Outcomes initiative
• Shift focus from input controls to monitoring of outcomes- Develop intermediate and final outcome indicators, and collect reliable information, even on a sample basis- Use available information for remedial action- Improve M & E capacity within & outside government
• Encourage knowledge based advocacy- Collect best practices

32
Conclusions: The Challenges we Face
• Reducing inequalities is a key priority for children
• Progress is not taking place at a fast enough rate to constitute real change
• While overall resources for the social sectors are increasing, we need better targeting to ensure that all child-related needs are adequately resourced
• Overhaul of budgeting and management systems required to ensure that outlays are increased and translate into meaningful outcomes for all children

33
Way Forward
• Increased allocation for children’s issues• Improved implementation and utilization: put systems
in place for improved delivery and monitoring
• Suggestion is that review workshops be held in each state to review progress, analyze budgets and develop action plans– UP, Chattisgargh to hold theirs in May

34
Child Budgeting Methodology/Data Sources
• Union Budget documents, in particular the Annual Financial Statement and Expenditure Budget Vol. II (Notes on Demands for Grants), for various years. Data for Union Government’s expenditures on Social Services have been collected from the Annual Financial Statements (AFS). Data for Union Government’s allocations for programmes/ schemes meant specifically for children have been taken mainly from Expenditure Budget Vol. II (Notes on demands for Grants) for various years.
• Selection of programmes/ schemes (from among all programmes/ schemes funded by the Union Government) as directly addressing the specific needs of children is a subjective exercise,