1 characteristics of perennial wheatgrass ( thinopyrum
TRANSCRIPT

1
Characteristics of perennial wheatgrass (Thinopyrum intermedium) and refined wheat flour 1
blends: the impact on rheological properties 2
Alessandra Marti1,2,3
, Xiaoxue Qiu1, Tonya C. Schoenfuss
1 and Koushik Seetharaman
1 3
1 Department of Food Science and Nutrition, University of Minnesota, 1334 Eckles Ave, St. Paul, 4
MN 55108 5
2 Department of Food, Environmental and Nutritional Sciences (DeFENS), University of Milan, via 6
G. Celoria 2, 20133, Milan, Italy 7
3 Corresponding author. E-mail: [email protected]; [email protected] 8
Page 1 of 35

2
ABSTRACT 9
Intermediate wheatgrass (IWG) (Thinopyrum intermedium) is a perennial grass with desirable 10
agronomic traits and positive effects on the environment. It has high fiber and protein contents, 11
which increase the interest in using IWG for human consumption. In this study, IWG flour was 12
blended with refined wheat at four IWG:wheat ratios (0:100, 50:50, 75:25, 100:0). Samples were 13
analyzed for proximate composition, microstructure features, pasting properties (using Micro 14
Visco-Amylograph), protein solubility, and total and accessible thiols. Gluten aggregation 15
properties (using GlutoPeak) and mixing profile (using Farinograph) were also evaluated. IWG 16
flour enrichment increased the pasting temperature and decreased peak viscosity of blended flours. 17
IWG proteins exhibited higher solubility than wheat, with a high amount of accessible and total 18
thiols. GlutoPeak highlighted the ability of IWG proteins to aggregate and generate torque. Higher 19
IWG flour enrichment resulted in faster gluten aggregation with lower peak torque, suggesting 20
weakening of wheat gluten strength. Finally, the addition of IWG to refined wheat flour resulted in 21
a decrease in dough development time and an increase in consistency, likely due to the higher levels 22
of fiber in IWG. The 50% IWG flour enrichment represents a good compromise between nutritional 23
improvement and maintenance of the pasting properties, protein characteristics and gluten 24
aggregation kinetics. 25
Keywords: perennial wheatgrass; gluten aggregation; pasting properties; protein structural features; 26
Thinopyrum intermedium 27
Page 2 of 35
4
The development of perennial crops has received great attention from agronomists, breeders and 28
environmentalists because they can be used as alternative crops for marginal lands due to the low 29
environmental impact (Wagoner and Schauer 1990). In 1983, the Rodale Research Center began 30
studying a number of perennial crops and Thinopyrum intermedium - commonly called intermediate 31
wheatgrass (IWG) - was selected as one of the best perennial crop candidates according to 32
compositional and nutritional analyses. IWG is well known to possess many favorable agronomic 33
characteristics, including resistance of various diseases present in common wheat, drought and frost 34
resistance, and high biomass (Wagoner and Schauer 1990; Vogel and Jensen 2001). As a perennial 35
species, IWG processes a longer growing season and greater root mass than annual crops, which 36
can greatly reduce erosion risks and nitrate leaching (Glover et al 2010; Culman et al 2013). 37
Therefore, it has the potential to positively impact on environment, and it could successfully replace 38
annual crops - as cereals are - for food production, especially on marginal agricultural lands. 39
From a nutritional point of view, IWG seed was found to have a higher concentration of protein; 40
although IWG seed protein is nutritionally poor in lysine as is wheat, it has higher amount of all 41
other essential amino acids than wheat (Becker et al 1991). 42
In a recent study, the chemical properties of IWG have been investigated (Bunzel et al 2014; 43
Schoenfuss et al 2014)), highlighting the superiority of IWG compared to whole wheat in terms of 44
protein and fiber content. The gluten protein profile of IWG, however, differs significantly from 45
that of conventional wheat. IWG gluten proteins is comprised mostly of α and γ gliadins, and some 46
low molecular weight (LMW) glutenins (Bunzel et al 2014). All the IWG varieties tested were 47
deficient in high molecular weight (HMW) glutenins (Bunzel et al. 2014), suggesting a poor gluten 48
forming ability. 49
Based on nutritional characterization, IWG-based food products, to a greater extent, might have 50
nutritional benefits for consumers. Nevertheless, as for improvement of IWG potential for food 51
Page 3 of 35

4
production, efforts are tied to the bottleneck of the functional properties of IWG seed grain that are 52
critical for the functionality of foods. It has been reported that no gluten aggregation was found in 53
IWG (Becker et al 1991), indicating that IWG flour is not very suitable for preparing gluten-based 54
foods, such as bread and pasta. More recently, unextractable polymeric proteins, which closely 55
affect wheat rheological properties, were found in hybrid crosses of common wheat and IWG 56
(Hayes et al 2012). More information from a molecular standpoint - starch and protein - on this crop 57
is required in view of a possible application of IWG flour cereal-based products. In this regard, as 58
well-established, the property that makes wheat unique is the ability of its proteins to form a 59
viscoelastic dough. The interactions leading to the formation of the visco-elastic network of gluten 60
involve rearrangement of hydrophobic contacts among proteins (or within individual proteins) and 61
rearrangement of intra- and intermolecular disulfides and thiols in a disulfide exchange process 62
(Morel et al 2002). In regards to starch, changes in viscosity of cereal flours or starches during 63
heating and cooling provides information on molecular changes promoted by processing conditions 64
(Marti et al 2013) or ingredient interactions (Marti et al 2011). 65
The aim of this study was to evaluate the rheological properties of IWG and refined wheat 66
flour blends, with the goal of increasing the amount of IWG that can be included in a baked-67
product. Through this study, it is expected to determine the functionality and potential use of IWG 68
blends in baked product systems, which can benefit both the environment and consumers’ health. 69
70
MATERIALS AND METHODS 71
Materials. Commercial refined flour from hard wheat (HWF) was kindly provided by Horizon 72
Milling LLC (Mankato, MN, USA). Intermediate wheatgrass (IWG) was kindly provided by the 73
Land Institute (Salina, Kansas, USA). IWG kernels were ground in a whole grain flour Cyclone 74
Page 4 of 35

5
Sample Mill (UDY Corp., Fort Collins, CO) equipped with a 0.25 mm screen. Blends at four 75
IWG:HWF ratios (0:100, 50:50, 75:25 and 100:0) were prepared. These percentages of enrichment 76
were chosen in order to provide a flour with a fiber content higher than 10%. 77
Proximate composition. Starch, proteins and fiber contents were determined in triplicate according 78
to the approved methods AACC 76-13, 46-30.01, and 32-07.01, respectively (AACC 2000). 79
Moisture content was measured by drying the sample at 180°C for 4 min by an infrared balance 80
(MB 45, OHAUS, Parsippany, NJ). 81
Microstructural features. Microscopy images of refined wheat flour and IWG (whole grain) were 82
obtained by means of an Olympus BX40 microscope (Olympus Co., Tokyo, Japan) using Lugol 83
(I2KI) as staining. 84
Pasting Properties. The pasting properties of blended flours were determined using a Micro-Visco 85
Amylograph (C. W. Brabender Instruments, South Hackensack, NJ). Fifteen grams of flour (14% 86
moisture) were dispersed in 100 mL of distilled water and stirred at 250 rpm during the test. The 87
following temperature profile was applied: mixing at 30°C for 3 min, heating from 30 °C to 95 °C 88
at a heating rate of 7.5 °C/min, holding at 95 °C for 5 min, cooling from 95 °C to 30 °C at a cooling 89
rate of 7.5 °C/min, and holding at 30°C for 2 min. Measurements were performed in triplicate. The 90
following indices were considered: i) pasting temperature (temperature at which an initial increase 91
in viscosity occurs); ii) peak viscosity (maximum viscosity achieved during the heating cycle); iii) 92
peak temperature (temperature at the maximum viscosity); iv) breakdown (index of viscosity 93
decrease during the holding period, corresponding to the peak viscosity minus the viscosity after the 94
holding period at 95 °C); v) final viscosity; vi) setback (index of the viscosity increase during 95
cooling corresponding to the difference between the viscosity at 30 °C and the viscosity reached 96
after the first holding period). 97
Page 5 of 35

6
Protein Solubility. An aliquot of flour containing ~1 mg protein were suspended in 1 mL of a 0.05 98
M sodium phosphate buffer (pH 6.8) in presence/absence of 2.0% sodium dodecyl sulfate (SDS) 99
and containing 0.01 mol L-1
dithiothreitol (DTT) where indicated and transferred to a shaker for 60 100
min at room temperature. After centrifugation (12,200×g for 5 min), the amount of protein in the 101
supernatant was determined colorimetrically using the RC-DC Protein Assay (Bio-Rad, Hercules, 102
CA, USA). All samples were measured in triplicate and results were expressed as mg soluble 103
protein/g protein. 104
Accessible and Total Thiols. Accessible thiols were determined following the method described by 105
Iametti et al (2006). A 100 mg aliquot of flour was suspended in 5 mL of buffer containing 0.05 M 106
sodium phosphate, 0.1 M NaCl and 0.5 mM DTNB (5,5’-dithiobis(2-nitrobenzoic acid)). The 107
suspensions were incubated for 60 min at 25 °C and centrifuged for 3 min at 11,000 x g. The 108
absorbance of the supernatant was determined at 412 nm. Total thiols were measured by the same 109
method but in the presence of 1% SDS. 110
Gluten Aggregation Properties. Gluten aggregation properties of flours were measured using the 111
GlutoPeak (C.W. Brabender Inc., South Hackensack, NJ, USA), as reported by Kaur Chandi and 112
Seetharaman (2012). An aliquot of 8.5 g of flour was dispersed in 9.5 g of 0.5M CaCl2, scaling both 113
water and flour weight on a 14% flour moisture basis. Sample temperature was maintained at 34 °C 114
by circulating water through the jacketed sample cup. The paddle was set to rotate at 1900 rpm and 115
the test was carried out for 10 minutes. All the measurements were performed in triplicate. The 116
main indices automatically evaluated by the software are: i) the maximum torque (expressed in 117
Brabender Equivalents - BE), corresponding to the peak occurring as gluten aggregates; ii) the peak 118
maximum time (expressed in seconds), corresponding to the time before torque falling off when 119
gluten breaks down. 120
Page 6 of 35

7
Mixing Properties. The behavior of the dough during mixing was measured using a Farinograph-121
AT (C.W. Brabender Inc., South Hackensack, NJ, USA) equipped with a 50 g mixing bowl. The 122
AACC 54-21 standard method (AACC 2000) was used for the identification of optimal water 123
absorption for wheat flour. Dough samples containing intermediate wheatgrass were prepared at the 124
same water absorption as wheat dough. Measurements for each sample were performed in 125
triplicates. 126
Statistical Analysis. All experiments were performed in triplicates. Analysis of variance (ANOVA) 127
was performed using Statgraphic Plus for Windows v. 5.1. (StatPoint Inc., Warrenton, VA, USA). 128
The level at which significant differences are reported is p≤0.05. 129
RESULTS AND DISCUSSION 130
Proximate composition. Chemical composition of refined wheat flour (HWF) and intermediate 131
wheatgrass (IWG) is shown in Table I. As reference, data of whole wheat flour (USDA 2015) were 132
shown. IWG flour exhibited a significantly (p≤0.05) lower total starch content compared to 133
bothrefined and whole wheat flour (47.7% , 73.9%, and 72% respectively) and a higher amount of 134
protein (20%, 15% and 13.2% for IWG, refined and whole wheat flours, respectively). The protein 135
data corresponds with results previously collected where IWG has been reported to have protein 136
contents ranging from (17 – 21%; Becker et al 1991, 1992; Bunzel et al 2014; Schoenfuss et al 137
2014). Despite having more protein, it has been reported that perennial grasses are characterized by 138
a low gluten content (Becker et al 1991). Insoluble and soluble dietary fiber of IWG flour are 139
approximately 8-fold and 4-fold more than those of refined wheat flour (Table I). The differences in 140
dietary fiber are likely related to the nature of flour - whole grain for IWG and refined flour for 141
HWF. Indeed, the kernels of perennial grains are smaller than those of wheat, thus they have a 142
greater surface area per gram of seed and consequently more bran (Becker et al 1991). Published 143
Page 7 of 35

8
data for whole wheat flour show total dietary fiber contents of approximately 11% (USDA, 2015). 144
Bunzel et al (2014) reported IWG to have 16.4% total dietary fiber. Curiously, Becker et al (1991) 145
reported crude fiber of only 1.69% but this is most likely method related. In this study the chemical 146
composition of IWG was compared to that of HWF since the following sections the rheological 147
properties of IWG and its blends with common wheat were assessed. 148
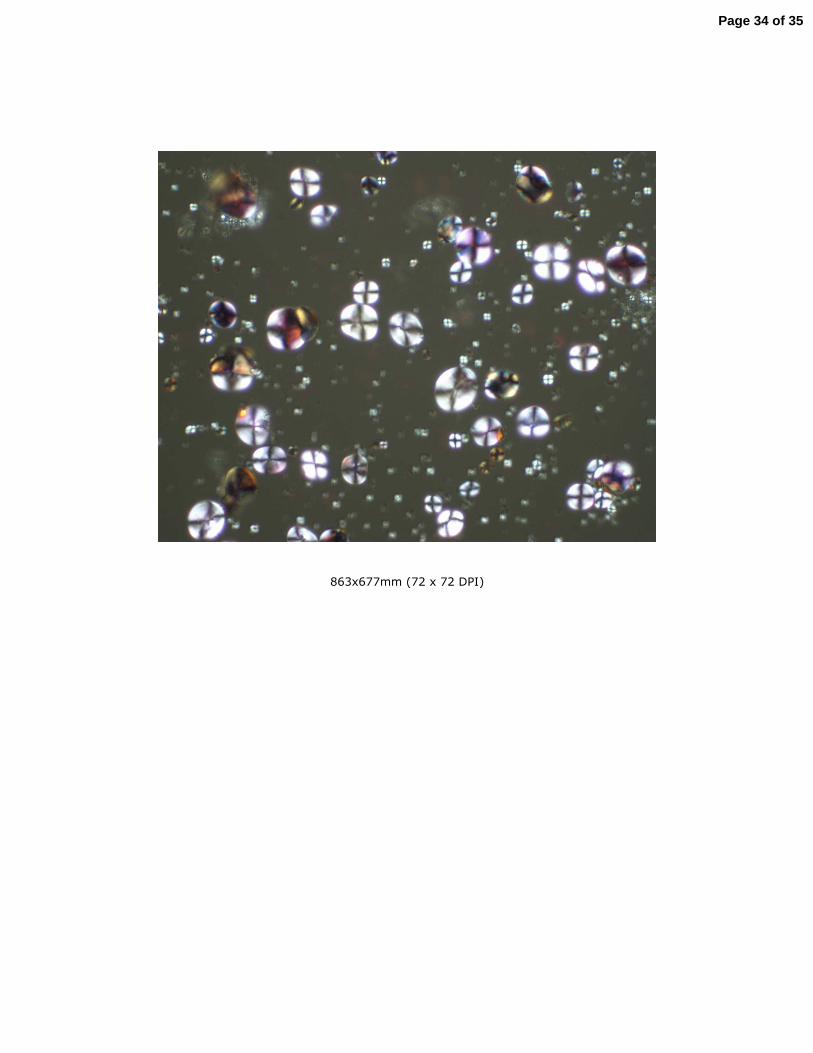
Microstructural features. Pictures of HWF and IWG starch granules in refined wheat flour and 149
intermediate wheatgrass are shown in Fig. 1. Starch granules in HWF exhibited the bimodal 150
distribution typical of wheat flours, with the presence of large-sized round starch granules (A-type) 151
accompanied by many smaller round granules (B-type) (Fig. 1a). In IWG flour, starch granules 152
appear assembled together, and in some cases embedded within the cell wall, so that they do not 153
appear well distributed in the field of view (Fig. 1b). Moreover, IWG starch granules in the 154
presence of iodine solution did not appear in blue/violet color as wheat starch granules did, 155
suggesting poor affinity to iodine; this is an aspect that needs further investigation. Schoenfuss et al 156
(2014) reported that the ratio of amylose/amylopectin in a bulk IWG sample was 23/77 (0.298). 157
This is comparable to what has been reported for various cultivars of hard red spring wheats 158
(Labuschagne et al 2007). Pictures of samples taken under polarized light (Fig. 1c, 1d) highlighted 159
in IWG the presence of a maltese cross, reflecting an ordered and crystalline structure of starch 160
granules. 161
Pasting Properties. Pasting characteristics of blended flours are shown in Fig. 2 while viscosity 162
data are summarized in Table II. HWF exhibited a typical peak of viscosity at about 85.1°C. During 163
the holding period at 95 °C, the product slurries were subjected to high temperatures and 164
mechanical shear stress causing starch granule disruption and amylose leaching, which led to a 165
slight decrease in viscosity (evaluated by the breakdown index). IWG is characterized by a small 166
peak at 96.5°C and by very low breakdown value (Table II). These differences between the samples 167
Page 8 of 35

9
were present even when the test was carried out with a constant starch:water ratio (data not shown), 168
to avoid the effect of starch concentration on pasting properties. The variation in starch granules 169
size and shape are also known to significantly influence pasting properties (Singh et al 2003). The 170
predominant presence of starch granules in IWG that are assembled together could provide an 171
explanation for the onset temperature of gelatinization phenomenon in IWG being 4°C higher that 172
in HWF (Table II). Schoenfuss et al (2014) reported IWG peaked earlier in comparison to whole 173
wheat pastry flour (5.5 vs. 5.8 min), which is the opposite of what we saw with refined wheat flour. 174
They also reported a peak temperature of (95°C), which is a lower temperature than we report 175
(97°C). The likely explanation for these discrepancies are that the values were obtained by different 176
methods (Rapid Visco Analyser versus Micro-Visco Amylograph), and the flours that were used. 177
As expected, as we increased IWG concentrations, effects on pasting properties occurred. Pasting 178
temperature significantly (p≤0.05) increased in the presence of high levels of IWG (≥50%). This 179
result was exclusively related to starch characteristics, since adding bran to refined flour did not 180
significantly affect the pasting temperature (data not shown). Whereas, the decrease (p≤0.05) in 181
peak viscosity in IWF blends was related to differences in chemical composition – protein and fiber 182
content – and to the presence of components - mainly protein and fiber - that are competitive with 183
starch for water. According to Collar et al (2006), the replacement of wheat with soluble and 184
insoluble dietary fibers would reduce initial starch granule swelling accounting for the lower peak 185
viscosities of the pastes. During cooling, the viscosity increased as a result of the formation of a gel 186
structure indicating the tendency of the granules to associate or retrograde. This is evaluated by the 187
setback index. Low setback values indicate low rates of starch retrogradation and syneresis (Ji et al 188
2010). As the substitution levels of IWG flour increased the setback and final viscosities decreased, 189
suggesting low retrogradation tendency. This aspect could be relevant for bread properties during 190
Page 9 of 35

10
storage, since setback values can be considered as valuable predictors at dough level for bread 191
staling kinetics during storage (Collar 2003). 192
Protein Solubility. Solubility of IWG blends proteins in phosphate buffer in the absence and in the 193
presence of denaturing and reducing agents is reported in Fig. 3. Protein solubility in solvent 194
systems with various dissociating ability has been used to discriminate among cereals (Iametti et al 195
2006) and more recently to describe the effects of technological treatments and ingredients on 196
cereal-based products (Bonomi et al 2012). In this study, this approach was used in order to provide 197
information about the type of interactions in IWG. This is of great interest because it has been 198
demonstrated that there is a correlation between the aggregation properties of proteins and their 199
behavior during processing (Ciaffi et al 1996). 200
IWG exhibited a higher protein extractability in phosphate buffer compared to HWF (Fig. 3), 201
suggesting that albumins and globulins are present in a greater amount in IWG. Indeed, 202
extractability in phosphate buffer provides information about proteins held together by ionic 203
interactions. No significant differences (p>0.05) were detected between 50% and 75% IWG and 204
between 75% and 100% IWG flours. As expected, the addition of detergent resulted in increased 205
soluble protein levels in all the samples. Indeed, SDS facilitates the breakdown of hydrophobic 206
interactions and makes soluble those proteins that form homo and heteropolymeric aggregates based 207
exclusively on these kinds of interactions (Bonomi et al 2013). No significant differences in protein 208
solubility were detected between refined flour and 50% IWG sample; on the contrary, the amount 209
of soluble proteins increased as IWG substitution level were greater than 50%. In particular, 210
significant (p≤0.05) differences were observed between HWF and 75%-100% IWG. Furthermore, 211
the amount of IWG flour protein extracted in the presence of a reducing agent was significantly (p 212
<0.05) higher than that of HWF and 50% IWG blend. The addition of disulphide-reducing agents 213
such as DTT to the buffer containing SDS provides the solubilization even of those proteins that 214
Page 10 of 35

11
form or are trapped within aggregates stabilized by disulfide bonds (Bonomi et al 2013). Treatment 215
with denaturant and disulfide reducing agent solubilized about the 80% of the proteins present 216
IWG, but only 60% in the case of common flour. In general, regardless the type of extraction 217
buffer, the degree of extractability of flours was the following: 0%IWG (HWF) < 50% IWG < 75% 218
IWG < 100% IWG. Previously it has been demonstrated that protein insolubility positively affects 219
dough tenacity and consequently dough strength but not its extensibility (Ciaffi et al 1996). A high 220
percentage of IWG enrichment (50%) did not negatively affect protein solubility, which is a 221
promising result from the perspective of being able to incorporate IWG to produce baked-goods 222
with high fiber and protein contents. 223
Total and Accessible Thiols. The content of accessible and total thiols in flours is shown in Fig. 4. 224
The amount of accessible thiols per gram of protein increased as the percentage of IWG increased. 225
In the presence of SDS, the thiol content showed a marked increase. Indeed, thiols buried within the 226
structure of a protein (or a protein aggregate) may become available to suitable reagents only upon 227
protein denaturation by physical or chemical agents (Iametti et al 2013). 228
The total content of thiols significantly increased as the IWG enrichment increased. This result is 229
not related to IWG solubility, since the procedure measures protein thiols independently of protein 230
solubility (Iametti et al 2006). The higher content of thiols in IWG blends compared to HWF is in 231
agreement with the higher number in cysteine residues found in IWG compared to common wheat 232
(Becker et al 1991). Cysteine thiols and cysteine disulfides are the key for generating covalently-233
linked protein networks in many diverse foods (Shewry and Tatham 1997). It has been 234
demonstrated that flours differing in their technological performances traits differ in terms of 235
accessible and total thiols. In particular, soft flours show a lower amount of total thiols compared to 236
hard and durum wheat flour (Bonomi et al 2013). The high level of thiols in IWG is encouraging in 237
view of its use in cereal-based products, such as bread, since the network-forming capacity of 238
Page 11 of 35

12
proteins involved in thiol–disulfide exchange reactions in individual food systems is related to a 239
multiplicity of factors, that include their relative abundance (Iametti et al 2013). However, the 240
amount (and location) of reactive thiols and disulfides, and their availability to exchange events in 241
IWG should be further investigated. 242
Gluten aggregation properties. The GlutoPeak is a new instrument for testing gluten quality. It 243
provides a measurement of the aggregation behaviour of gluten, as it is present in wheat flour, 244
coarse grain or vital gluten (Kaur Chandi and Seetharaman 2012). The gluten aggregation profile of 245
HWF, IWG and their blends are shown in Fig. 5. During the test, the sample is mixed with water 246
(ratio of flour : water about 1:1) and subjected to intense mechanical action by the rotating element. 247
These conditions allow the development of gluten that result in a strong increase in the consistency 248
of the slurry up to a maximum peak. From that moment, the continuous mechanical stress causes 249
the breakdown of the gluten network, a phenomenon recorded as a decrease in consistency. While 250
the amount of glutenin dictates gluten strength, gliadin to glutenin ratio is related to the maximum 251
time to peak (Melnyk et al 2012). 252
Interestingly, IWG was able to aggregate and generate a peak. On the contrary, very early studies 253
did not find any gluten forming ability in intermediate grass (Becker et al 1991). Research in our 254
laboratory has demonstrated that gluten free flours did not show any peak or aggregation 255
phenomenon when tested using the GlutoPeak (data not shown). However, gluten in IWG exhibited 256
a lower peak torque (19.2 ± 0.63 BE and 42.0 ± 0.99 BE, for IWG and HWF, respectively) and a 257
lower peak time (44.5 ± 2.2 s and 74.5 ± 3.4 s, for IWG and HWF, respectively), suggesting weaker 258
protein aggregation properties compared to HWF. Blending refined flour with IWG seemed to 259
affect torque more significantly rather than peak maximum time in agreement with previous work 260
on flour blending (Lu & Seetharaman, 2014). This result could be related to the differences in 261
Page 12 of 35

13
protein profile. According to Melynk et al (2012), glutenin fraction was more important in dictating 262
gluten strength (peak torque) with only small effect on peak maximum time. 263
Increasing the substitution levels of hard wheat flour with IWG led to a decrease in gluten peak 264
torque and a shorter gluten aggregation time. Peak maximum time is indicative of the time required 265
for gluten to aggregate and exhibit maximum torque on the spindle. The addition of IWG 266
significantly decreased this parameter (p<0.05). Adding IWG to wheat flour (50%) resulted in a 267
gluten aggregation profile similar to winter wheat varieties characterized by acceptable bread-268
making performances (data not shown). The effect of IWG enrichment was greater when IWG 269
made up 75% of the formula (31.0 ± 4.0s). A similar trend was also observed when materials such 270
as fiber or germ were added and resulted in the weakening of the gluten network (Goldstein et al 271
2010; Marti et al 2014). Previous studies demonstrated that replacing good quality gluten fractions 272
with those from a lower quality wheat variety decreased gluten quality. These cultivar specific 273
differences in gliadin and glutenin were important in dictating gluten strength (torque), and a lesser 274
effect was observed on peak maximum time (Melnyk et al 2012; Lu and Seetharaman 2014). 275
Interestingly, 50% IWG exhibited a torque value similar to that of HWF (42.9 ± 2.96 BE and 42.0 ± 276
0.99 BE for 50%IWG and HWF, respectively), suggesting that 50% IWG flour blend might have 277
the potential to be used for preparing baked-products without worsening flour performance in terms 278
of gluten aggregation. 279
Mixing Properties. The effects of incorporation of IWG on mixing characteristics were determined 280
by the farinographic test and shown in Fig. 6. Farinograph profiles are a critical indicator of flour 281
quality in various wheat-based product applications. In this study, all the dough samples were 282
prepared at constant water absorption (70%) that was optimal for HWF to reach 500 BU. The wheat 283
flour used for preparing the blends was a very strong flour with a very high dough development 284
Page 13 of 35

14
time (6 min) and a very high stability (14 min). The use of so strong a flour was driven by our goal 285
to prepare a dough containing a high level of IWG. 286
Adding IWG to the HWF significantly (p < 0.05) increased dough consistency likely due to the 287
higher levels of fiber in IWG (Table I). The peak torque values increased from 489 ± 8.5 BU 288
(refined wheat flour) to 780 ± 5.6, 850.5 ± 4.9, and 862.5 ± 10.6 BU, respectively for 50%, 75%, 289
and 100% IWG. Fiber-rich preparations are known for their ability to absorb considerable amounts 290
of water, leading to an increase in the mixing torque. That ability is mainly determined by the 291
presence of a large number of hydroxyl groups which enter into interactions with water via 292
hydrogen bonds (Rosell et al 2010). However, continuously increasing the substitution level of 293
IWG in blends did not result in significant increase in dough consistency. It seems that increment in 294
proportion of IWG flour does not affect the strength of the gluten network when 70% water 295
absorption was set for all the IWG blends. 296
Addition of increasing quantities of IWG significantly decreased (3-fold) the dough development 297
time (5.8 min for HWF and 1.85 min for IWG), which is likely explained by the dilution of gluten 298
fractions due to addition of the whole grain IWG and caused interference in the development of the 299
gluten network. However, no significant (p>0.05) differences were observed in the dough 300
development time as increasing the replacement of hard wheat flour with IWG flour (1.66, 1.75, 301
and 1.85 for 50%, 75%, and 100% IWG respectively). Interactions among HWF and IWG proteins 302
should be further investigated. According to Matsuo and Irvine (1970), some of the differences in 303
mixing properties could be attributed to protein content, while the differences in dough 304
development time and stability could be attributed to different types of gluten (Irvine et al 1961). 305
Addition of 50% and 75% IWG greatly affected dough stability during mixing, highlighting the 306
weakening effect of IWG addition on the rheological characteristics. Stability is known to be related 307
to the quality of the protein matrix, which is easily damaged by the addition of other ingredients, 308
Page 14 of 35

15
due to gluten dilution (Marti et al 2014). Interestingly, 100% IWG was more resistant to 309
consistency loss due to mixing compared to 50% or 75% IWG blends, as shown by the curve 310
profile. This is in agreement with the ability of fiber to assume a rigid conformation, improving the 311
strength of the dough (Peressini and Sensidoni 2009). However, the role of IWG proteins is unclear. 312
Indeed, previous studies on wheat flours indicated gluten protein from different wheats possess 313
different properties, replacing good quality gluten fractions with those from a lower quality wheat 314
decreases gluten quality (Melnyk et al 2012; Lu and Seetharaman 2014). 315
CONCLUSIONS 316
Functionality of intermediate wheatgrass substituted in wheat flour was studied using rheological 317
instruments. The overall results highlighted the ability of IWG protein to aggregate forming a 318
gluten-like network that was less strong than common wheat flour. This is related to the high 319
protein solubility of IWG. Despite the high level of thiol groups, these seem to not to be as available 320
for aggregating as in wheat. The 50% IWG-enrichment allows nutritional improvement of cereal-321
based products without dramatically changing starch pasting properties, gluten aggregation kinetics, 322
and protein characteristics. Future studies should focus on the suitability of IWG-blends to prepare 323
baked-products with nutritional functionality. 324
ACKNOWLEDGEMENTS 325
The Authors gratefully acknowledge Brabender CWB (South Hackensack, NJ, USA) for the use of 326
their analytical equipment. We would like to thank The Land Institute, Lee DeHaan in particular for 327
providing Kernza IWG for this project. The Authors also thank Professor Maria Ambrogina Pagani 328
(University of Milan) for critical reading of the manuscript. 329
LITERATURE CITED 330
Page 15 of 35

16
AACC International. Approved methods of analysis. AACC International: St. Paul, MN. 331
Becker, R., Meyer, D., Wagoner, P., and Saunders, R. M. 1992. Alternative crops for sustainable 332
agricultural systems. Agric. Ecosyst. Environ. 40:265-274. 333
Becker, R., Wagoner, P., Hanners, G.D., and Saunders, R. M. 1991. Compositional, Nutritional and 334
Functional-Evaluation of Intermediate Wheatgrass (Thinopyrum-Intermedium). J. Food 335
Process. Preserv. 15:63-77. 336
Bonomi, F., D’Egidio, M. G., Iametti, S., Marengo, M., Marti, A., Pagani, M. A., and Ragg, E. M. 337
2012. Structure-quality relationship in commercial pasta: a molecular glimpse. Food Chem. 338
135:348-355. 339
Bonomi, F., Iametti, S., Mamone, G., and Ferranti, P. 2013. The performing protein: beyond wheat 340
proteomics? Cereal Chem. 90:358-366. 341
Bunzel, M., Tyl, C. E., and Ismail, B. 2014. Chemical composition of intermediate wheatgrass. In: 342
American Association of Cereal Chemists Annual Meeting. Abstract 82-S. October 5-8, 2014. 343
Providence (RI). 344
Ciaffi, M., Tozzi, L., Borghi, B., Corbellini, M., and Lafiandra, D. 1996. Effect of heat shock 345
during grain filling on the gluten protein composition of bread wheat. J. Cereal Sci. 24:91-346
100. 347
Collar, C. 2003. Significance of viscosity profile of pasted and gelled formulated wheat doughs on 348
bread staling. Eur. Food Res. Technol. 216:505-513. 349
Collar, C., Santos, E., and Rosell, C. M. 2006. Significance of dietary fiber on the viscometric 350
pattern of pasted and gelled flour-fiber blends. Cereal Chem. 83:370-376. 351
Culman, S. W., Snapp, S. S., Ollenburger, M., Basso, B., and DeHaan, L. R. 2013. Soil and water 352
quality rapidly responds to the perennial grain Kernza wheatgrass. Agron. J. 105:735-744. 353
Page 16 of 35
17
Glover, J. D., Reganold, J. P., Bell, L. W., Borevitz, J., Brummer, E. C., Buckler, E. S., Cox, C. M., 354
Cox, T. S., Crews, T. E., Culman, S. W., DeHaan, L. R., Eriksson, D., Gill, B. S., Holland, 355
J., Hu, F., Hulke, B. S., Ibrahim, A. M., Jackson, W., Jones, S. S., Murray, S. C., Paterson, 356
A. H., Ploschuk, E., Sacks, E. J., Snapp, S., Tao, D., Van Tassel, D. L., Wade, L. J., Wyse, 357
D. L., and Xu Y. 2010. Increased food and ecosystem security via perennial grains. Science 358
328:1638-1639. 359
Goldstein, A., Ashrafi, L., and Seetharaman, K. 2010. Effects of cellulosic fibre on physical and 360
rheological properties of starch, gluten and wheat flour. Int. J. Food Sci. Tech. 45:1641-1646. 361
Hayes, R. C., Newell, M. T., DeHaan, L. R., Murphy, K. M., Crane, S., Norton, M. R., Wade, L. J., 362
Newberry, M., Fahim, M., Jones, S. S., Cox, T. S., and Larkin, P. J. 2012. Perennial cereal 363
crops: An initial evaluation of wheat derivatives. Field Crop. Res. 133:68-89. 364
Iametti, S., Bonomi, F., Pagani, M. A., Zardi, M., Casiraghi, M. C., and D'Egidio. M. G. 2006. 365
Properties of the protein and carbohydrate fractions in immature wheat kernels. J. Agr. Food 366
Chem. 54:10239-10244. 367
Iametti, S., Marengo, M., Miriani, M., Pagani, M. A., Marti, A., and Bonomi, F. 2013. Integrating 368
the information from proteomic approaches: a “thiolomics” approach to assess the role of 369
thiols in protein-based networks. Food Res. Int. 54:980-987. 370
Irvine, G. N., Bradley, J. W., and Martin, G. C. 1961. A farinograph technique for macaroni 371
doughs. Cereal Chem. 38:153-164. 372
Ji, Y., Zhu, K. X., Zhou, H. M., and Qian, H. F. 2010. Study of the retrogradation behaviour of rice 373
cake using rapid visco analyser, Fourier transform infrared spectroscopy and X-ray analysis. 374
Int. J. Food Sci. Tech. 45:871-876. 375
Kaur-Chandi, G., and Seetharaman, K. 2012. Optimization of gluten peak tester: a statistical 376
approach. J. Food Qual. 35, 69-75. 377
Page 17 of 35

18
Labuschagne, M. T., Geleta, N., and Osthoff, G. 2007. The inflcuence of environment on starch 378
content and amylose to amylopectin ratio in wheat. Starch 59:234-238. 379
Lu, Z., and Seetharaman, K., 2014. Suitability of Ontario grown hard and soft wheat flour blends 380
for noodle-making. Cereal Chem. 91:482-488. 381
Marti, A., Fongaro, L., Rossi, M., Lucisano, M., and Pagani, M.,A. 2011. Quality characteristics of 382
pasta enriched with buckwheat flour. Int. J. Food Sci. Tech. 46:2393-2400. 383
Marti, A., Seetharaman, K., and Pagani, M. A. 2013. Rheological approaches suitable for 384
investigating starch and protein properties related to cooking quality of durum wheat pasta. J. 385
Food Qual. 36:133-138. 386
Marti, A., Torri, L., Casiraghi, M. C., Franzetti, L., Limbo, S., Morandin, F., Quaglia, L., and 387
Pagani, M. A. 2014. Wheat germ stabilization by heat-treatment or sourdough fermentation: 388
effect on dough rheology and bread properties. Food Sci. Technol.-LEB 59:1100-1106. 389
Matsuo, R. R., and Irvine, G. N. 1970. Effect of gluten on cooking quality of spaghetti. Cereal 390
Chem. 47:173-180. 391
Melnyk, J. P., Dreisoerner, J., Marcone, M. F., and Seetharaman, K. 2012. Using the Gluten Peak 392
Tester as a tool to measure physical properties of gluten. J. Cereal Sci. 56:561-567. 393
Morel, M. H., Redl, A., and Guilbert, S. 2002. Mechanism of heat and shear mediated aggregation 394
of wheat gluten upon mixing. Biomacromolecules 3:488-497. 395
Peressini, D., and Sensidoni, A. 2009. Effect of soluble dietary fibre addition on rheological and 396
breadmaking properties of wheat doughs. J. Cereal Sci. 49:190-201. 397
Rosell, C. M., Santos, E., and Collar, C. 2010. Physical characterization of fiber-enriched bread by 398
dual mixing and temperature constraint using the Mixolab. Eur. Food Res. Technol. 231:535-399
544. 400
Page 18 of 35

19
Schoenfuss, T., Seetharaman, K., and Peterson, D. G. 2014. Incorporation of Intermediate wheat 401
grass in food products. American Association of Cereal Chemists Annual Meeting. Abstract 402
83-S. October 5-8, 2014. Providence (RI). 403
Shewry, P. R., and Tatham, A. S. 1997. Disulphide bonds in wheat gluten proteins. J. Cereal Sci. 404
25:207-227. 405
Singh, N., Singh, J., Kaur, L., Sodhi, S. N., and Gill, S. B. 2003. Morphological, thermal and 406
rheological properties of starches from different botanical sources. Food Chem. 81:219-231. 407
USDA, USDA national nutrient database for standard reference. http://ndb.nal.usda.gov Accessed 408
Jan. 12, 2015. 409
Vogel, K. P., and Jensen, K. J. 2001. Adaptation of perennial triticeae to the eastern Central Great 410
Plains. J. Range Manage. 54:674-697. 411
Wagoner, P., and Schauer, A. 1990. Intermediate wheatgrass as a perennial grain crop. Pages 143-412
145 in: Advances in New Crops. J. Janick and J. E. Simon, eds. Timber Press: Portland. 413
Page 19 of 35

20
Figure Legends 414
Fig. 1. Microscope images of refined wheat flour (a, c) and IWG (b, d) taken under unpolarized (a, 415
b) and polarized (b, c) light. 416
Fig. 2. Pasting properties of HWF and IWG blends using a Micro-Visco Amylograph (C. W. 417
Brabender Instruments, South Hackensack, NJ). Fifteen grams of sample (14% moisture) dispersed 418
in 100 mL of distilled water and stirred at 250 rpm. 419
Fig. 3. Amount of protein solubilized in 1 mL of buffer after a 60 min. incubation followed by 420
centrifugation. Buffer = 0.05 M sodium phosphate buffer (pH 6.8); SDS = 2.0% sodium dodecyl 421
sulfate (SDS) added; DTT = 0.01 mol L-1
dithiothreitol (DTT). 422
Fig. 4. Accessible and total protein thiols. Accessible thiols determined following the method 423
described by Iametti et al (2006), and total thiols measured by the same method with the addition of 424
1% SDS. 425
Fig. 5. Gluten aggregation properties of hard wheat flour and intermediate wheatgrass blends using 426
the GlutoPeak (C.W. Brabender Inc., South Hackensack, NJ, USA). 8.5g of sample (14% moisture) 427
dispersed in 9.5 mL of 0.5M CaCl2 and mixed at 1900 rpm and 34°C. 428
Fig. 6. Mixing profile of hard wheat flour and intermediate wheatgrass blends using a Farinograph-429
AT (C.W. Brabender Inc., South Hackensack, NJ, USA). 430
431
Page 20 of 35

21
Table I 432
Composition traits of refined wheat flour, whole wheat flour, and intermediate wheatgrass. 433
Values expressed as g/100g sample d.b. 434
Refined wheat
flour Intermediate wheatgrass Whole wheat flour
4
Starch1 73.9 ± 0.4 46.7 ± 0.8 72.0
Protein2 15.0 ± 0.08 20.0 ± 0.3 13.2
Total Dietary Fiber3 2.57 ± 0.13 16.87 ± 0.36 10.7
Insoluble Dietary Fiber 1.68 ± 0.08 13.58 ± 0.08 -
Soluble Dietary Fiber 0.89 ± 0.05 3.29 ± 0.28 -
means n=3; ± = standard deviation 435
1 Measured by AACC method 76-13 436
2 Measured by AACC method 46-30.01 437
3 Measured by AACC method 32-07.01 438
4 Data from http://ndb.nal.usda.gov 439
440
Page 21 of 35

22
Table II 441
Pasting properties of hard wheat flour (HWF) and intermediate wheatgrass (IWG) blends1 442
HWF 50% IWG 75% IWG IWG
Pasting Temperature (°C)2 61.0 ± 0.2a
3 63.5 ± 0.4b 64.1 ± 0.4b 65.2 ± 0.3c
Peak viscosity (BU)4 500 ± 11a 363 ± 9b 308 ± 7c 257 ± 4d
Peak Temperature (°C)5 85 ± 0a 89 ± 0b 92 ± 0c 97 ± 1d
Breakdown (BU)6 310 ± 7a 147 ± 2b 76 ± 5c 35 ± 3d
Final viscosity (BU) 739 ± 26a 692 ± 43ab 649 ± 12b 504 ± 4c
Setback (BU)7
548 ± 23a 476 ± 36b 416 ± 12c 282 ± 3d
443
1Measured on a Micro-Visco Amylograph (C. W. Brabender Instruments, South Hackensack, NJ). 444
15g of sample flour (14% moisture) dispersed in 100 mL of distilled water and stirred at 250 rpm. 445
Profile 30°C for 3 min, heating from 30 °C to 95 °C at ramp rate of 7.5 °C/min, hold at 95 °C for 5 446
min, cooling to 30 °C at a rate of 7.5 °C/min, and holding for 2 min. 447
2 Temperature at which an initial increase in viscosity occurs. 448
3 Means (n=3) followed by standard deviation with a different letter for each index are significantly 449
different (p<0.05). 450
4 Maximum viscosity achieved during the heating cycle. 451
5 Temperature at the maximum viscosity. 452
6 Difference between the peak viscosity and the viscosity after the holding period at 95 °C. 453
7 Difference between the viscosity at 30 °C and the viscosity reached after the first holding period. 454
Page 22 of 35

23
455
456
Page 23 of 35

24
457
458
Page 24 of 35

25
459
c
Page 25 of 35

26
460
Fig. 1. 461
d
Page 26 of 35

27
462
Fig. 2. 463
464
Page 27 of 35

28
465
Fig. 3. 466
Page 28 of 35

29
467
Fig. 4. 468
Page 29 of 35

30
469
Fig 5. 470
471
Page 30 of 35

31
472
Fig. 6. 473
Page 31 of 35

863x677mm (72 x 72 DPI)
Page 32 of 35

863x677mm (72 x 72 DPI)
Page 33 of 35
863x677mm (72 x 72 DPI)
Page 34 of 35

863x677mm (72 x 72 DPI)
Page 35 of 35