1 chapter 4: creating simple queries 4.1 introduction to querying data 4.2 filtering and sorting...
TRANSCRIPT

1
Chapter 4: Creating Simple Queries
4.1 Introduction to Querying Data
4.2 Filtering and Sorting Data
4.3 Creating New Columns with an Expression
4.4 Grouping and Summarizing Data in a Query
4.5 Joining Tables
4.6 Joining Tables Including Nonmatching Rows (Self-Study)
4.7 Creating New Columns by Recoding Values (Self-Study)
2
Chapter 4: Creating Simple Queries
4.1 Introduction to Querying Data4.1 Introduction to Querying Data
4.2 Filtering and Sorting Data
4.3 Creating New Columns with an Expression
4.4 Grouping and Summarizing Data in a Query
4.5 Joining Tables
4.6 Joining Tables Including Nonmatching Rows (Self-Study)
4.7 Creating New Columns by Recoding Values (Self-Study)

3
Objectives State the function of the Filter and Sort task
and the Query Builder. Compare the functionality available in each task.

4
Filter and Sort Task and the Query BuilderThe Filter and Sort task and the Query Builder can be used to create a new data source from one or more tables according to the criteria specified by the user.

5
6
4.01 Multiple Answer PollDouble-click on any data source in your project. Select Filter and Sort and explore the available tabs. What functionality do you think is supported by this task?
a. Subsetting rows
b. Selecting columns
c. Calculating new columns
d. Controlling the sort order of the rows
e. Summarizing data
f. Create a SAS data set
7
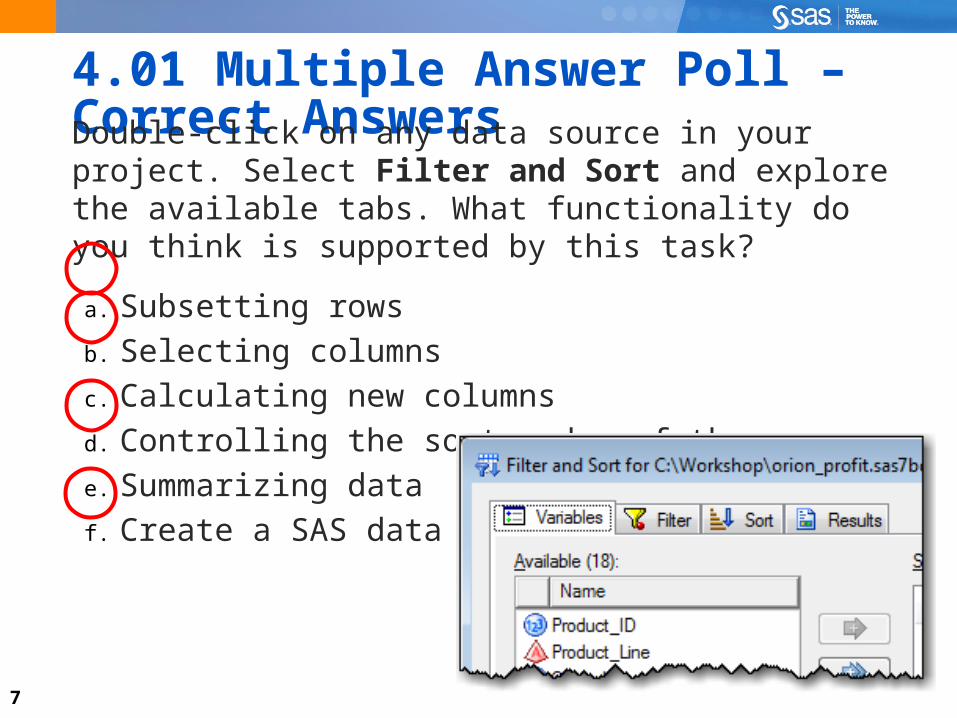
4.01 Multiple Answer Poll – Correct AnswersDouble-click on any data source in your project. Select Filter and Sort and explore the available tabs. What functionality do you think is supported by this task?
a. Subsetting rows
b. Selecting columns
c. Calculating new columns
d. Controlling the sort order of the rows
e. Summarizing data
f. Create a SAS data set

8
Filter and Sort TaskThe Filter and Sort task enables you to create a new SAS table by selecting rows, columns, and a sort sequence.

9

10
4.02 QuizClose the Filter and Sort task and return to the data grid. Select Query Builder. What options appear to be available that are not present in the Filter and Sort task?

11
4.02 Quiz – Correct AnswerClose the Filter and Sort task and return to the data grid. Select Query Builder. What options appear to be available that are not present in the Filter and Sort task?
Possible answers: Query name, Output name, Computed Columns, Prompt Manager, Tools, Options, Add Tables, Join Tables

12
Query BuilderThe Query Builder enables you to create a new SAS table by selecting rows, columns, and a sort sequence. It also enables computing new columns, joining tables, grouping, summarizing, and modifying column attributes.

13
Filter and Sort Task versus the Query Builder Filter and Sort Query Builder
Sort data Yes Yes
Filter rows and columns Yes Yes
Create a new SAS data set Yes Yes
Define new columns No Yes
Join tables No Yes
Group and summarize data No Yes
Define column attributes No Yes
Remove duplicates No Yes

14
Chapter 4: Creating Simple Queries
4.1 Introduction to Querying Data
4.2 Filtering and Sorting Data4.2 Filtering and Sorting Data
4.3 Creating New Columns with an Expression
4.4 Grouping and Summarizing Data in a Query
4.5 Joining Tables
4.6 Joining Tables Including Nonmatching Rows (Self-Study)
4.7 Creating New Columns by Recoding Values (Self-Study)

15
Objectives Apply a filter in a query. Exclude columns in a query. Reorder rows in a query.

16
Business ScenarioOrion Star wants to analyze Internet sales since 2008. To prepare the data for input to the various analytic tasks, the company must generate a new data source from the orders table, including only those Internet orders placed on or after 01JAN2008.
Internet Orders(Order_Type =3)

17
Filter and Sort TaskThe Variables, Filter, and Sort tabs in the Filter and Sort task provide functionality to select rows and columns in a designated sort order.

18
Filter and Sort: FilterSimple filters can be built using variable names, operators, and data values. Select Advanced Edit… to build more complex filters.

19
Advanced Filter BuilderThe Advanced Filter Builder provides access to advanced operators and SAS functions to create more complex rules for extracting rows.

20
Filter and Sort: Sort and ResultsYou can sort by multiple variables, and designate either ascending or descending sequence. You can also name the task and output table.

21
Query BuilderThe Query Builder provides similar tabs for selecting columns, filtering rows, and sorting data. Additional functionality is available, including the following: modifying column
properties grouping and
summarizing data applying formats selecting distinct
rows joining tables

22
Using Query Results in TasksData sources generated from queries can serve as the input data for follow-up tasks.

23
Selecting Columns and Filtering Rows

24

25
Exercise
This exercise reinforces the concepts discussed previously.

26

27
Chapter 4: Creating Simple Queries
4.1 Introduction to Querying Data
4.2 Filtering and Sorting Data
4.3 Creating New Columns with an Expression4.3 Creating New Columns with an Expression
4.4 Grouping and Summarizing Data in a Query
4.5 Joining Tables
4.6 Joining Tables Including Nonmatching Rows (Self-Study)
4.7 Creating New Columns by Recoding Values (Self-Study)

28
Objectives Define a new column of data in a query by building
an expression.

29
Business ScenarioOrion Star wants to analyze shipment methods by determining how many days elapse between each order date and delivery date. The company also wants to calculate the total amount invoiced to the customer, which is the sum of total retail price and shipping charges.
Delivery_Date - Order_Date
SUM(Total_Retail_Price, Shipping)

30
Computed ColumnsNew summarized columns, recoded columns, or columns based on an expression can be added to a query in the Query Builder.
Select to begin creatinga new column.

31
New Computed Column WizardA wizard guides you through the process of creating the new column and assigning attributes such as the column name, label, and format.

32
Expression EditorThe Expression Editor enables you to build expressions based on variables, operators, and functions.

33
SAS Functions
Example:
A SAS function is a routine that returns a value that is determined from specified arguments.
General form of a SAS function:
function-name(argument1,argument2, . . .)function-name(argument1,argument2, . . .)
sum(Salary,Bonus)

34
Using SAS FunctionsSAS functions can do the following: perform arithmetic operations compute sample statistics (for example, sum, mean,
and standard deviation) manipulate SAS dates process character values perform many other tasks
Sample statistics functions ignore missing values.

35

36
4.03 Multiple Choice PollWhat is the result of the expression given the values of Var1, Var2, and Var3?
a. . (missing)
b. 3
c. 9
d. 12
Var1+Var2+Var3
Var1 Var2 Var39 . 3

37
4.03 Multiple Choice Poll – Correct AnswerWhat is the result of the expression given the values of Var1, Var2, and Var3?
a. . (missing)
b. 3
c. 9
d. 12
Var1 Var2 Var39 . 3
Var1+Var2+Var3

38
4.04 Multiple Choice PollWhat is the result of the expression given the values of Var1, Var2, and Var3?
a. . (missing)
b. 3
c. 9
d. 12
sum(Var1,Var2,Var3)
Var1 Var2 Var39 . 3

39
4.04 Multiple Choice Poll – Correct AnswerWhat is the result of the expression given the values of Var1, Var2, and Var3?
a. . (missing)
b. 3
c. 9
d. 12
sum(Var1,Var2,Var3)
Var1 Var2 Var39 . 3

40
Computed ColumnsComputed columns appear in the left pane and can be used in a filter, for sorting, or as an input to another computed column.

41
Creating a Column with an Expression
This demonstration illustrates using the Computed Column wizard to define new columns based on advanced expressions.
SUM(Total_Retail_Price, Shipping)
Delivery_Date - Order_Date

42

43
Exercise
This exercise reinforces the concepts discussed previously.

44

45
Chapter 4: Creating Simple Queries
4.1 Introduction to Querying Data
4.2 Filtering and Sorting Data
4.3 Creating New Columns with an Expression
4.4 Grouping and Summarizing Data in a Query4.4 Grouping and Summarizing Data in a Query
4.5 Joining Tables
4.6 Joining Tables Including Nonmatching Rows (Self-Study)
4.7 Creating New Columns by Recoding Values (Self-Study)

46
Objectives Assign a grouping variable in a query. Select the analysis variable and the summary statistic
to compute. Filter grouped data.

47
Business ScenarioOrion Star wants to offer a sales promotion that highlights the most lucrative products. The company would like a list of all products with a total profit that exceeds $500.

48
Grouping DataThe Query Builder canbe used to group and summarize data.

49
Grouping DataData can be grouped and summarized using the Select Data tab.
Choose a statisticfor columns tobe summarized.
Columns without an assignedstatistic will automaticallydefine the groups.

50
Grouping by Column ValuesThe query result includes one row for every unique value of the group column(s) and a calculated statistic for the summarized column(s).

51

52
4.05 Quiz1. Open the Query Builder and use any data source
in the current project.
2. Click the Filter Data tab and notice the layout.
3. Return to the Select Data tab and add any two columns.
4. For one of the columns in the Select Data tab, select Count in the Summary field.
5. Return to the Filter Data tab.
How does the Filter Data tab change after a query includes grouped data?
53
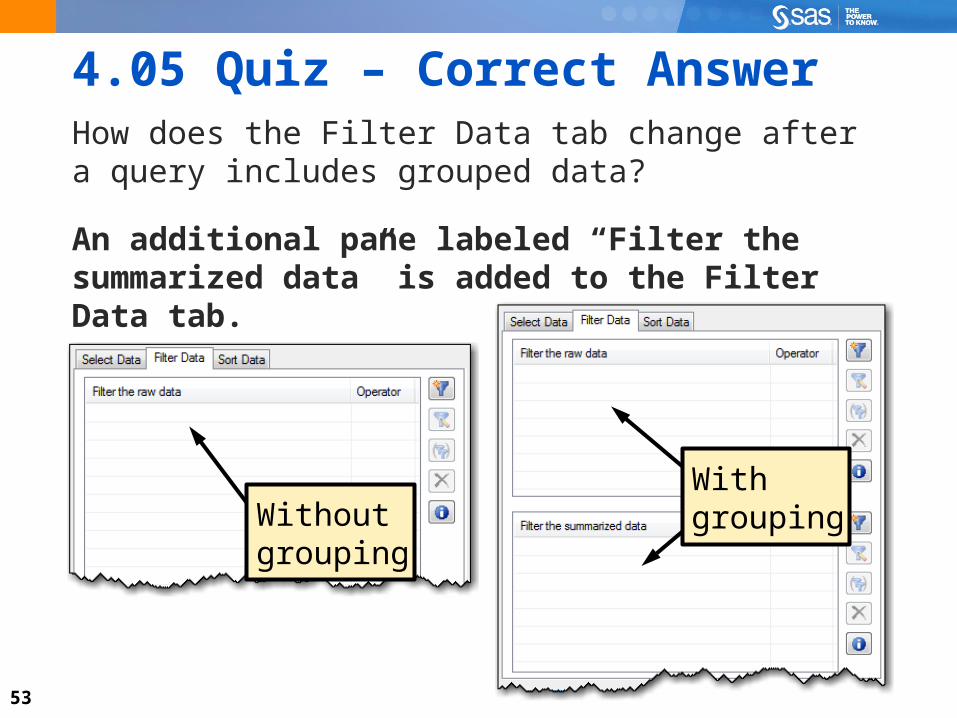
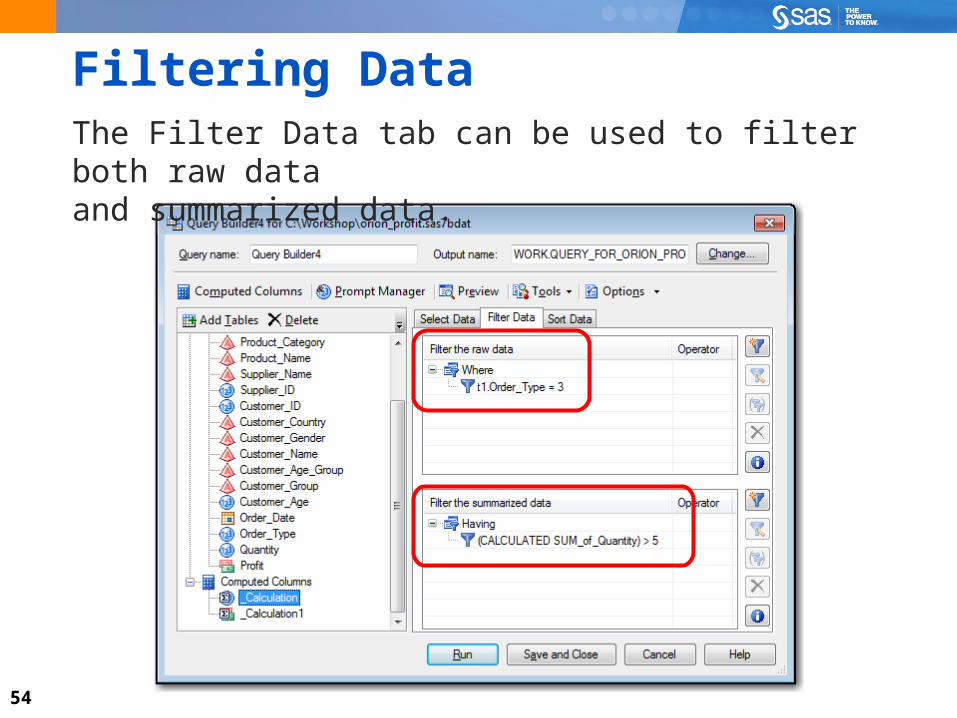
4.05 Quiz – Correct AnswerHow does the Filter Data tab change after a query includes grouped data?
An additional pane labeled “Filter the summarized data” is added to the Filter Data tab.
WithgroupingWithout
grouping
54
Filtering DataThe Filter Data tab can be used to filter both raw data and summarized data.

55
Summarizing and Filtering by Groups
This demonstration illustrates grouping, summarizing, andfiltering grouped data.

56

57
Exercise
This exercise reinforces the concepts discussed previously.

58

59
Chapter 4: Creating Simple Queries
4.1 Introduction to Querying Data
4.2 Filtering and Sorting Data
4.3 Creating New Columns with an Expression
4.4 Grouping and Summarizing Data in a Query
4.5 Joining Tables4.5 Joining Tables
4.6 Joining Tables Including Nonmatching Rows (Self-Study)
4.7 Creating New Columns by Recoding Values (Self-Study)

60
Objectives Join multiple tables by common columns. Include only matching rows.

61
Business ScenarioIn a previous query, products with total profits exceeding $500 were identified. Analysts asked for more details about these top products, including the product category, the product, supplier, and country name. The columns to include come from three different tables.
topproducts products Country_lookup

62
Business ScenarioTo include the necessary columns, the topproducts SAS table must be joined with the products SAS table and the country_lookup Excel spreadsheet.

63
Joining TablesJoining tables enables you to extract and simultaneously process data from more than one table.

64
Joining TablesBy default, the Query Builder includes matching rows only in the results.

65

66
4.06 Multiple Answer PollWhich customers will be returned by the Query Builder if these tables are combined using the default join type?
a. Smith, John (00001)
b. Anderson, Tim (00002)
c. Jones, Betsy (00003)
d. Customer 00004
e. Rigsbee, Marilyn (00005)
67
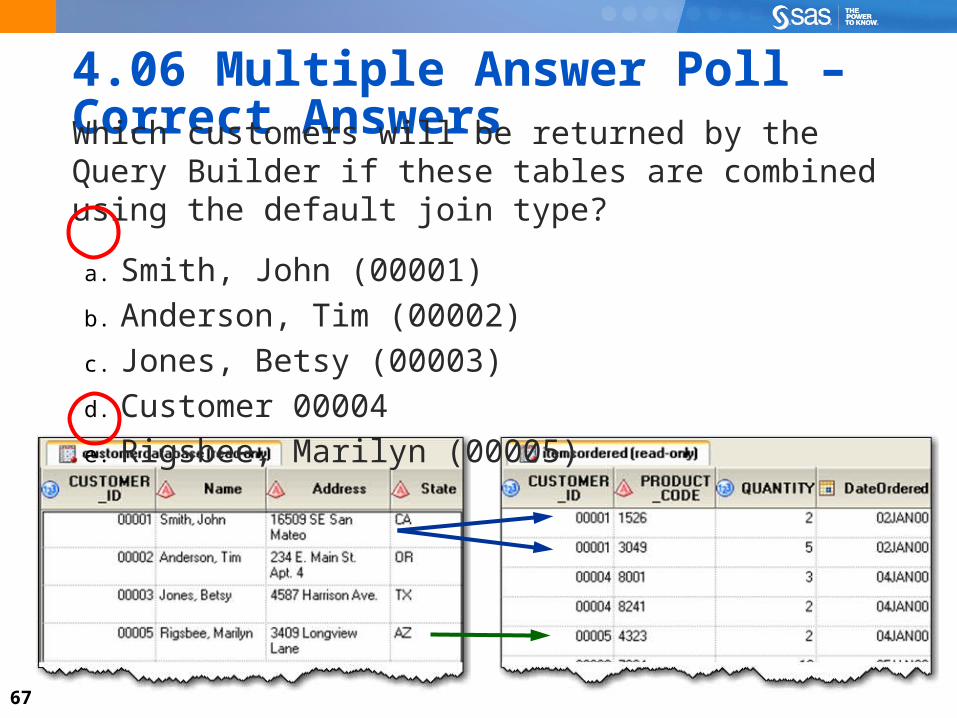
4.06 Multiple Answer Poll – Correct AnswersWhich customers will be returned by the Query Builder if these tables are combined using the default join type?
a. Smith, John (00001)
b. Anderson, Tim (00002)
c. Jones, Betsy (00003)
d. Customer 00004
e. Rigsbee, Marilyn (00005)

68
Tables and Joins WindowSelect Join Tables to access the Tables and Joins window. This window enables you to add additional tables and verify or change the criteria used to join tables.

69
Join PropertiesThe Join Properties window provides the ability to modify the join type or condition. Selecting a different join type can be used to identify or eliminate nonmatching rows.

70
Query OptionsSelect Options to customize the query, including the type of result produced, query limits, and the SAS server that will execute the query.

71

72
Setup for the Poll1. Right-click on any data source in the project and select
Query Builder….
2. Select Options Server and carefully read the warning regarding the SAS server for the query.

73
4.07 Multiple Choice PollAssume that you have SAS on both your local machine and a remote server. If you want to join an Excel spreadsheet on your PC with a large table on the server, what should you do?
a. Nothing. Allow SAS Enterprise Guide to choose where to process the query.
b. Modify the query options to force the query to process on the local server.
c. Modify the query options to force the query to process on your remote SAS Server.

74
4.07 Multiple Choice Poll – Correct AnswerAssume that you have SAS on both your local machine and a remote server. If you want to join an Excel spreadsheet on your PC with a large table on the server, what should you do?
a. Nothing. Allow SAS Enterprise Guide to choose where to process the query.
b. Modify the query options to force the query to process on the local server.
c. Modify the query options to force the query to process on your remote SAS Server.

75
Join ResultsWhen joining tables in the Query Builder, you can also filter or sort on any of the columns from the input tables, as well as compute new columns, or group and summarize.

76
Joining Tables
This demonstration illustrates how to join multiple tables and store the result in a data table.

77

78
Exercise
This exercise reinforces the concepts discussed previously.

79

80
Chapter 4: Creating Simple Queries
4.1 Introduction to Querying Data
4.2 Filtering and Sorting Data
4.3 Creating New Columns with an Expression
4.4 Grouping and Summarizing Data in a Query
4.5 Joining Tables
4.6 Joining Tables Including Nonmatching Rows 4.6 Joining Tables Including Nonmatching Rows (Self-Study)(Self-Study)
4.7 Creating New Columns by Recoding Values (Self-Study)

81
Objectives Perform different join types.

82
Business ScenarioIn an effort to improve customer retention, the Marketing Department at Orion Star would like to identify those customers in the database that did not place a recent order.

83
Joining TablesTypes of Joins: Matching Rows Only (SAS Enterprise Guide default)
– produces results where only the rows from onetable that have a corresponding match in every other table are returned.
All Rows from one or both tables
– produces results where all of the matched rows from both tables and the unmatched rows from at least one table are returned.
All Rows from A All Rows from A and B All Rows from B
A B A B A B

84
Review: Matching Rows Only

85
Including Nonmatching Rows All rows from customerdatabase and itemsordered

86
All rows from customerdatabase
Including Nonmatching Rows

87
Including Nonmatching Rows All rows from itemsordered

88
Join Properties (Review)The Join Properties include the ability to modify the join type or condition. Selecting a different join type can be used to identify or eliminate nonmatching rows.

89
Isolating Nonmatching RowsThe query can also include a filter to isolate the nonmatching rows from one or both tables.
Customers in the CustomerDatabase table who have not placed orders
Filter to include only rows where Customer_ID is missing from the orders table

90

91
4.08 Multiple Choice PollWhich would be the most appropriate join type to begin to isolate those orders placed on products that are no longer included in the products table?
a. Matching rows only
b. All rows from products
c. All rows from orders
d. All rows from products and orders

92
4.08 Multiple Choice Poll – Correct AnswerWhich would be the most appropriate join type to begin to isolate those orders placed on products that are no longer included in the products table?
a. Matching rows only
b. All rows from products
c. All rows from orders
d. All rows from products and orders

93
Joining Tables Including Nonmatching Rows
This demonstration illustrates how to change the join type to include nonmatching rows in a query.

94

95
Exercise
This exercise reinforces the concepts discussed previously.

96

97
Chapter 4: Creating Simple Queries
4.1 Introduction to Querying Data
4.2 Filtering and Sorting Data
4.3 Creating New Columns with an Expression
4.4 Grouping and Summarizing Data in a Query
4.5 Joining Tables
4.6 Joining Tables Including Nonmatching Rows (Self-Study)
4.7 Creating New Columns by Recoding Values 4.7 Creating New Columns by Recoding Values (Self-Study)(Self-Study)

98
Objectives Recode individual values or a range of values
in a column.

99
Business ScenarioTo further analyze profit per order, management would like to categorize each order in the following ranges: $0 to $100 $100 to $500 $500 and Above

100
Recoded Columns New columns can also be derived by recoding values from an existing column.

101
Recoded ValuesRecoding a column enables you to assign a value to a new column based on the value of an existing column.
When Order_Type=1Then
Order_Type_Detail= 'Retail Sale'
TRUE
TRUE
TRUEWhen Order_Type=3
FALSE
When Order_Type=2
FALSE
Then Order_Type_Detail
= 'Catalog Sale'
Then Order_Type_Detail
= 'Internet Sale'

102

103
4.09 QuizWhat should be assigned to the new column if Order_Type = 999?
???

104
4.09 Quiz – Correct AnswerWhat should be assigned to the new column if Order_Type = 999?
Possible answers:
Assign a missing value.
Assign ‘999’.
Assign ‘Other’.
???

105
Recode a ColumnThe New Computed Column wizard provides an option for recoding the values of an existing column in the input table.

106
Specify a ReplacementThe wizard enables you to specify replacements based on distinct values, ranges, or conditions.
Select the new columntype before you definereplacement values.
Determine a value for datanot assigned a replacement.

107
Creating a New Column by Recoding Values
This demonstration illustrates the use of the Recoding Values in a query to create a new column based conditionally on an existing column.

108

109
Chapter Review1. Name at least three tasks that you can do in the Query
Builder that you cannot do in the Filter and Sort task.
2. Can you filter or sort on a calculated column?
3. What is the default join type?
110
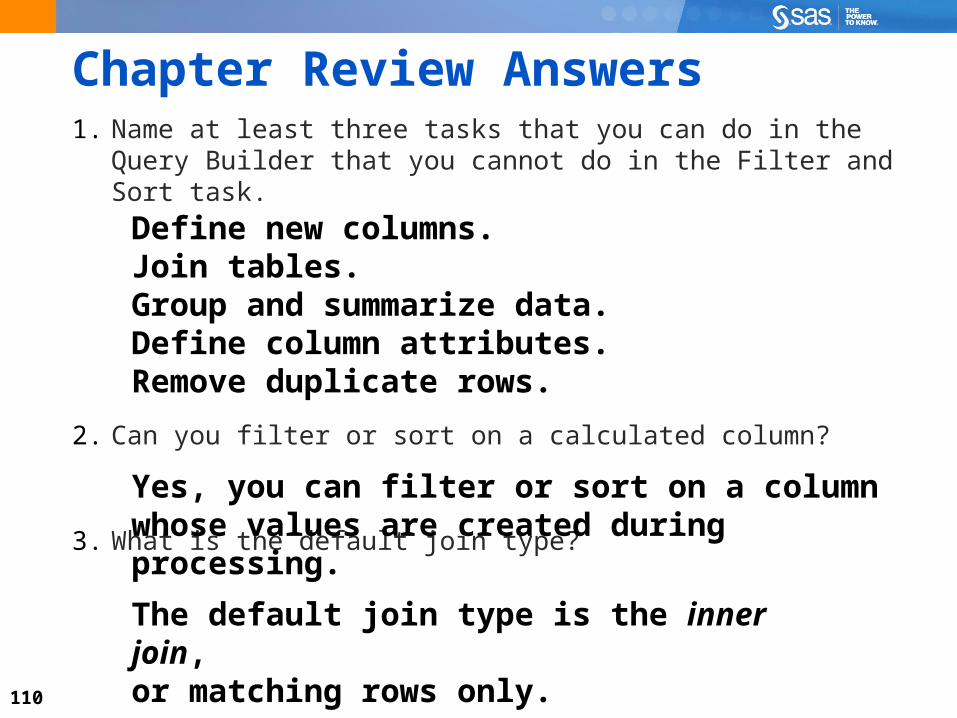
Chapter Review Answers1. Name at least three tasks that you can do in the Query
Builder that you cannot do in the Filter and Sort task.
2. Can you filter or sort on a calculated column?
3. What is the default join type?
Yes, you can filter or sort on a column whose values are created during processing.
The default join type is the inner join, or matching rows only.
Define new columns.Join tables.Group and summarize data.Define column attributes.Remove duplicate rows.