1 bi-site catalysis in f1-atpase: does it exist? joachim weber and
TRANSCRIPT
1
Bi-Site Catalysis in F1-ATPase: Does It Exist?
Joachim Weber and Alan E. Senior
University of Rochester Medical Center,
Department of Biochemistry and Biophysics, Box 712
Rochester, NY 14642
Running Title: Bi-Site Catalysis in F1-ATPase?
Contact information: Alan E. Senior, Phone 716-275-6645; FAX 716-271-2683;
e-mail, [email protected]
Supported by: NIH grant GM25349 to AES.
Copyright 2001 by The American Society for Biochemistry and Molecular Biology, Inc.
JBC Papers in Press. Published on July 12, 2001 as Manuscript M104946200 by guest on M
arch 14, 2018http://w
ww
.jbc.org/D
ownloaded from
2
FOOTNOTES
Footnote 1. Kd values and enzyme species distribution determined here are based on the
assumption of three different, independent sites. This is the most likely scenario in F1-ATPase,
where postioning of γ subunit likely determines binding affinity at each site, thus we believe our
approach is well-supported. However, cooperativity in binding of nucleotides could, in theory,
affect calculation of relative distributions of enzyme species. For example, binding at site one
might reduce the affinity at sites two and/or three. Klotz and Hunston, and others (42,43), have
developed a "stoichiometric formulation" to deal with such cases, in which "stoichiometric
constants" are used to describe ligand binding, without any assumption of a specific binding
model. This approach allows differentitation only between enzyme species with zero, one, two
or three filled catalytic sites, i.e. species 100, 010 and 001 are lumped together, as are 110, 101
and 011. When we applied this approach, we found stoichiometric dissociation constants very
close to the Kd values given in Table 1. The resulting calculated enzyme species distributions
were very similar to those for 000, 100, 110 and 111 in Figs. 3-5. While we cannot estimate
individual activites of species 110 or 101 by this approach, we can state with confidence that the
sum of their activities is ≤ 0.15% of Vmax. (Species 100, 010, 001, and 011 may be ignored,
because of negliglible activity and/or very low frequency). Therefore the major conclusions of
this paper are not affected by cooperativity in the nucleotide binding parameters.
Footnote 2. E. coli cells in vivo , under anaerobic conditions, use F1Fo-ATP synthase to
hydrolyse MgATP to generate their membrane potential. Thus MgADP inhibition would be
physiologically debilitating, and its absence is expected. In contrast, in mitochondria,
by guest on March 14, 2018
http://ww
w.jbc.org/
Dow
nloaded from
3
chloroplasts, and Bacillus PS3 (which does not grow anaerobically), ATP synthesis is the only
physiological role of F1Fo-ATP synthase, and MgADP inhibition, which has been seen in these
species, could be beneficial.
Footnote 3. Recently, a revised bi-site mechanism tried to overcome the problem by suggesting
a hydrolysis sequence paralleling that shown in Fig. 6C (38). This, however, only shifts the
problem to the synthesis direction, where ADP and Pi bind to the low affinity site three while
leaving the medium affinity site two empty (38).
by guest on March 14, 2018
http://ww
w.jbc.org/
Dow
nloaded from
4
ABSTRACT
The mechanism of action of F1Fo-ATP synthase is controversial. Some favor a tri-site
mechanism, where substrate must fill all three catalytic sites for activity, others a bi-site
mechanism, where one of the three sites is always unoccupied. New approaches were applied to
examine this question. First, ITP was used as hydrolysis substrate; lower binding affinities of
ITP versus ATP enable more accurate assessment of sites occupancy. Second, distributions of
all eight possible enzyme species (with zero, one, two or three sites filled) as fraction of total
enzyme population at each ITP concentration were calculated, and compared with measured
ITPase activity. Confirming data were obtained with ATP as substrate. Third, we performed a
theoretical analysis of possible bi-site mechanisms. The results argue convincingly that bi-site
hydrolysis activity is negligible, and may not even exist. Effectively, tri-site hydrolysis is the
only mechanism. We argue that only tri-site hydrolysis drives subunit rotation. Theoretical
analyses of possible bi-site mechanisms reveal serious flaws, not previously recognized. One is
that, in bi-site catalysis, the predicted direction of subunit rotation is the same for both ATP
synthesis and hydrolysis; a second is that infrequently-occurring enzyme species are required.
by guest on March 14, 2018
http://ww
w.jbc.org/
Dow
nloaded from
5
INTRODUCTION
F1 is the catalytic sector of ATP synthase, the enzyme that synthesizes ATP in the last
step of oxidative phosphorylation (for reviews, see Refs 1,2; short reviews on individual topics
can be found in Refs 3-5). F1 has a subunit composition of α3β3γδε. The three catalytic
nucleotide binding sites are located at α/β interfaces, mainly on the β subunits (6). F1 can be
isolated in soluble form and is an active ATPase. It is frequently used as a model for catalysis by
the holoenzyme ATP synthase (also called F1Fo).
F1 (and F1Fo) can hydrolyze MgATP in different modes, depending on the substrate
concentration. Two of these modes are clearly established and well-characterized. At low,
substoichiometric MgATP concentrations the enzyme binds MgATP with very high affinity, just
to catalytic site one. A single turnover of MgATP hydrolysis ensues on this site, called “uni-site
catalysis”, in which the chemical hydrolysis step is slow (0.1 s-1 in E. coli F1, Ref. 1) and
products release is even slower (0.001 s-1). On the other hand, at cellular (millimolar) substrate
concentrations, all three catalytic sites are filled and interact with each other, and the enzyme
turns over rapidly (~100 s-1). This “tri-site” or “multi-site catalysis” is the physiologically
relevant working mode of the enzyme (1). In multi-site catalysis, MgATP hydrolysis on the β
subunits drives rotation of the γεc ensemble (7-9), possibly transmitted via α subunits (10). In
contrast, uni-site catalysis can occur without subunit rotation (11).
The contribution to hydrolysis of enzyme molecules with two substrate-filled catalytic
sites ("bi-site catalysis") remains enigmatic. Originally, deviations from simple Michaelis-
Menten kinetics (single KM), where models with two KM values gave a better fit, were often
interpreted as indication for the coexistence of bi-site (lower KM) and tri-site (higher KM)
by guest on March 14, 2018
http://ww
w.jbc.org/
Dow
nloaded from
6
catalysis. However, there are a number of reasons (1,12-14) why reliance on enzyme kinetics
alone to infer catalytic sites occupancy might lead to erroneous results in this enzyme with its
three, interconverting catalytic sites. A breakthrough came in the form of an Escherichia coli F1
mutant (βY331W) where a Trp introduced into the adenine-binding pocket could be used to
directly monitor nucleotide occupancy of the catalytic sites. By comparing the MgATP
concentration dependence of nucleotide binding and hydrolytic activity in βY331W F1, we were
able to determine that steady-state hydrolytic activity was at least largely due to enzyme
molecules with all three catalytic sites occupied (1,12). In a number of analyses using this
method, the contribution of bi-site catalysis was estimated to be between 0 and 5 % of Vmax
(12,15,16).
If bi-site catalysis were a true working mode of F1 and could serve as an experimental
model for multi-site catalysis, it would clearly facilitate analysis of the enzymatic mechanism,
particularly rotation. Thus, we decided to re-address the question of the extent of bi-site
catalysis, putting emphasis on analyses in the substrate concentration range where enzyme
species with two sites filled are most prevalent. A prerequisite for this analysis is the exact
knowledge of substrate binding affinities of the three catalytic sites, to allow calculation of the
distribution of all enzyme species at any given substrate concentration.
In previous work (12,15,16), MgATP had been used as substrate. It has the technical
disadvantage of having an overall high affinity for the catalytic sites of F1, and so Kd1 and Kd2
are in a range where the true concentration of free substrate, knowledge of which is necessary to
calculate the binding constants, is difficult to determine precisely. One problem is that the lower
the concentrations of Mg2+ and ATP, the larger is the impact of uncertainty in the true
dissociation constant for the metal-nucleotide complex. In addition, assessment of true Mg2+
by guest on March 14, 2018
http://ww
w.jbc.org/
Dow
nloaded from
7
concentrations becomes difficult in the submicromolar range, as does the determination of
concentration of free (i.e. non-enzyme-bound) MgATP from total minus enzyme-bound ligand.
Previous studies (17-19) have indicated that the overall affinities of F1 for MgGTP and
MgITP are considerably lower than those for MgATP, while Vmax(hydrolysis) appeared to be
less affected. Both MgGTP and MgITP are competent at eliciting rotation (19) while MgGDP
and MgIDP are good substrates in ATP synthesis (17). Unfortunately, GTP has significant
absorbance at 295 nm, causing a large inner filter effect in Trp fluorescence experiments. Thus,
we investigated here MgITP binding and hydrolysis in the catalytic sites of βY331W F1, under
different conditions. To interpret the experimental findings, we used a statistical analysis in
which the probability of occurrence of all eight possible enzyme species (with zero, one, two, or
three catalytic sites filled) was calculated at each substrate concentration and compared to the
actual data. In light of the outcome, we also re-analyzed MgATP binding and hydrolysis. The
results show that hydrolysis by enzyme molecules with two occupied catalytic sites plays an
even lesser role than we had previously assumed. There is a strong possibility that bi-site
catalysis as an independent working mode simply does not exist. Further, as will be discussed,
theoretical considerations indicate that even if bi-site catalysis does occur, it is most likely due to
the activity of an enzyme species that accounts for maximally 3% of the total enzyme population.
by guest on March 14, 2018
http://ww
w.jbc.org/
Dow
nloaded from
8
EXPERIMENTAL PROCEDURES
Enzyme Preparation and Analysis. Wild-type F1 was from strain SWM1 (20), βY331W mutant
F1 from strain SWM4 (12). Preparation of F1 was as described (18). Concentration of F1 was
determined using the Bio-Rad protein assay (21), with bovine serum albumin as standard.
Before use in activity and nucleotide binding assays, F1 was transferred into a buffer containing
50 mM Tris/H2SO4, pH 8.0, by passage through two consecutive 1-ml Sephadex G-50 centrifuge
columns. This pre-treatment produces enzyme with catalytic sites empty (22). To generate an
enzyme population with homogeneous functional properties, the enzyme was incubated for 15
min with a 2-fold excess of isolated ε subunit. As our F1 preparations themselves are largely ε-
replete ( ≥ 90 %; see Ref. 16), and as the concentrations of F1 used in all experiments (≥ 80 nM)
were two orders of magnitude higher than Kd for ε binding (about 1 nM; see Ref. 16), the
resulting enzyme was > 99% ε-replete. The isolated ε subunit was a generous gift from Dr.
Stanley D. Dunn (University of Western Ontario).
Activity Assays. ITPase activity was measured in 50 mM Tris/H2SO4, pH 8.0, at 23 °C. F1
concentration was 80-100 nM. The reaction was started by simultaneous addition of NaITP and
MgSO4. In one set of experiments (Fig. 2, solid circles; Fig. 4A), ITP and Mg2+ were present in
a 1:1 ratio, in a second set (Fig. 2, solid triangles; Fig. 4B) a 2.5 mM excess of Mg2+ over ITP
was used. Samples were withdrawn at 10-, 20- or 30-sec intervals for a total time of 1, 2 or 3
min. Within this time, all hydrolysis rates were linear. Released Pi was determined
colorimetrically (23,24). ATPase activity was determined using the same technique, except that
a Mg2+/ATP ratio of 1/2.5 was used. MgITP and MgATP concentrations were calculated using a
dissociation constant of 20 µM, as determined for MgATP in (25); MgITP is expected to have
by guest on March 14, 2018
http://ww
w.jbc.org/
Dow
nloaded from
9
the same dissociation constant (26). It should be noted that under the conditions of 2.5 mM
Mg2+ excess virtually all ITP is complexed, thus uncertainties in the dissociation constant have
no effect on the results.
Fluorescence Measurements. All fluorescence measurements were performed in a buffer
containing 50 mM Tris/H2SO4, pH 8.0, at 23 °C, in a spectrofluorometer SPEX Fluorolog 2.
Excitation wavelength was 295 nm. F1 concentration was 100-150 nM. For MgITP titration,
two different conditions were used. In one series of experiments, NaITP and MgSO4 were added
in a constant ratio of 1:1 to a solution of enzyme in buffer. Alternatively, MgSO4 was added in
2.5 mM excess over NaITP. Maximally two data points were acquired in an individual
experiment to avoid interference by hydrolysis product MgIDP. For titration with uncomplexed
ITP, buffer plus 0.5 mM EDTA was used, and NaITP was added. Background signals were
subtracted, and inner filter and volume effects were corrected for by performing parallel
titrations with wild-type F1. Nucleotide binding stoichiometries were determined from the
decrease in β-Trp-331 fluorescence at 360 nm (12). Nucleotide binding parameters were
calculated by fitting theoretical binding curves to the measured data points. For MgITP binding
a model with three sites of different affinity was used, for binding of uncomplexed ITP a model
assuming one type of site was sufficient. For the fitting algorithms, see (27).
Calculation of Enzyme Species Distribution. In the following, the occupancy status of the three
catalytic sites of an F1 molecule is described by a three-digit number in binary code. A zero “0”
indicates an empty site, a one “1” stands for an occupied site. The first digit gives the status of
site one, which is in F1, in presence of Mg2+, the high affinity site; the second digit gives the
status of the medium-affinity site two, and the third that of the low-affinity site three. Thus, e.g.,
110 describes an enzyme molecule where sites one and two are filled while site three is empty.
by guest on March 14, 2018
http://ww
w.jbc.org/
Dow
nloaded from
10
In previous analyses (12,15,16), we had calculated the fraction of enzyme molecules with zero,
one, two or three sites filled. However, only in the cases of zero and three sites filled are the
respective populations homogeneous, 000 and 111, respectively. An enzyme with one bound
nucleotide can have this on site one (100), site two (010), or site three (001). An enzyme with
two bound nucleotides can have site one, two, or three empty (011, 101, 110). There are in total
eight possible species, a complexity which previous analyses did not take account of. While 100
and 110 are clearly the prevailing species with one site or two sites filled, respectively, some of
the other species can reach a population of a few per cent (Figs. 3-5), which depends on the
ratios between the respective dissociation constants, Kd, at the three sites. The fraction θXXX that
a certain enzyme species, XXX (with X = 0 or 1), contributes to the total population is given by
the product of the probabilities, pn, of each individual site, n (with n = one, two or three), being
in the specified state.
For an occupied site,
pn = c/(c+Kdn) (1),
where c is the concentration of free (i.e. not enzyme-bound) ligand and Kdn is the thermodynamic
dissociation constant of site n for the ligand under consideration.
For an empty site,
pn = 1 - c/(c+Kdn) = Kdn/(c+Kdn) (2).
Thus, e.g., the fraction of enzyme molecules in state 110 can be calculated from
θ110 = (c/(c + Kd1))(c/(c + Kd2)) (1-c/(c + Kd3)) (3).
by guest on March 14, 2018
http://ww
w.jbc.org/
Dow
nloaded from
11
RESULTS
ITP Binding to βY331W F1. Binding of ITP to the three catalytic sites of F1 was
measured using the fluorescence of an introduced Trp residue, β-Trp-331 (1,12,22). We have
documented previously that the βY331W mutant enzyme is fully competent in oxidative
phosphorylation and ATP-driven proton-pumping (12,15). Titration with MgITP using an
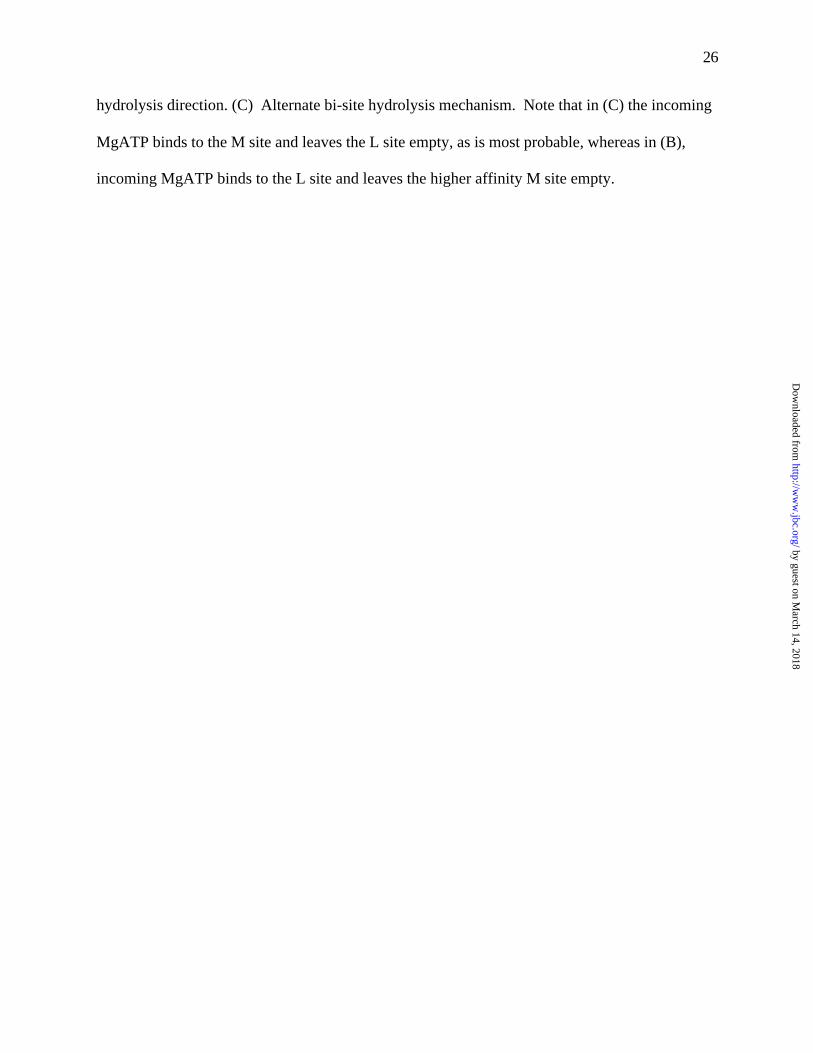
[Mg2+]/[ITP] ratio of 1:1 is shown in Fig. 1A. Titration was also carried out using using a 2.5
mM [Mg2+] excess over [ITP] (data not shown) and with uncomplexed ITP in presence of EDTA
(Fig. 1B). For comparison, data for MgATP and uncomplexed ATP are also shown in Figs. 1A,
1B. It was immediately obvious that ITP binding parallels ATP binding, only with affinities that
are lower by 1-2 orders of magnitude; similar behavior has been observed previously for IDP
versus ADP (28). Also it was clear that in presence of Mg2+, the enzyme displays a pronounced
binding asymmetry for ITP, as it does for ATP, whereas in absence of Mg2+, the enzyme behaves
symmetrically toward both ITP and ATP. Calculated Kd values for MgITP and uncomplexed
ITP are given in Table 1, where parallel values are also given for MgATP and ATP.
ITPase Activity of βY331W F1. ITPase assays at all ITP concentrations were linear, with
no lags or bursts, and there was no indication of any inhibition by product MgIDP. It should be
noted that all the activity assays, and the binding data above, were performed on fully ε-subunit-
replete enzyme. As expected from the binding affinities, much higher concentrations of MgITP
than of MgATP were required to achieve significant hydrolysis rates (Fig. 2). On the other hand,
Vmax(MgITP) for βY331W F1 was found to be significantly higher than Vmax(MgATP), a feature
not observed with wild-type enzyme (18). Precise determination of KM(MgITP) and
by guest on March 14, 2018
http://ww
w.jbc.org/
Dow
nloaded from

12
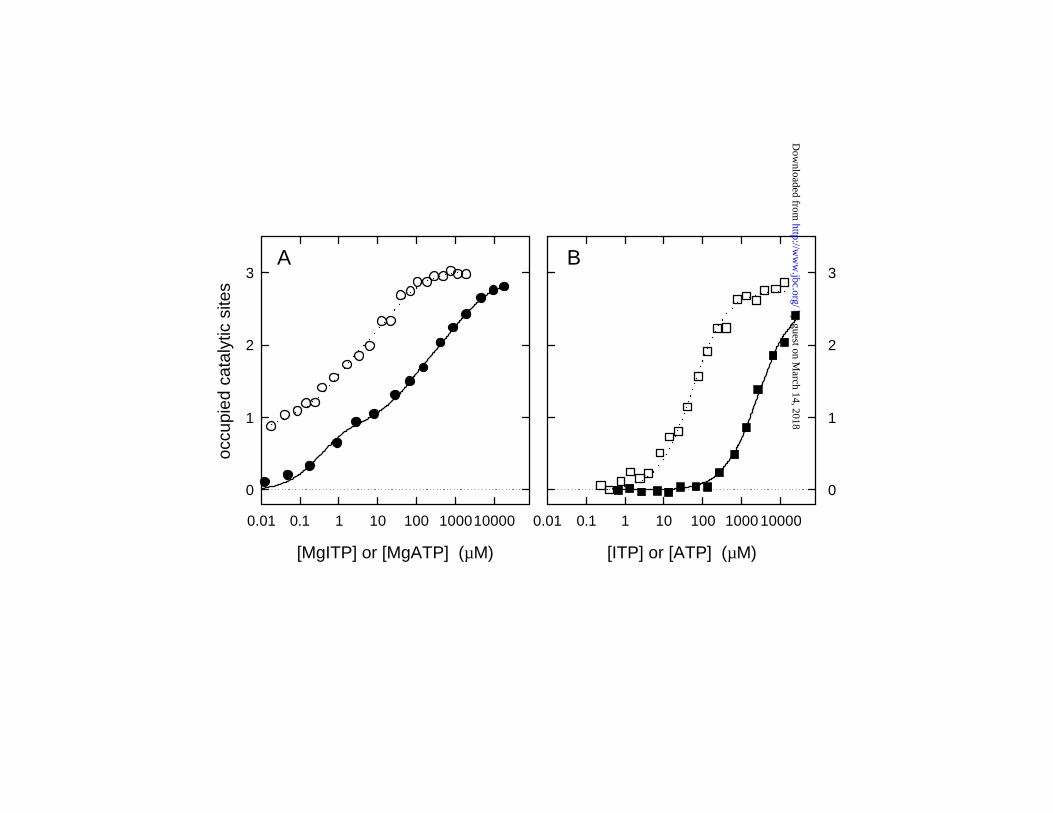
Vmax(MgITP) for βY331W F1 was hampered by a decrease in activity at high (~10 mM) MgITP
concentrations. This decrease was observed under all tested experimental conditions, also when
using an excess of ITP over Mg2+ (data not shown), and is likely due to substrate inhibition.
When all data points shown in Fig. 2 (top) were taken into account, under conditions where
[Mg2+] = [ITP] (filled circles), KM was determined to be 700 µM and Vmax = 6.5 U/mg (fit shown
as dashed line). For the data obtained under 2.5 mM Mg2+excess (filled triangles), KM was 800
µM and Vmax = 4.5 U/mg (fit not shown). Clearly, these fits underestimated the true KM and
Vmax values. Better fits were obtained when the two highest data points in each curve (at 5 and
10 mM ITP) were excluded from the evaluation (fit to the filled circles in Fig. 2, top, shown as
solid line). For the [Mg2+] = [ITP] condition, the resulting KM was 1500 µM, Vmax = 9.9 U/mg.
For the data obtained under 2.5 mM Mg2+ excess, KM was 1600 µM, Vmax = 6.8 U/mg. (The
lower Vmax under conditions of excess [Mg2+] is consistent with established observations for
ATP hydrolysis, and is referable to inhibition by Mg2+ ions). In comparison, KM(MgATP) was
29 µM, Vmax(MgATP) = 3.0 U/mg (Fig. 2, lower, open circles and dotted line). As is obvious
from the tabulation of results in Table 1, KM(MgITP) values agreed well with Kd3(MgITP). This
was also the case for MgATP, as was noted previously (12,16). It should be noted that, for the
evaluation described below, knowledge of KM was not required, but Vmax values were used to
calculate relative specific activities (v/Vmax). However, errors in Vmax(MgITP) due to the
inhibition at high MgITP concentrations were too small to have a significant impact on the
outcome of the present study. It is important to note that in none of the cases did a fit with a
second KM value result in any improvement.
by guest on March 14, 2018
http://ww
w.jbc.org/
Dow
nloaded from
13
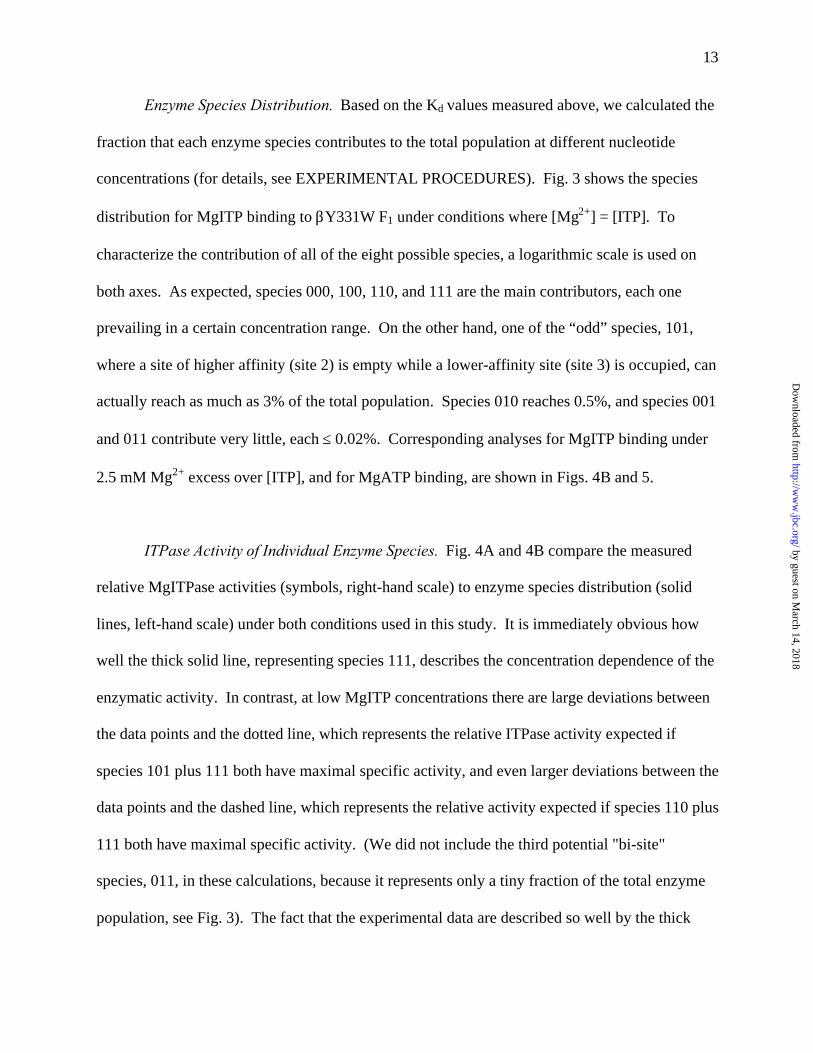
Enzyme Species Distribution. Based on the Kd values measured above, we calculated the
fraction that each enzyme species contributes to the total population at different nucleotide
concentrations (for details, see EXPERIMENTAL PROCEDURES). Fig. 3 shows the species
distribution for MgITP binding to βY331W F1 under conditions where [Mg2+] = [ITP]. To
characterize the contribution of all of the eight possible species, a logarithmic scale is used on
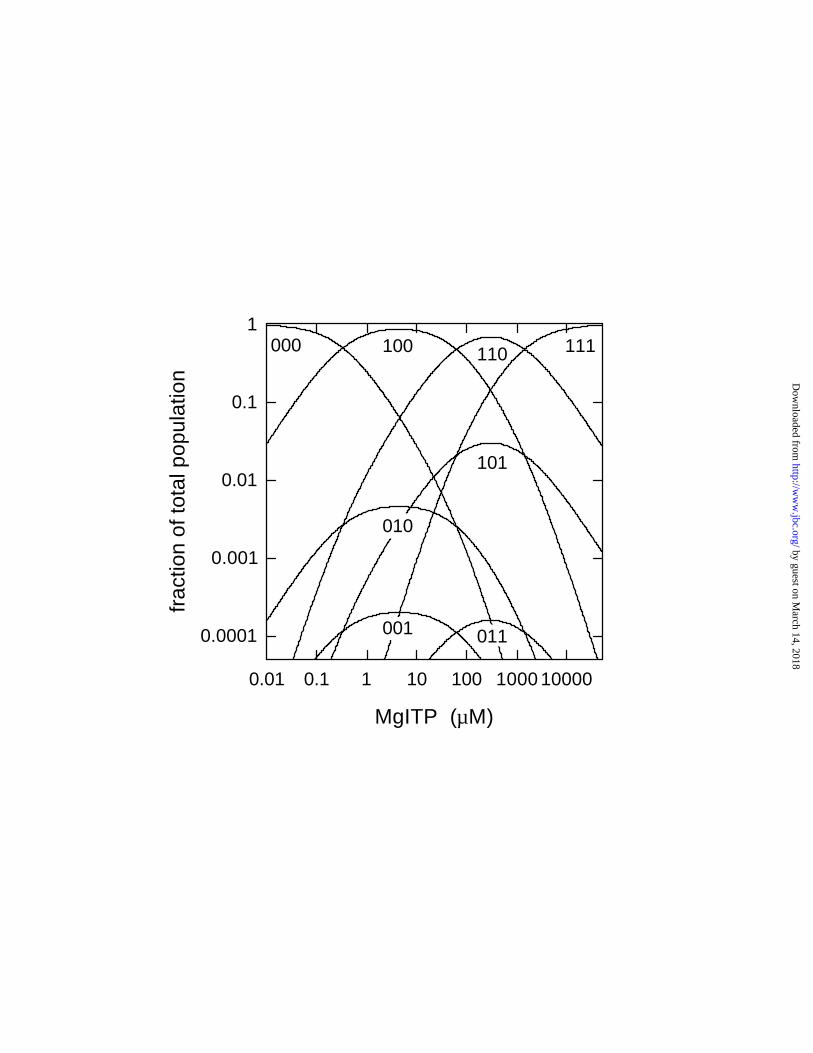
both axes. As expected, species 000, 100, 110, and 111 are the main contributors, each one
prevailing in a certain concentration range. On the other hand, one of the “odd” species, 101,
where a site of higher affinity (site 2) is empty while a lower-affinity site (site 3) is occupied, can
actually reach as much as 3% of the total population. Species 010 reaches 0.5%, and species 001
and 011 contribute very little, each ≤ 0.02%. Corresponding analyses for MgITP binding under
2.5 mM Mg2+ excess over [ITP], and for MgATP binding, are shown in Figs. 4B and 5.
ITPase Activity of Individual Enzyme Species. Fig. 4A and 4B compare the measured
relative MgITPase activities (symbols, right-hand scale) to enzyme species distribution (solid
lines, left-hand scale) under both conditions used in this study. It is immediately obvious how
well the thick solid line, representing species 111, describes the concentration dependence of the
enzymatic activity. In contrast, at low MgITP concentrations there are large deviations between
the data points and the dotted line, which represents the relative ITPase activity expected if
species 101 plus 111 both have maximal specific activity, and even larger deviations between the
data points and the dashed line, which represents the relative activity expected if species 110 plus
111 both have maximal specific activity. (We did not include the third potential "bi-site"
species, 011, in these calculations, because it represents only a tiny fraction of the total enzyme
population, see Fig. 3). The fact that the experimental data are described so well by the thick
by guest on March 14, 2018
http://ww
w.jbc.org/
Dow
nloaded from
14
solid line, and deviate significantly from the calculated fits that include possible bi-site species
110 or 101, demonstrates that virtually all measurable activity is due to enzyme molecules with
all three catalytic sites filled (species 111), i.e. to authentic tri-site catalysis.
Although overall our results appear to reject the concept of bi-site catalysis completely,
there is slight scatter in the data points, and it is informative to assess the impact of bi-site
catalysis if the "odd" species 101 had some activity. Taking all data points from Figs. 4A and 4B
into account, the specific activity cannot be more than 5% of that of species 111. Considering
the fact that maximally 2-3% of the total enzyme population consists of species 101, the
contribution of bi-site activity to overall hydrolysis would indeed be very small (< 0.15% of
Vmax). One might argue that such small differences between the thick solid line and the actual
data points, if they exist at all, are due to activity of species 110, not species 101. However,
calculation shows that as both species have the same concentration dependence, but species 110
is 25 to 35 times as populous (Figs. 3, 4), the specific activity of species 110 would be less than
0.2% of that of species 111 (see also Footnote One).
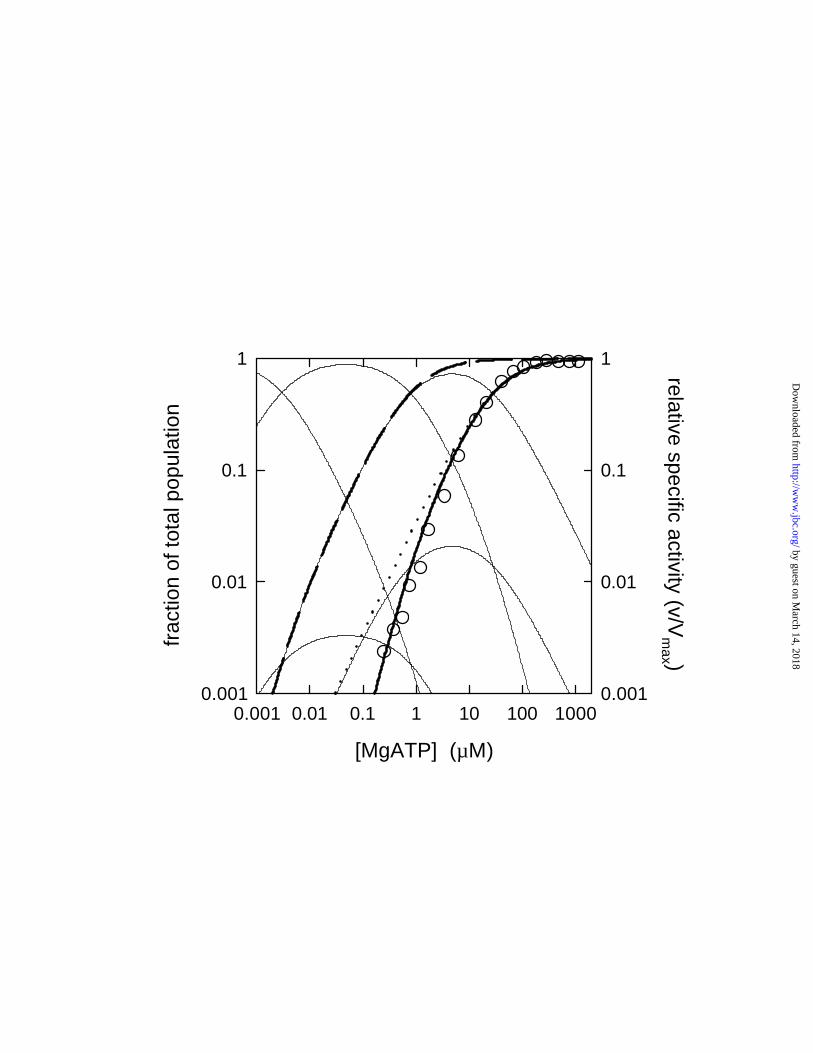
ATPase Activity of Individual Enzyme Species. Fig. 5 shows the corresponding analysis
for the MgATP data. The data points very clearly follow the species 111 distribution curve, for
tri-site catalysis, and fall far from the dotted line (species 101 plus 111) or the dashed line
(species 110 plus 111), showing that the "bi-site" species do not contribute to hydrolysis.
by guest on March 14, 2018
http://ww
w.jbc.org/
Dow
nloaded from
15
DISCUSSION
The goal of this study was to determine the possible role of bi-site catalysis during ATP
hydrolysis by F1-ATPase. To this end, we analyzed nucleotide occupancy of the catalytic sites
and hydrolysis rates as a function of substrate concentration, using two different substrates,
MgITP and MgATP, under varied experimental conditions ([Mg2+] = [nucleotide], Mg2+ excess,
or nucleotide excess). We combined the results with an extensive statistical analysis of all eight
possible species of enzyme that can exist, in regard to catalytic sites occupancy, calculating the
distribution of each species as a fraction of the total population at each nucleotide concentration
and comparing it with the hydrolysis activity seen at that concentration. Taken together the
results present overwhelming evidence that the contribution of bi-site catalysis is negligible. All
measurable steady-state hydrolytic activity is due to enzyme molecules with three occupied
catalytic sites, and the data cast serious doubts on the existence of bi-site catalysis as an
independent working mode of the enzyme. As we discuss below, it is evident also that
occupancy of all three sites is a pre-requisite for ATP-driven subunit rotation, which apparently
occurs exclusively by a tri-site mechanism.
Analysis of catalytic site occupancy was based on quenching of the fluorescence of a Trp
residue, β-Trp-331, in the catalytic site. MgITP was selected as ligand/substrate, to shift the
dissociation constants for catalytic sites one and two (Kd1 and Kd2) into an experimentally better
accessible concentration range. However, it also served a second purpose, which was to refute
criticism of the fluorescence technique itself. Since introduction of the technique (12), a number
of arguments had been presented questioning the validity of the results (29-31). Questions
regarding the rapidity of the fluorescence response and effects of dissociation of ε-subunit were
by guest on March 14, 2018
http://ww
w.jbc.org/
Dow
nloaded from
16
rebutted in (15,16). One further point raised was that the presence of “inhibitory MgADP”
would interfere with the site occupancy analysis during MgATP hydrolysis (30,31). So far, we
failed to detect MgADP inhibition in E. coli F1 under the conditions used to measure MgATP
hydrolysis2. It is nevertheless important to note that for enzymes and/or under conditions where
MgADP inhibition can be observed, MgIDP inhibition is much less pronounced or absent (32-
34). The ITPase assays reported in this work showed no deviations from linearity at any [ITP].
Thus, the close resemblance of the results obtained with MgATP and MgITP corroborated the
absence of inhibitory MgADP in the MgATP binding/hydrolysis experiments.
Although our data appear to reject bi-site catalysis, we cannot rule out that it actually
contributes some activity in the order of < 0.15% of Vmax, and it is interesting to discuss in detail
the theoretical bi-site catalysis mechanism, because this too is germane to the question of
whether it exists or not. Specifically, the question is whether species 101 (with site two empty)
or species 110 (with site three empty) , or a combination of both, could be responsible for this
activity. A possible answer to this question comes from consideration of subunit rotation
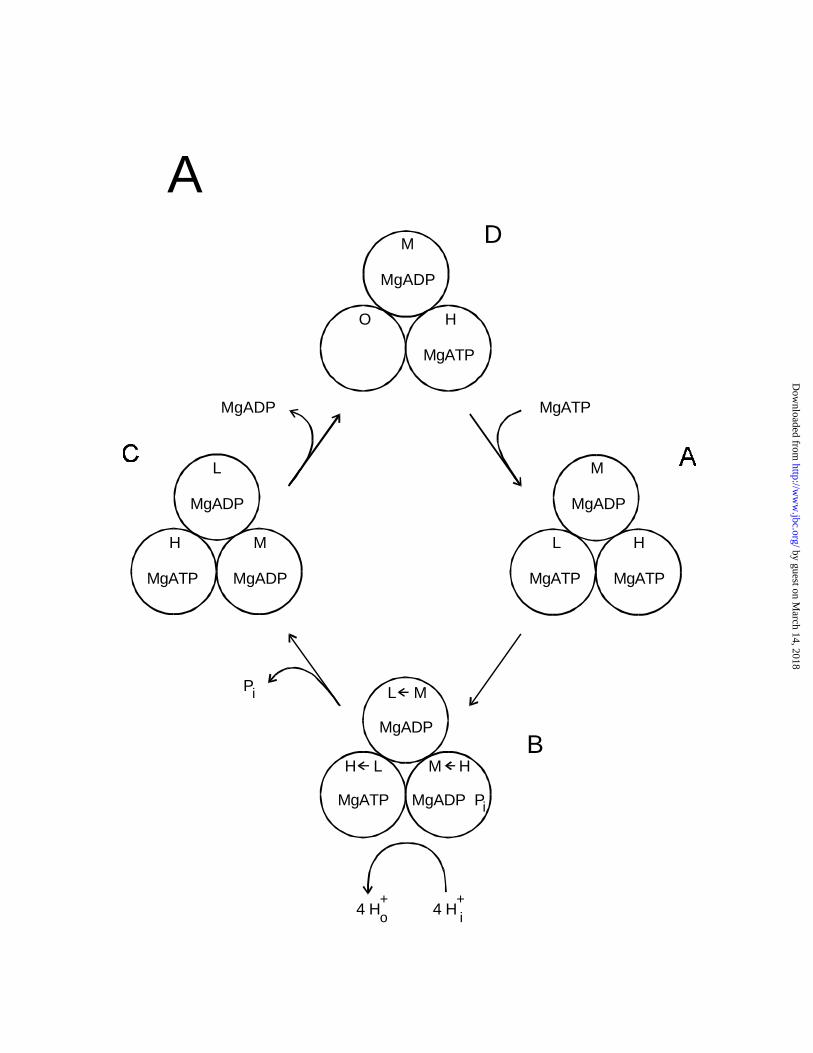
directions. Fig. 6A shows our mechanism for tri-site ATP hydrolysis (1,35,36). Each individual
site changes its binding affinity in the sequence H (high) → M (medium) → L (low) → H →.
While a number of modifications will be required to describe tri-site ATP synthesis adequately
(for a speculative model, see Fig. 3 in Ref. 36), as far as the “binding change” is concerned, the
scheme in Fig. 6A can be readily reversed. Thus, in tri-site ATP synthesis the affinity sequence
for any one site would be H → L → M → H → (see Fig. 3 of Ref. 36) i.e. opposite to the
sequence in tri-site hydrolysis . Therefore, since the binding affinity changes at any one site are
determined by the direction of subunit rotation, in the tri-site mechanism the direction of rotation
in synthesis is predicted to be opposite to that in hydrolysis, as generally accepted.
by guest on March 14, 2018
http://ww
w.jbc.org/
Dow
nloaded from
17
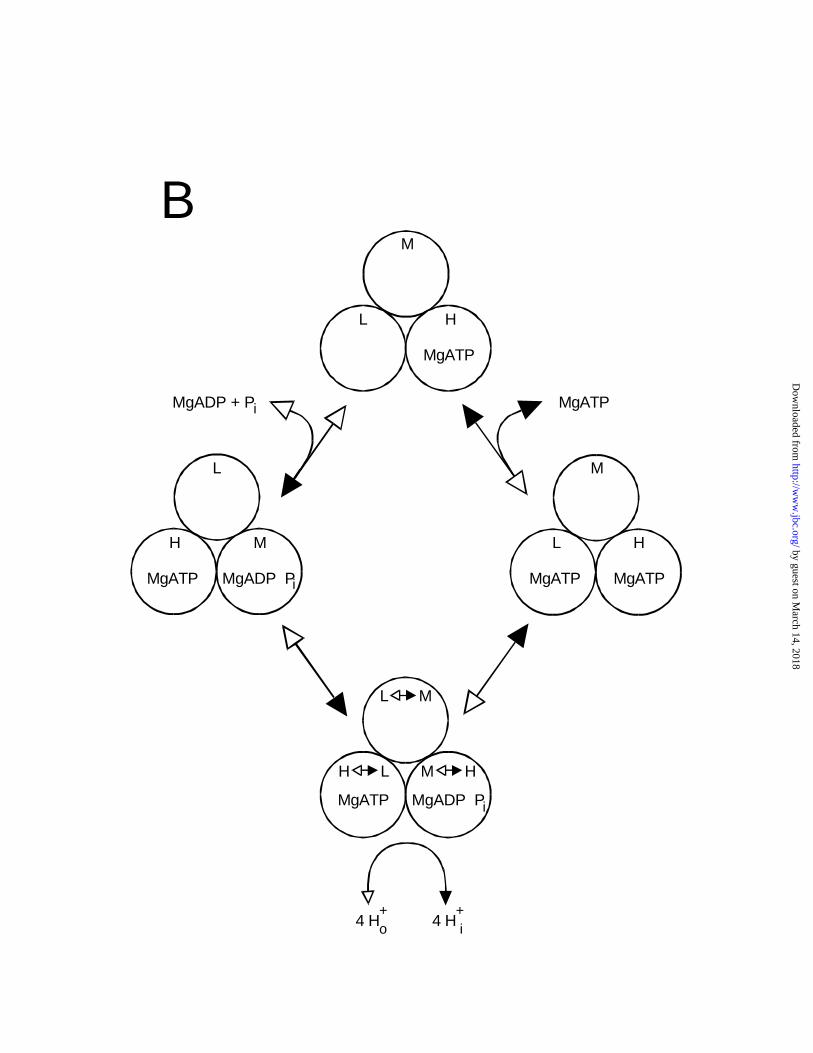
Fig. 6B shows the widely-cited model for reversible bi-site ATP synthesis and hydrolysis
(37), which we have redrawn in the same format as the model in Fig. 6A. In synthesis direction
(counterclockwise in Fig. 6B; solid arrowheads), the sequence of binding affinity changes at
each site is H → L → M → H →, the same sequence as in tri-site synthesis. The sequence for
hydrolysis (clockwise in Fig. 6B; open arrowheads), is H → M → L → H →, i.e. opposite to
synthesis and predicting again rotation in opposite directions for synthesis vs. hydrolysis. In
hydrolysis, the incoming MgATP binds to the L site (site three), while the M site (site two) is
empty. Obviously, this scenario generates species 101, which, as we calculated above,
contributes maximally only 2-3% to the total enzyme population. Otherwise, the mechanism
itself appears feasible. If the incoming MgATP molecule were to bind more conventionally to
site two yielding the more populous species 110, and the binding change sequence were again H
→ M → L → H →, after the binding change the high-affinity site one would be empty, which
would (a) interrupt the mechanism, (b) generate a species with very low probability (011), and
(c) most likely lead to the release of MgATP from the (now) L site.
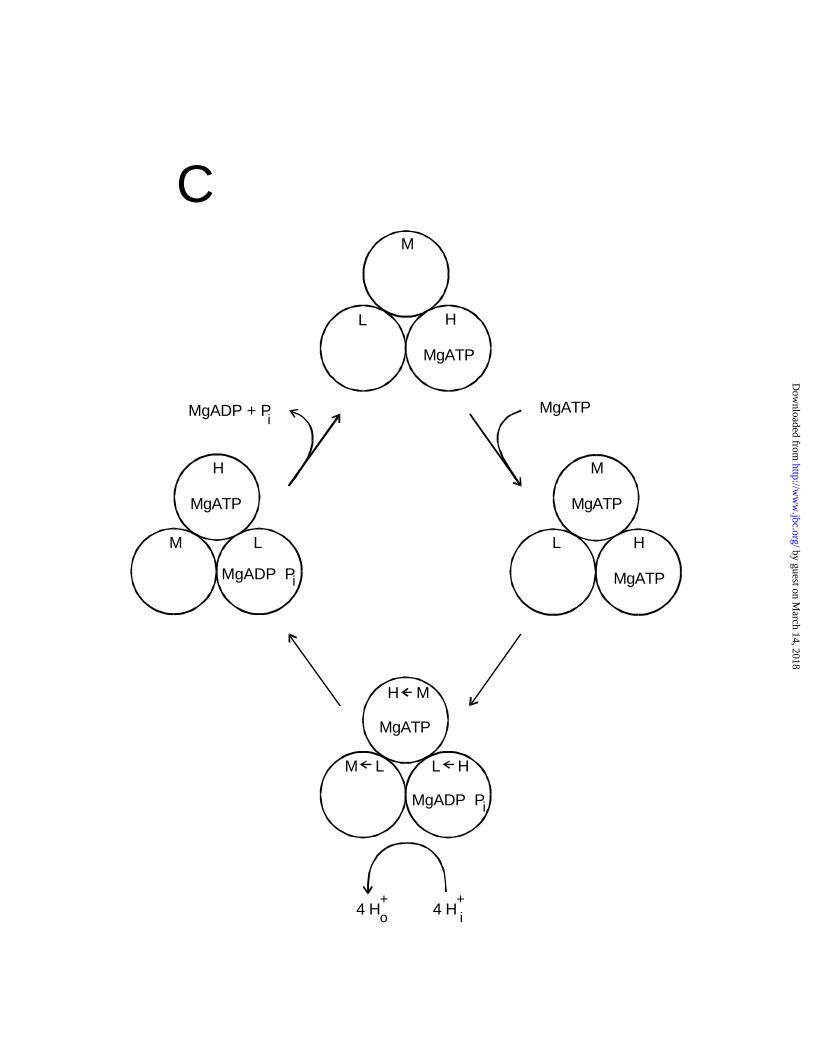
It is possible to write a bi-site hydrolysis mechanism based on species 110 which does
not entail these problems, as shown in Fig. 6C. Here incoming MgATP binds conventionally to
the M site (site two) rather than to the L site (site three). However, the resulting sequence of
binding affinity changes at any one site is H → L → M → H →. This is the same order as for
the bi-site synthesis mechanism in Fig. 6B or for the tri-site synthesis mechanism (Fig. 3 in Ref
36), and, note, it is opposite to the order of binding affinity changes for the tri-site hydrolysis
(Fig. 6A). Thus, we are forced to the conclusions that a conventional bi-site hydrolysis based on
species 110 would require rotation in the same direction as synthesis, which is extremely
unlikely, and that upon increasing substrate concentrations during hydrolysis (from bi-site to tri-
by guest on March 14, 2018
http://ww
w.jbc.org/
Dow
nloaded from
18
site) the enzyme should reverse the rotation direction, which of course was not observed. Hence,
if a low level of bi-site hydrolysis does exist, it is probably due to species 101, not species 110.
While hydrolysis by species 101 is formally bi-site catalysis, only the (very doubtful) hydrolysis
by species 110 would be consistent with the bi-site mechanism as previously described
(13,30,31). In general terms, this theoretical analysis shows that it is not possible to devise a bi-
site mechanism which can describe reversible synthesis/hydrolysis without invoking less
probable enzyme species3, or unlikely scenarios such as a reversal of the order of affinities
between the three sites due to presence of a proton gradient. These theoretical considerations
concerning bi-site catalysis appear not to have been fully-explored by previous investigators.
As to the question of whether ATP synthesis occurs by a bi-site or a tri-site mechanism,
the above analysis shows that either is theoretically feasible. However, because there are
literally no existing reported measurements of catalytic sites occupancy, obtained under
equilibrium conditions during steady-state ATP synthesis, the question cannot yet be answered.
The fact that the enzyme is required to operate in the tri-site mode to attain physiological rate of
ATP hydrolysis suggests to us that it will operate in the tri-site mode during physiological
synthesis also.
Finally, some discussion should be devoted to a recent paper where improvements in
technique allowed analysis of subunit rotation in Bacillus PS3 enzyme on a submillisecond time
scale (39). The fact that ATP-driven rotation apparently occurs by the same mechanism from
MgATP concentrations as low as 20 nM up to saturation caused the authors to claim it as being
due to bi-site catalysis. However, the authors also show (Fig. 3 of Ref. 39) that rotation at 20 nM
MgATP is a very slow (~0.1% of Vmax) manifestation of rotation at substrate saturation, and that
the KM for rotation is 15 µM. The latter value is very close to the Kd3 of 21 µM determined for
by guest on March 14, 2018
http://ww
w.jbc.org/
Dow
nloaded from
19
the enzyme from the same source using the fluorescence technique described here (40). On the
other hand, Kd2 in this enzyme appears to be very low. At 20 nM MgATP, site two is already
half-filled (see Fig. 2 of Ref. 40). Thus, it is likely that the rotation observed at 20 nM MgATP
is indeed due to enzyme molecules which have, transiently, all three sites filled. The facts that
(a) only a single mechanism for rotation was observed from 20 nM up to 2 mM MgATP (39) ,
and (b) it has now been established that, at 2 mM MgATP, hydrolysis in Bacillus PS3 enzyme
occurs by a tri-site mechanism (40), argues convincingly that only tri-site catalysis drives
rotation. Interestingly, using a fluorescent ATP analogue to study catalytic site occupancy
simultaneously with rotation, the same group came to the conclusion that F1 appears to operate in
a tri-site mode (41). The fluorescent product was released only in the third 120o rotation step
after binding, as predicted by our tri-site mechanism (1).
Acknowledgments. Supported by NIH grant GM25349 to AES. We thank Cori Ringholz for
excellent technical assistance.
by guest on March 14, 2018
http://ww
w.jbc.org/
Dow
nloaded from
20
REFERENCES
1. Weber, J., and Senior, A.E. (1997) Biochim. Biophys. Acta 1319, 19-58.
2. Nakamoto, R.K., Ketchum, C.J., and Al-Shawi, M.K. (1999) Annu. Rev. Biophys.
Biomol. Struct. 28, 205-234.
3. Special Issue: Proton-Motive ATPases (2000) J. Exp. Biol. 203 (1).
4. Special Issue: The Mechanisms of F1Fo-ATPases (2000) Biochim. Biophys. Acta 1458
(2/3).
5. Special Issue: ATP Synthesis in the Year 2000 (2000) J. Bioenerg. Biomembr. 32 (4/5).
6. Abrahams, J.P., Leslie, A.G.W., Lutter, R., and Walker, J.E. (1994) Nature 370, 621-628.
7. Noji, H., Yasuda, R., Yoshida, M., and Kinosita Jr., K. (1997) Nature 386, 299-302.
8. Kato-Yamada, Y., Noji, H., Yasuda, R., Kinosita Jr., K., and Yoshida, M. (1998) J. Biol.
Chem. 273, 19375-19377.
9. Sambongi, Y., Iko, Y., Tanabe, M., Omote, H., Iwamoto-Kihara, A., Ueda, I., Yanagida,
T., Wada, Y., and Futai, M. (1999) Science 286, 1722-1724.
10. Weber, J., Nadanaciva, S., and Senior, A.E. (2000) FEBS Lett. 483, 1-5.
11. Garcia, J.J., and Capaldi, R.A. (1998) J. Biol. Chem. 273, 15940-15945.
12. Weber, J., Wilke-Mounts, S., Lee, R.S.F., Grell, E., and Senior, A.E. (1993) J. Biol.
Chem. 268, 20126-20133.
13. Boyer, P.D. (1993) Biochim. Biophys. Acta 1140, 215-250.
14. Jencks, W.P. (1997) Annu. Rev. Biochem. 66, 1-18.
15. Löbau, S., Weber, J., and Senior, A.E. (1998) Biochemistry 37, 10846-10853.
16. Weber, J., Dunn, S.D., and Senior, A.E. (1999) J. Biol. Chem. 274, 19124-19128.
by guest on March 14, 2018
http://ww
w.jbc.org/
Dow
nloaded from
21
17. Perlin, D.S., Latchney, L.R., Wise, J.G., and Senior, A.E. (1984) Biochemistry 23, 4998-
5003.
18. Weber, J., Lee, R.S.F., Grell, E., Wise, J.G., and Senior, A.E. (1992) J. Biol. Chem. 267,
1712-1718.
19. Noji, H., Bald, D., Yasuda, R., Itoh, H., Yoshida, M., and Kinosita Jr., K. (2001) J. Biol.
Chem., 276, 25480-25486.
20. Rao, R., Al-Shawi, M.K., and Senior, A.E. (1988) J. Biol. Chem. 263, 5569-5573.
21. Bradford, M.M. (1976) Anal. Biochem. 72, 248-254.
22. Weber, J., Wilke-Mounts, S., and Senior, A.E. (1994) J. Biol. Chem. 269, 20462-20467.
23. Taussky, H.H., and Shorr, E. (1953) J. Biol. Chem. 202, 675-685.
24. van Veldhoven, P.P., and Mannaerts, G.P. (1987) Anal. Biochem. 161, 45-48.
25. Pecoraro, V.L., Hermes, J.D., and Cleland, W.W. (1984) Biochemistry 23, 5262-5271.
26. Dawson, R.M.C., Elliot, D.C., Elliot, W.H., Jones, K.M. (Eds.) (1979) Data for
Biochemical Research, 2nd Ed., Clarendon Press, Oxford. pp 423-434.
27. Löbau, S., Weber, J., Wilke-Mounts, S., and Senior, A.E. (1997) J. Biol. Chem. 272,
3648-3656.
28. Nadanaciva, S., Weber, J., and Senior, A.E. (2000) Biochemistry 39, 9583-9590.
29. Murataliev, M.B., and Boyer, P.D. (1994) J. Biol. Chem. 269, 15431-15439.
30. Boyer, P.D. (1997) Annu. Rev. Biochem. 66, 717-749.
31. Milgrom, Y.M., Murataliev, M.B., and Boyer, P.D. (1998) Biochem. J. 330, 1037-1043.
32. Vasilyeva, E.A., Minkov, I.B., Fitin, A.F., and Vinogradov, A.D. (1982) Biochem. J. 202,
9-14.
by guest on March 14, 2018
http://ww
w.jbc.org/
Dow
nloaded from
22
33. Hyndman, D.J., Milgrom, Y.M., Bramhall, E.A., and Cross, R.L. (1994) J. Biol. Chem.
269, 28871-28877.
34. Jault, J.M., Paik, S.R., Grodsky, N.B., and Allison, W.S. (1994) Biochemistry 33, 14979-
14985.
35. Weber, J., Bowman, C., and Senior, A.E. (1996) J. Biol. Chem. 271, 18711-18718.
36. Weber, J., and Senior, A.E. (2000) Biochim. Biophys. Acta 1458, 300-309.
37. Cross, R.L. (1981) Annu. Rev. Biochem. 50, 681-714.
38. Boyer, P.D. (2000) Biochim. Biophys. Acta 1458, 252-262.
39. Yasuda, R., Noji, H., Yoshida, M., Kinosita Jr., K., and Itoh, H. (2001) Nature 410, 898-
904.
40. Ren, H., and Allison, W.S. (2000) J. Biol. Chem. 275, 10057-10063.
41. Nishizaka, T., Adachi, K., Itoh, H., Kinosita Jr., K., Noji, H., Oiwa, K., Yasuda, R.
(2001) Biophys. J. 80, 158a.
42. Klotz, I.M., and Hunston, D.L. (1979) Arch. Biochem. Biophys. 193, 314-328.
43. Peters, F., and Lücken, U. (1986) Methods Enzymol. 126, 733-740.
by guest on March 14, 2018
http://ww
w.jbc.org/
Dow
nloaded from
23
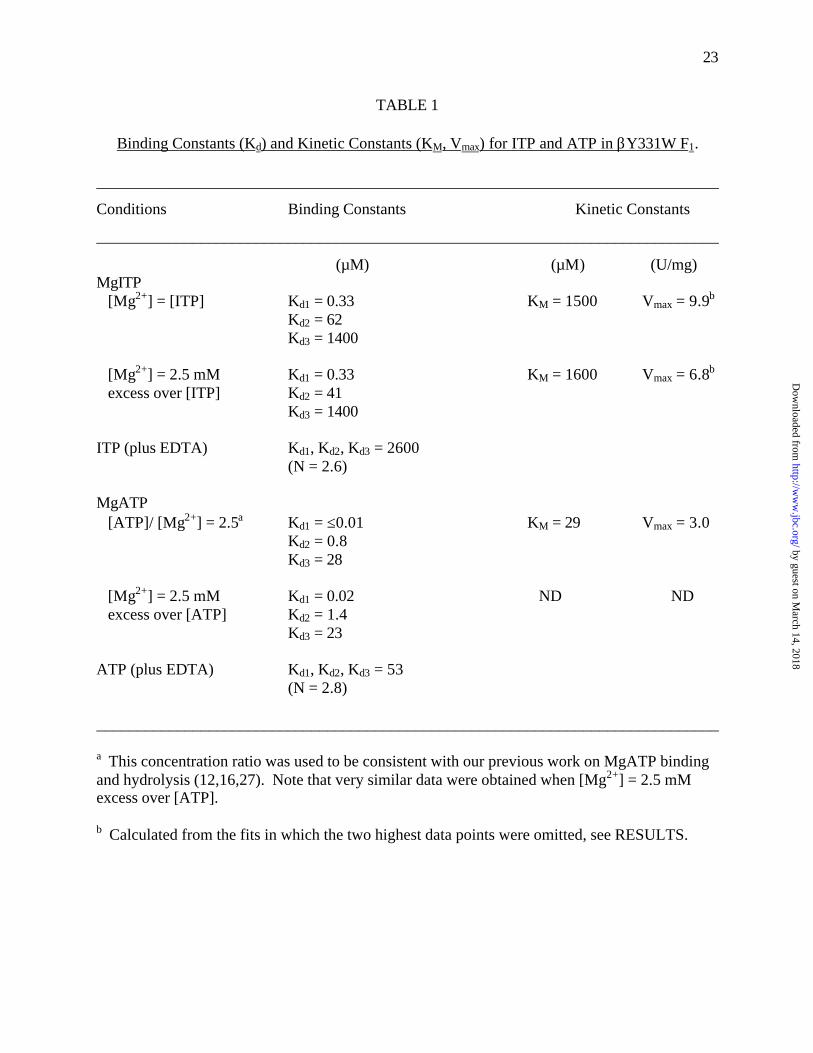
TABLE 1
Binding Constants (Kd) and Kinetic Constants (KM, Vmax) for ITP and ATP in βY331W F1.
______________________________________________________________________________
Conditions Binding Constants Kinetic Constants
______________________________________________________________________________
(µM) (µM) (U/mg)MgITP [Mg2+] = [ITP] Kd1 = 0.33 KM = 1500 Vmax = 9.9b
Kd2 = 62Kd3 = 1400
[Mg2+] = 2.5 mM Kd1 = 0.33 KM = 1600 Vmax = 6.8b
excess over [ITP] Kd2 = 41Kd3 = 1400
ITP (plus EDTA) Kd1, Kd2, Kd3 = 2600(N = 2.6)
MgATP [ATP]/ [Mg2+] = 2.5a Kd1 = ≤0.01 KM = 29 Vmax = 3.0
Kd2 = 0.8Kd3 = 28
[Mg2+] = 2.5 mM Kd1 = 0.02 ND ND excess over [ATP] Kd2 = 1.4
Kd3 = 23
ATP (plus EDTA) Kd1, Kd2, Kd3 = 53(N = 2.8)
______________________________________________________________________________
a This concentration ratio was used to be consistent with our previous work on MgATP bindingand hydrolysis (12,16,27). Note that very similar data were obtained when [Mg2+] = 2.5 mMexcess over [ATP].
b Calculated from the fits in which the two highest data points were omitted, see RESULTS.
by guest on March 14, 2018
http://ww
w.jbc.org/
Dow
nloaded from
24
LEGENDS TO FIGURES
Figure 1. ITP binding to βY331W F1. (A) l, MgITP binding under conditions [Mg2+] = [ITP];
m, MgATP binding under conditions [ATP]/ [Mg2+] = 2.5/1 (as used in previous work, Refs.
12,16,22). (B) n, Uncomplexed ITP binding, in presence of EDTA; q, Uncomplexed ATP
binding, presence of EDTA. Lines are fits to the data points; binding models and resulting Kd
values are given in EXPERIMENTAL PROCEDURES and Table 1, respectively.
Figure 2. MgITP hydrolysis by βY331W F1. (l) [Mg2+] = [ITP] conditions; broken line is a
simple Michaelis-Menten fit to all data points, solid line was obtained with omission of the two
highest data points. (s) [Mg2+] = 2.5 mM excess over [ITP]; no fit shown. For comparison,
MgATP hydrolysis (m) is shown ([ATP]/ [Mg2+] = 2.5/1) with a simple Michaelis-Menten fit
(dotted line) to all data points.
Figure 3. Distribution of enzyme species with different catalytic sites occupancy as a function of
MgITP concentration. Distributions (lines) were calculated based on Kd1 = 0.33 µM, Kd2 = 62
µM, Kd3 = 1400 µM (values for [Mg2+] = [ITP] conditions) as described in EXPERIMENTAL
PROCEDURES. Species designations (100, 111, etc., as defined in EXPERIMENTAL
PROCEDURES) are located closely below the maximum of the respective curve. Note the
logarithmic scales.
by guest on March 14, 2018
http://ww
w.jbc.org/
Dow
nloaded from
25
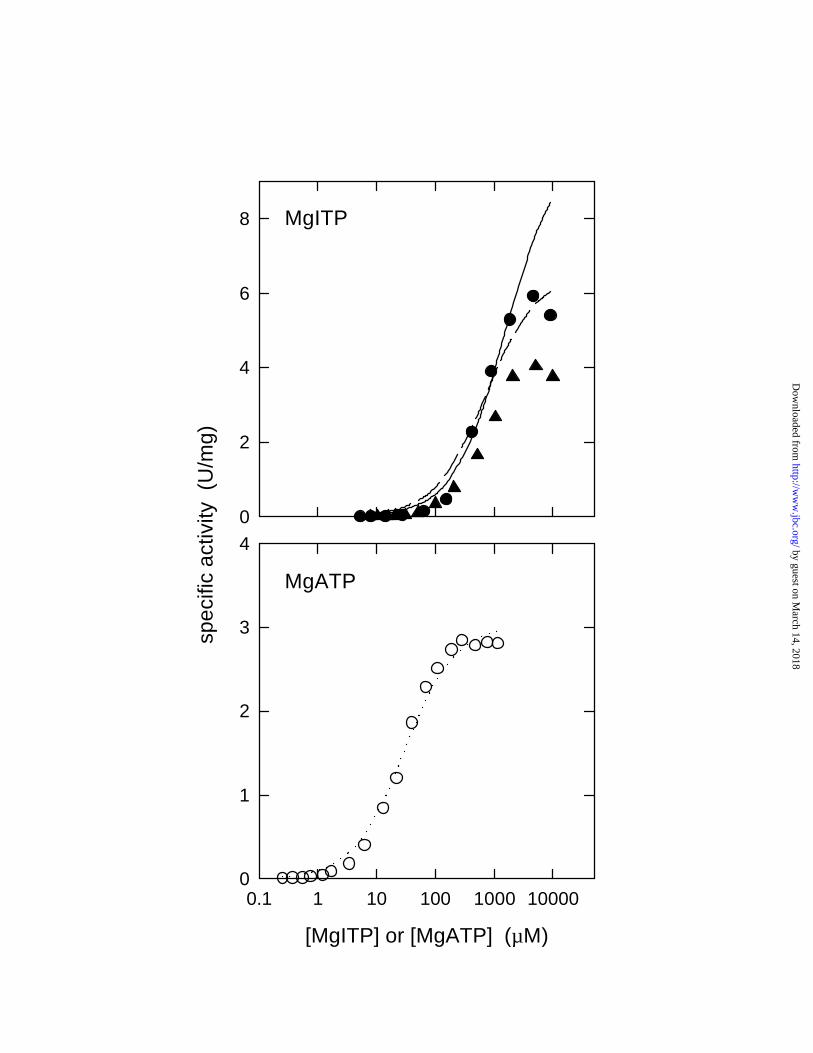
Figure 4. Comparison of relative MgITPase activity and enzyme species distributions. (A)
[Mg2+] = [ITP] conditions, (B) [Mg2+] = 2.5mM excess over [ITP] conditions. Symbols (l,s)
show measured relative ITPase activity (right-hand scale). Solid lines show species distribution
(left-hand scale). Thick solid lines stand for species 111, thin solid lines for remaining species,
with assignment exactly as in Fig. 3. (Note that in (B) species 001 and 011 are off-scale). The
dotted lines represent predicted activity of sum of species 101 plus 111, if both have the same
specific activity. The dashed lines represent predicted activity of sum of species 110 plus 111 if
both have the same specific activity. For further details, see RESULTS.
Figure 5. Comparison of relative MgATPase activity and enzyme species distributions.
Symbols (m) show measured relative ATPase activity (right-hand scale), solid lines show
species distribution (left-hand scale). The thick solid line stands for species 111, thin solid lines
for remaining species, with assignment exactly as in Fig. 3. (Note that species 001 and 011 are
off-scale). The dotted lines represent predicted activity of sum of species 101 plus 111, if both
have the same specific activity. The dashed lines represent predicted activity of sum of species
110 plus 111 if both have the same specific activity. For further details, see RESULTS.
Figure 6. Schemes of possible mechanisms for ATP synthesis and hydrolysis. The three
catalytic sites of each enzyme molecule are represented by the circles labelled H, high affinity
site one; M, medium affinity site two; L, low affinity site three; and O, open or empty site. The
"binding affinity change" is shown by arrows within the circles. (A) Tri-site mechanism for
ATP hydrolysis of Weber and Senior (36). (B) Bi-site mechanism for reversible ATP synthesis
and hydrolysis (37). Solid arrowheads denote synthesis direction, open arrowheads denote
by guest on March 14, 2018
http://ww
w.jbc.org/
Dow
nloaded from
26
hydrolysis direction. (C) Alternate bi-site hydrolysis mechanism. Note that in (C) the incoming
MgATP binds to the M site and leaves the L site empty, as is most probable, whereas in (B),
incoming MgATP binds to the L site and leaves the higher affinity M site empty.
by guest on March 14, 2018
http://ww
w.jbc.org/
Dow
nloaded from
[MgITP] or [MgATP] (µM)
0.01 0.1 1 10 100 100010000
occu
pied
cat
alyt
ic s
ites
0
1
2
3
[ITP] or [ATP] (µM)
0.01 0.1 1 10 100 1000 10000
0
1
2
3A B
by guest on March 14, 2018
http://ww
w.jbc.org/
Dow
nloaded from
[MgITP] or [MgATP] (µM)
0.1 1 10 100 1000 100000
1
2
3
4
spec
ific
activ
ity (
U/m
g)
0
2
4
6
8 MgITP
MgATP
by guest on March 14, 2018
http://ww
w.jbc.org/
Dow
nloaded from
MgITP (µM)
0.01 0.1 1 10 100 1000 10000
frac
tion
of to
tal p
opul
atio
n
0.0001
0.001
0.01
0.1
1000 100 110 111
101
010
001 011
by guest on March 14, 2018
http://ww
w.jbc.org/
Dow
nloaded from

frac
tion
of to
tal p
opul
atio
n
0.0001
0.001
0.01
0.1
1
0.0001
0.001
0.01
0.1
1
MgITP (µM)
0.01 0.1 1 10 100 1000 10000
0.001
0.01
0.1
1
relative specific activity (v/Vm
ax )
0.001
0.01
0.1
1
A
B by guest on March 14, 2018
http://ww
w.jbc.org/
Dow
nloaded from
[MgATP] (µM)
0.001 0.01 0.1 1 10 100 1000
frac
tion
of to
tal p
opul
atio
n
0.001
0.01
0.1
1
0.001
0.01
0.1
1
relative specific activity (v/Vm
ax )
by guest on March 14, 2018
http://ww
w.jbc.org/
Dow
nloaded from
M
ML
H M L H
L M
H L M H
O H
MgADP
MgATP
MgADP
MgADP MgADP
MgATP
MgATP MgADP MgATP MgATP
MgADP
P
MgATP MgADP P
i
i
4 H 4 H+ +o i
D
B
A
by guest on March 14, 2018
http://ww
w.jbc.org/
Dow
nloaded from
M
ML
H M L H
L M
H L M H
L H
MgATP
MgADP + P MgATP
MgATP MgATP MgATP
MgATP MgADP P
MgADP P
i
i
i
4 H 4 H+ +o i
B
by guest on March 14, 2018
http://ww
w.jbc.org/
Dow
nloaded from
M
MH
M L L H
H M
M L L H
L H
MgATP
MgADP + P
MgATP MgATP
MgATP
MgATP
MgATP
MgADP P
i
i
4 H 4 H+ +o i
MgADP Pi
C
by guest on March 14, 2018
http://ww
w.jbc.org/
Dow
nloaded from
Joachim Weber and Alan E. SeniorBi-site catalysis in F1-ATPase: Does it exist?
published online July 12, 2001J. Biol. Chem.
10.1074/jbc.M104946200Access the most updated version of this article at doi:
Alerts:
When a correction for this article is posted•
When this article is cited•
to choose from all of JBC's e-mail alertsClick here
by guest on March 14, 2018
http://ww
w.jbc.org/
Dow
nloaded from