1 applied statistics using sas and spss topic: factor analysis by prof kelly fan, cal state univ,...
TRANSCRIPT
1
Applied Statistics Using SAS and SPSS
Topic: Factor Analysis
By Prof Kelly Fan, Cal State Univ, East Bay

2
Outline
Introduction
Principal component analysis
Rotations
Using communalities other than one

3
Introduction
Reduce data
Summarize many ordinal categorical factors by a few combinations of them (new factors)

4
Example. 6 Questions
Goal: a measure of depression and a measure of paranoia (how pleasant)
6 questions with response using number 1 to 7. The smaller the number is, the stronger the subject agrees. 4: no opinion

5
Example. 6 Questions
1. I usually feel blue.2. People often stare at me.3. I think that people are following me.4. I am usually happy.5. Someone is trying to hurt me.6. I enjoy going to parties.Q. Which questions will a depressed person
likely agree with? A happy person?

6
Data Set:
Subj 1 2 3 4 5 6 7 8 9
Q
u
e
s
t
i
o
n
1 7 6 3 2 3 6 1 3 2
2 2 3 6 2 4 3 2 3 1
3 3 2 7 2 2 4 3 2 1
4 4 1 3 5 4 2 7 3 6
5 5 3 6 3 2 3 2 4 2
6 6 2 3 4 3 2 2 3 5

7
Data Set:
Subj 10 11 12 13 14 15
Q
u
e
s
t
i
o
n
1 6 3 6 5 2 1
2 2 5 7 1 1 2
3 3 4 6 1 1 1
4 2 2 2 2 6 7
5 2 3 6 6 1 1
6 2 3 2 2 5 7
8
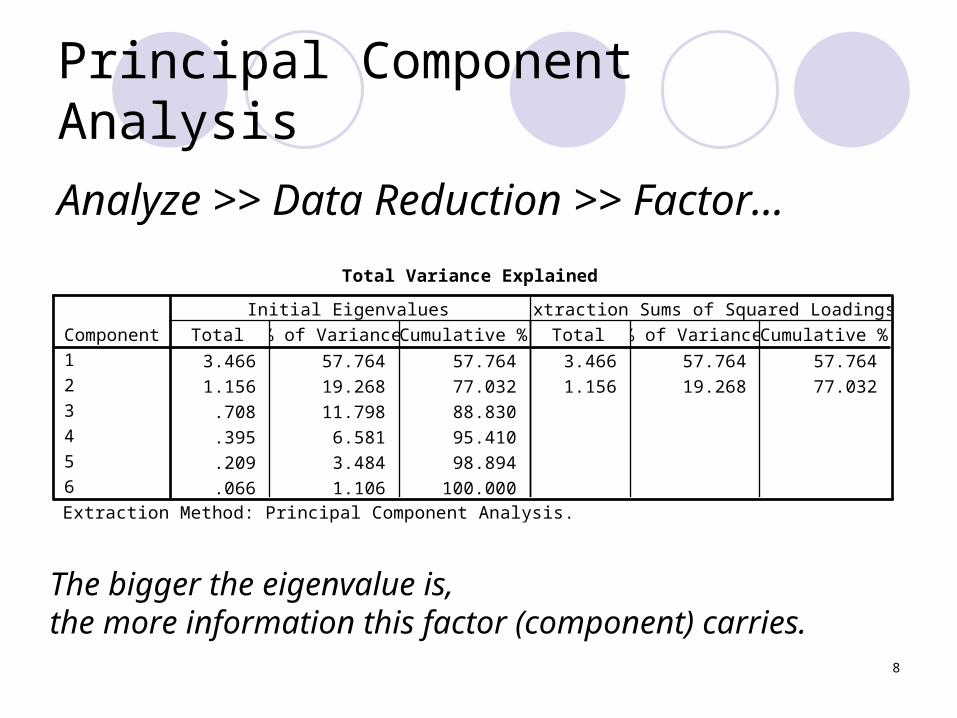
Principal Component Analysis
Analyze >> Data Reduction >> Factor…
Total Variance Explained
3.466 57.764 57.764 3.466 57.764 57.764
1.156 19.268 77.032 1.156 19.268 77.032
.708 11.798 88.830
.395 6.581 95.410
.209 3.484 98.894
.066 1.106 100.000
Component1
2
3
4
5
6
Total % of Variance Cumulative % Total % of Variance Cumulative %
Initial Eigenvalues Extraction Sums of Squared Loadings
Extraction Method: Principal Component Analysis.
The bigger the eigenvalue is, the more information this factor (component) carries.

9
A Visual Tool: Scree Plot

10

11
Communalities
Communalities represent how much variance in the original variables is explained by all of the factors kept in the analysis.

12
SPSS Output
Communalities
1.000 .808
1.000 .902
1.000 .907
1.000 .898
1.000 .597
1.000 .510
feel blue
people stare at me
people follow me
usually happy
people want to hurt me
enjoy parties
Initial Extraction
Extraction Method: Principal Component Analysis.

13
Two Summary Factors
Component Matrixa
.696 -.568
.751 .581
.787 .536
-.858 .402
.772 .033
-.682 .211
feel blue
people stare at me
people follow me
usually happy
people want to hurt me
enjoy parties
1 2
Component
Extraction Method: Principal Component Analysis.
2 components extracted.a.
14
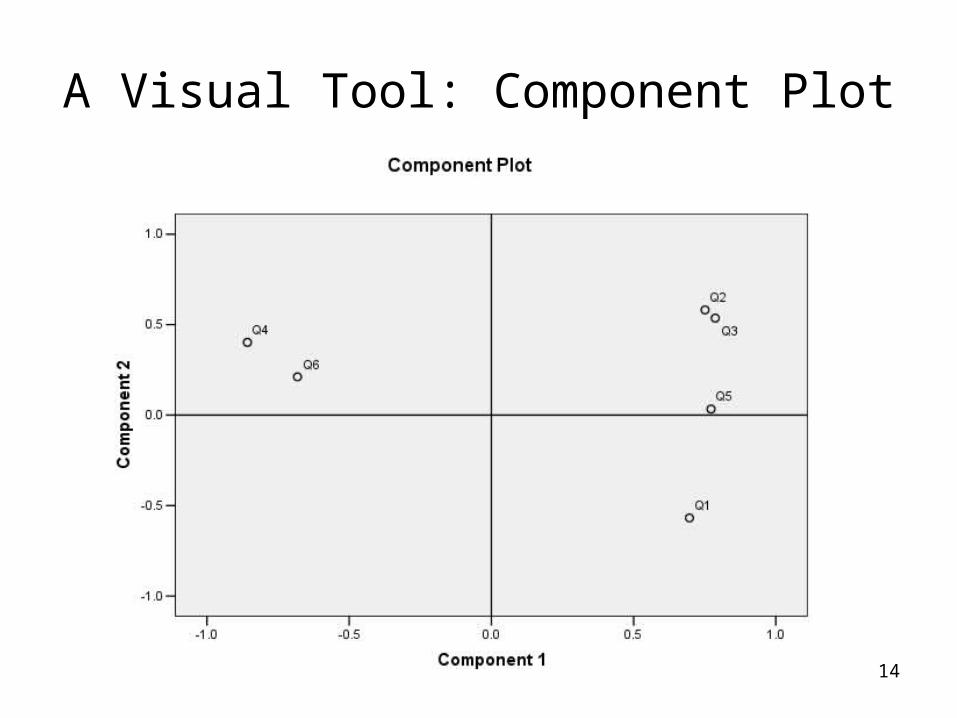
A Visual Tool: Component Plot

15
Discussion
Q4 & Q6 should be at the same direction of factor 1 & 2 (component 1 & 2)
The other questions should be at the same direction of factor 1 & 2 (component 1 & 2)
Need a rotation!!

16
Rotation: Varimax Rotation

17
Component Matrixa
.696 -.568
.751 .581
.787 .536
-.858 .402
.772 .033
-.682 .211
feel blue
people stare at me
people follow me
usually happy
people want to hurt me
enjoy parties
1 2
Component
Extraction Method: Principal Component Analysis.
2 components extracted.a.
Rotated Component Matrixa
.898 .047
.165 .935
.222 .926
-.905 -.279
.549 .544
-.647 -.302
feel blue
people stare at me
people follow me
usually happy
people want to hurt me
enjoy parties
1 2
Component
Extraction Method: Principal Component Analysis. Rotation Method: Varimax with Kaiser Normalization.
Rotation converged in 3 iterations.a.
Varimax rotation

18
Total Variance Explained
3.466 57.764 57.764 3.466 57.764 57.764 2.422 40.365 40.365
1.156 19.268 77.032 1.156 19.268 77.032 2.200 36.667 77.032
.708 11.798 88.830
.395 6.581 95.410
.209 3.484 98.894
.066 1.106 100.000
Component1
2
3
4
5
6
Total % of Variance Cumulative % Total % of Variance Cumulative % Total % of Variance Cumulative %
Initial Eigenvalues Extraction Sums of Squared Loadings Rotation Sums of Squared Loadings
Extraction Method: Principal Component Analysis.

19

20
Using Communalities Other Than One
When the original factors are not equally important
Different methods of “extraction”

21
Un-weighted Least Squares
Communalitiesa
.739 .603
.811 .757
.809 .976
.844 .999
.485 .463
.551 .358
feel blue
people stare at me
people follow me
usually happy
people want to hurt me
enjoy parties
Initial Extraction
Extraction Method: Unweighted Least Squares.
One or more communalitiy estimates greater than1 were encountered during iterations. The resultingsolution should be interpreted with caution.
a.

22
Total Variance Explained
3.466 57.764 57.764 3.206 53.437 53.437 2.170 36.173 36.173
1.156 19.268 77.032 .972 16.192 69.629 2.007 33.456 69.629
.708 11.798 88.830
.395 6.581 95.410
.209 3.484 98.894
.066 1.106 100.000
Factor1
2
3
4
5
6
Total % of Variance Cumulative % Total % of Variance Cumulative % Total % of Variance Cumulative %
Initial Eigenvalues Extraction Sums of Squared Loadings Rotation Sums of Squared Loadings
Extraction Method: Unweighted Least Squares.

23
Factor Matrixa
.638 -.443
.735 .466
.819 .552
-.887 .483
.681 -.001
-.581 .144
feel blue
people stare at me
people follow me
usually happy
people want to hurt me
enjoy parties
1 2
Factor
Extraction Method: Unweighted Least Squares.
2 factors extracted. 13 iterations required.a.
Rotated Factor Matrixa
.769 .110
.221 .842
.224 .962
-.978 -.250
.499 .463
-.523 -.291
feel blue
people stare at me
people follow me
usually happy
people want to hurt me
enjoy parties
1 2
Factor
Extraction Method: Unweighted Least Squares. Rotation Method: Varimax with Kaiser Normalization.
Rotation converged in 3 iterations.a.
Varimax rotation