1 an empirical analysis of marginal efficiency … 2014... · 1=multipane window houses with manual...
TRANSCRIPT

AN EMPIRICAL ANALYSIS OF MARGINAL
EFFICIENCY GAINS WITHIN AND ACROSS END
USES: IMPLICATIONS FOR THE REBOUND
EFFECT FOR HOUSEHOLDS
June 16th, 2014
Nour Bouhou, MS, PhD Candidate
The University Of Texas At Austin
Civil, Architectural, & Environmental Engineering
Advisor: Dr. Michael Blackhurst
1

Energy Simulations of Buildings
� Engineering modeling is dominant paradigm� EnergyPlus
� BeOpt
� Demand-side management (Energy Change = - Efficiency Change)
� Even sophisticated engineering models perform
poorly
� Empirical models use statistics to predict
observed consumption given variation in
descriptive factors
2

Empirical Efficiency Research
� Observed energy efficiency outcomes often
different than predicted
� Some studies attribute this difference to behavior
changes (i.e., the “rebound effect”)
� Pecan Street data offer unique insight to more
empirically assess efficiency outcomes
3

How do homeowners respond to efficiency
changes?
Behavior change
Effect on Energy Savings
Example
None All technically feasible
savings realized
Direct
rebound
Homeowners use
more of the more
efficient service
Consumer drives more
with a more fuel efficient
car
Indirect
rebound
Homeowners leverage
efficiency gains in one
service for another
Savings from efficient
lighting spend on 2nd
refrigerator
Expand
Services
Homeowners increase
energy services in
home
Efficiency gains spent on
new TV
Net energy savings
4

How do homeowners respond to efficiency
changes?
Behavior change
Effect on Energy Savings
Example
None All technically feasible
savings realized
Direct
rebound
Homeowners use
more of the more
efficient service
Consumer drives more
with a more fuel efficient
car
Indirect
rebound
Homeowners leverage
efficiency gains in one
service for another
Savings from efficient
lighting spend on 2nd
refrigerator
Expand
Services
Homeowners increase
energy services in
home
Efficiency gains spent on
new TV
Net energy savings
5

How do homeowners respond to efficiency
changes?
Behavior change
Effect on Energy Savings
Example
None All technically feasible
savings realized
Direct
rebound
Homeowners use
more of the more
efficient service
Consumer drives more
with a more fuel efficient
car
Indirect
rebound
Homeowners leverage
efficiency gains in one
service for another
Savings from efficient
lighting spend on 2nd
refrigerator
Expand
Services
Homeowners increase
energy services in
home
Efficiency gains spent on
new TV
Net energy savings
6

How do homeowners respond to efficiency
changes?
Behavior change
Effect on Energy Savings
Example
None All technically feasible
savings realized
Direct
rebound
Homeowners use
more of the more
efficient service
Consumer drives more
with a more fuel efficient
car
Indirect
rebound
Homeowners leverage
efficiency gains in one
service for another
Savings from efficient
lighting spend on 2nd
refrigerator
Expand
Services
Homeowners increase
energy services in
home
Efficiency gains spent on
new TV
Net energy savings
7

How do homeowners respond to efficiency
changes?
Behavior change
Effect on Energy Savings
Example
None All technically feasible
savings realized
Direct
rebound
Homeowners use
more of the more
efficient service
Consumer drives more
with a more fuel efficient
car
Indirect
rebound
Homeowners leverage
efficiency gains in one
service for another
Savings from efficient
lighting spend on 2nd
refrigerator
Expand
Services
Homeowners increase
energy services in
home
Efficiency gains spent on
new TV
Net energy savings
8

Empirical Model
Household electricity consumption is a function of
�Physical characteristics (floorspace, insulation, etc.)
�Demographic characteristics (income, occupancy, etc.)
�Self-reported behaviors (appliance use)
�Technology choices (Energy Star appliances, insulation, etc.)
�Exogenous factors (weather, etc.)
9

Empirical Model
Where
� Yit represents monthly electricity consumption (kWh/month)
� βj are the predictor coefficient for fixed effects
� Sijλ represents a series of household structural factors
� Dijλ represents a series of household demographic factors
� Bijλ represents household behaviors and cognitive factors
� Tij represents technology choices
� Ri represents the household identification codes
� εij are the error terms.
10

Empirical Model
Where
� Yit represents monthly electricity consumption (kWh/month)
� βj are the predictor coefficient for fixed effects
� Sijλ represents a series of household structural factors
� Dijλ represents a series of household demographic factors
� Bijλ represents household behaviors and cognitive factors
� Tij represents technology choices
� Ri represents the household identification codes
� εij are the error terms.
11

Empirical Model
Where
� Yit represents monthly electricity consumption (kWh/month)
� βj are the predictor coefficient for fixed effects
� Sijλ represents a series of household structural factors
� Dijλ represents a series of household demographic factors
� Bijλ represents household behaviors and cognitive factors
� Tij represents technology choices
� Ri represents the household identification codes
� εij are the error terms.
12

Empirical Model
Where
� Yit represents monthly electricity consumption (kWh/month)
� βj are the predictor coefficient for fixed effects
� Sijλ represents a series of household structural factors
� Dijλ represents a series of household demographic factors
� Bijλ represents household behaviors and cognitive factors
� Tij represents technology choices
� Ri represents the household identification codes
� εij are the error terms.
13

Empirical Model
14
e.g.: Programmable thermostat * Multipane
windows

Total 354 262 187 197 145 103 11 111 88 82
New 265 198 119 191 127 64 1 94 49 55
Retrofit 89 64 68 6 18 39 10 17 39 27
Inspections
& Drawings
Household
survey
Energy
audit
Elec.
Production
Elec.
Consum-
ption Natural gas Water
Elec. Cons
+ Survey
Elec Cons
+ Survey +
Audit
Gas Cons +
Survey +
Audit
Indicated household consist across table
89
homes
existing
at start
of study
265 homes new at start of
study
89
homes
existing
at start
of study
Sample from Pecan Street Research
Institute15

Total 354 262 187 197 145 103 11 111 88 82
New 265 198 119 191 127 64 1 94 49 55
Retrofit 89 64 68 6 18 39 10 17 39 27
Inspections
& Drawings
Household
survey
Energy
audit
Elec.
Production
Elec.
Consum-
ption Natural gas Water
Elec. Cons
+ Survey
Elec Cons
+ Survey +
Audit
Gas Cons +
Survey +
Audit
Indicated household consist across table
89
homes
existing
at start
of study
265 homes new at start of
study
89
homes
existing
at start
of study
Sample from Pecan Street Research
InstituteStatic data
16

Total 354 262 187 197 145 103 11 111 88 82
New 265 198 119 191 127 64 1 94 49 55
Retrofit 89 64 68 6 18 39 10 17 39 27
Inspections
& Drawings
Household
survey
Energy
audit
Elec.
Production
Elec.
Consum-
ption Natural gas Water
Elec. Cons
+ Survey
Elec Cons
+ Survey +
Audit
Gas Cons +
Survey +
Audit
Indicated household consist across table
89
homes
existing
at start
of study
265 homes new at start of
study
89
homes
existing
at start
of study
Sample from Pecan Street Research
InstituteStatic data High resolution consumption data
17

Total 354 262 187 197 145 103 11 111 88 82
New 265 198 119 191 127 64 1 94 49 55
Retrofit 89 64 68 6 18 39 10 17 39 27
Inspections
& Drawings
Household
survey
Energy
audit
Elec.
Production
Elec.
Consum-
ption Natural gas Water
Elec. Cons
+ Survey
Elec Cons
+ Survey +
Audit
Gas Cons +
Survey +
Audit
Indicated household consist across table
89
homes
existing
at start
of study
265 homes new at start of
study
89
homes
existing
at start
of study
Sample from Pecan Street Research
InstituteStatic data High resolution consumption data
18Our
Sample

Electricity End-Uses in Study
Air conditioning
Electricity
Consumption Fitted
To
AC Energy Efficiency Ratio (EER)
Windows (multi- or single pane)
Attic R-value
Programmable thermostat
Appliances (Energy Star or Code Min)
Refrigerator
Dishwasher
Clothes washer
New services
Devices (TVs, Computers, Tables, Game
Consoles)
19

Electricity End-Uses in Study
Air conditioning
Electricity
Consumption Fitted
To
AC Energy Efficiency Ratio (EER)
Windows (multi- or single pane)
Attic R-value
Programmable thermostat
Appliances (Energy Star or Code Min)
Refrigerator
Dishwasher
Clothes washer
New services
Devices (TVs, Computers, Tables, Game
Consoles)
Technical
Change
Within AC
(Direct)
20

Electricity End-Uses in Study
Air conditioning
Electricity
Consumption Fitted
To
AC Energy Efficiency Ratio (EER)
Windows (multi- or single pane)
Attic R-value
Programmable thermostat
Appliances (Energy Star or Code Min)
Refrigerator
Dishwasher
Clothes washer
New services
Devices (TVs, Computers, Tables, Game
Consoles)
Technical
Change
Within AC
(Direct) Technical
Change
Across End-
Uses (Direct,
Indirect)
21

Electricity End-Uses in Study
Air conditioning
Electricity
Consumption Fitted
To
AC Energy Efficiency Ratio (EER)
Windows (multi- or single pane)
Attic R-value
Programmable thermostat
Appliances (Energy Star or Code Min)
Refrigerator
Dishwasher
Clothes washer
New services
Devices (TVs, Computers, Tables, Game
Consoles)
Technical
Change
Within AC
(Direct) Technical
Change
Across End-
Uses (Direct,
Indirect)
New
Energy
Services
(Direct +
Indirect)
22

Results with No Interaction Terms
(No cross effects or marginal analysis)23
Explanatory variable Coefficient
estimate
p-value % change in consumption
for 1 unit (or 10%++)
increase in X variable
Constant (bo) 7.97 0 *
Cooling Degree Days 0.00129 0 * 0.129%
1/ √(House Area) -73.8 0 * 8.15% ++
Insulation R value -0.00562 0.051 * -0.56%
Devices 0.0153 0.066 * 1.54%
Programmable Thermostat 0.0898 0.256 9.4%
Energy Star Clothes washer 0.0542 0.382 5.56%
Photovoltaic panels -0.05 0.625 -4.88%
Note: Devices include computers, TVs, tablets, cable or satellite boxes, DVRs/DVD/VCR/BluRay, Stereo systems, and gaming systems .
* Statistically significant results to the 10% level

Margins Plot PrimerF
itte
d (
or
Pre
dic
ted)
log(
Ele
ctr
icity
Consum
ption)
Efficiency
Increase in consumption (possible behavior change)
Decrease in consumption (good!)
24

Elec Use ~ 640 kWh/
month
Elec Use ~ 844 kWh/
month Elec Use ~ 829 kWh/
month
Elec Use ~ 712 kWh/
month
6.2
6.3
6.4
6.5
6.6
6.7
6.8
6.9
7
Fitted
valu
es o
f Lo
g(E
lect
rici
ty C
onsu
mption)
Windows:
0= Single pane windows 1=Multipane window
Houses with Manual Thermostat Houses with Programmable Thermostat
Marginal Efficiency Gains Within Space
Conditioning25
0 1
Manual Thermostat Programmable Thermostat

Elec Use ~ 640 kWh/
month
Elec Use ~ 844 kWh/
month Elec Use ~ 829 kWh/
month
Elec Use ~ 712 kWh/
month
6.2
6.3
6.4
6.5
6.6
6.7
6.8
6.9
7
Fitted
valu
es o
f Lo
g(E
lect
rici
ty C
onsu
mption)
Windows:
0= Single pane windows 1=Multipane window
Houses with Manual Thermostat Houses with Programmable Thermostat
Marginal Efficiency Gains Within Space
Conditioning26
0 1
32%
Manual Thermostat
Elec Use~ 640
kWh/month
Elec Use~ 844
kWh/month

Elec Use ~ 640 kWh/
month
Elec Use ~ 844 kWh/
month Elec Use ~ 829 kWh/
month
Elec Use ~ 712 kWh/
month
6.2
6.3
6.4
6.5
6.6
6.7
6.8
6.9
7
Fitted
valu
es o
f Lo
g(E
lect
rici
ty C
onsu
mption)
Windows:
0= Single pane windows 1=Multipane window
Houses with Manual Thermostat Houses with Programmable Thermostat
Marginal Efficiency Gains Within Space
Conditioning27
0 1
Elec Use~ 829
kWh/month
Elec Use~ 712
kWh/month
-14%
32%
Houses with
programmable
thermostat
Predicted use = 829
kWh/month
windows
Predicted use =
844 kWh/month
multi-paneHouses with
Predicted
use = 712
kWh/mont
h
-14%
Elec Use~ 640
kWh/month
Elec Use~ 844
kWh/month
Manual Thermostat Programmable Thermostat

Elec Use ~ 640 kWh/
month
Elec Use ~ 844 kWh/
month Elec Use ~ 829 kWh/
month
Elec Use ~ 712 kWh/
month
6.2
6.3
6.4
6.5
6.6
6.7
6.8
6.9
7
Fitted
valu
es o
f Lo
g(E
lect
rici
ty C
onsu
mption)
Windows:
0= Single pane windows 1=Multipane window
Houses with Manual Thermostat Houses with Programmable Thermostat
Marginal Efficiency Gains Within Space
Conditioning28
0 1
Elec Use~ 829
kWh/month
Elec Use~ 712
kWh/month
-14%
32%
Houses with
programmable
thermostat
Predicted use = 829
kWh/month
windows
Predicted use =
844 kWh/month
multi-paneHouses with
Predicted
use = 712
kWh/mont
h
-14% -16%
-16%
Elec Use~ 640
kWh/month
Elec Use~ 844
kWh/month
Manual Thermostat Programmable Thermostat

Elec Use ~ 616 kWh/
month
Elec Use ~ 825 kWh/
month
Elec Use ~738 kWh/
month
Elec Use ~ 736 kWh/
month
6.2
6.3
6.4
6.5
6.6
6.7
6.8
6.9
7
Fitte
d v
alu
es
of
Log(E
lect
rici
ty C
onsu
mption)
Clothes washer:
0= Code Minimum Clothes Washer
1=Energy Star Clothes Washer
Houses with Manual Thermostat Houses with Programmable Thermostat
Marginal Efficiency Gains Across End-Uses
29
0 1
Elec Use~ 825
kWh/month
34%
Elec Use~ 616
kWh/month
Manual Thermostat Programmable ThermostatManual Thermostat

Elec Use ~ 616 kWh/
month
Elec Use ~ 825 kWh/
month
Elec Use ~738 kWh/
month
Elec Use ~ 736 kWh/
month
6.2
6.3
6.4
6.5
6.6
6.7
6.8
6.9
7
Fitte
d v
alu
es
of
Log(E
lect
rici
ty C
onsu
mption)
Clothes washer:
0= Code Minimum Clothes Washer
1=Energy Star Clothes Washer
Houses with Manual Thermostat Houses with Programmable Thermostat
Marginal Efficiency Gains Across End-Uses
30
0 1
Elec Use~ 738
kWh/month
Elec Use~ 736
kWh/month
Elec Use~ 616
kWh/month
Elec Use~ 825
kWh/month
-0.2%
34%
Manual Thermostat Programmable Thermostat
Marginal Efficiency Gains Across End-Uses
0
31
(2)
Elec Use ~ 616 kWh/
month
Elec Use ~ 825 kWh/
month
Elec Use ~738 kWh/
month
Elec Use ~ 736 kWh/
month
6.2
6.3
6.4
6.5
6.6
6.7
6.8
6.9
7
Fitte
d v
alu
es
of
Log(E
lect
rici
ty C
onsu
mption)
Clothes washer:
0= Code Minimum Clothes Washer
1=Energy Star Clothes Washer
Houses with Manual Thermostat Houses with Programmable Thermostat
0 1
Elec Use~ 738
kWh/month
Elec Use~ 736
kWh/month
Elec Use~ 616
kWh/month
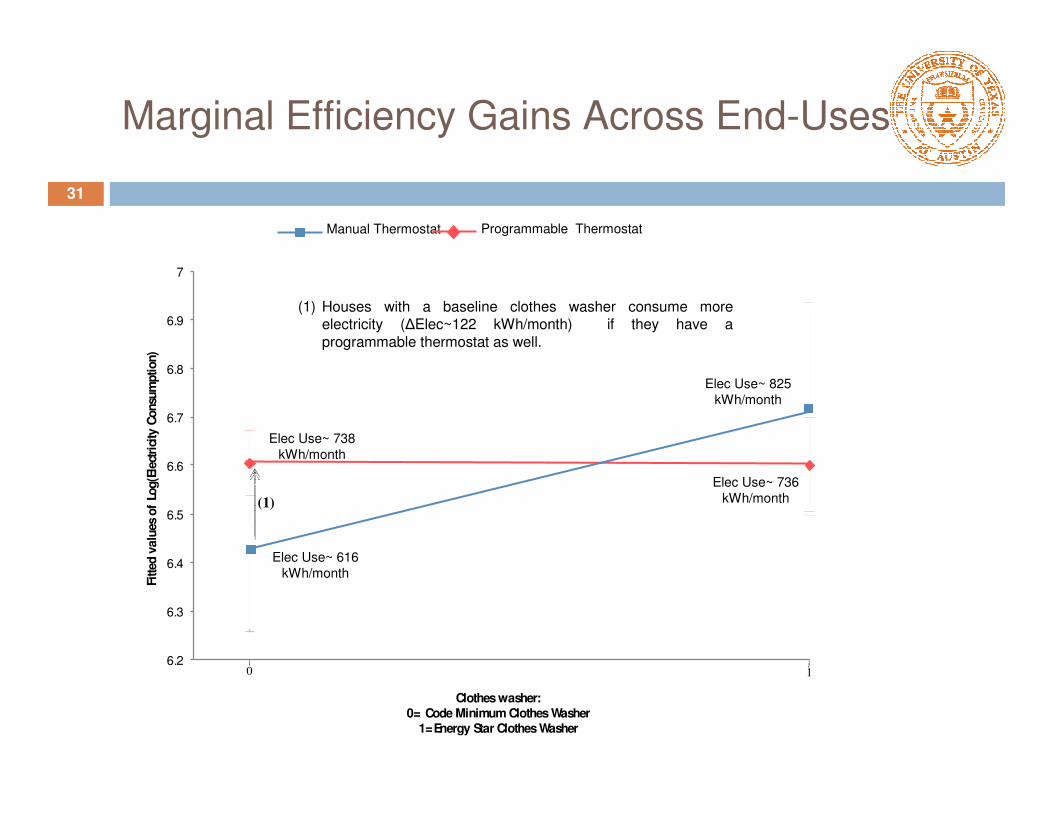
(1) Houses with a baseline clothes washer consume more electricity (∆Elec~122 kWh/month) if they have a
programmable thermostat as well.
Elec Use~ 825
kWh/month
(1)
Manual Thermostat Programmable Thermostat

Marginal Efficiency Gains Across End-Uses
0
32
(2)
Elec Use ~ 616 kWh/
month
Elec Use ~ 825 kWh/
month
Elec Use ~738 kWh/
month
Elec Use ~ 736 kWh/
month
6.2
6.3
6.4
6.5
6.6
6.7
6.8
6.9
7
Fitte
d v
alu
es
of
Log(E
lect
rici
ty C
onsu
mption)
Clothes washer:
0= Code Minimum Clothes Washer
1=Energy Star Clothes Washer
Houses with Manual Thermostat Houses with Programmable Thermostat
0 1
Elec Use~ 738
kWh/month
Elec Use~ 736
kWh/month
Elec Use~ 616
kWh/month
Elec Use~ 825
kWh/month
(1)
(2)
(1) Houses with a baseline clothes washer consume more electricity (∆Elec~122 kWh/month) if they have a
programmable thermostat as well.
Manual Thermostat Programmable Thermostat
(2) Houses with Energy Star clothes washer and a programmable
thermostat decrease their electricity consumption (∆Elec~ -89 kWh/month).

Eelec Use~677 kWh/
month
Eelec Use~1424 kWh/
month
Eelec Use~736 kWh/
month
Eelec Use~728 kWh/
month
6.2
6.4
6.6
6.8
7
7.2
7.4
7.6
7.8
Fit
ted
va
lues
of
Lo
g(E
lect
ric
ity
Co
nsu
mp
tio
n)
Vehicles:
0= Houses with no Electric Vehicle
1=Houses with Electric Vehicle
Houses with Manual Thermostat Houses with programmable thermostat
Efficiency Gains for New Services
33
(2)
Elec Use~ 736
kWh/month
Elec Use~ 728
kWh/month Elec Use~ 677
kWh/month
Elec Use~ 1424
kWh/month
0
-1%
110%
Manual Thermostat Programmable Thermostat
1

Eelec Use~677 kWh/
month
Eelec Use~1424 kWh/
month
Eelec Use~736 kWh/
month
Eelec Use~728 kWh/
month
6.2
6.4
6.6
6.8
7
7.2
7.4
7.6
7.8
Fit
ted
va
lues
of
Lo
g(E
lect
ric
ity
Co
nsu
mp
tio
n)
Vehicles:
0= Houses with no Electric Vehicle
1=Houses with Electric Vehicle
Houses with Manual Thermostat Houses with programmable thermostat
Efficiency Gains for New Services
34
(2)
Elec Use~ 736
kWh/month
Elec Use~ 728
kWh/month Elec Use~ 677
kWh/month
Elec Use~ 1424
kWh/month
0
Manual Thermostat Programmable Thermostat
1
(1)
(2)
(1) Houses with no Electric Vehicle consume more electricity (∆elec~59 kWh/month) if they have a programmable
thermostat as well.
(2) Houses with an Electric Vehicle and a programmable
thermostat decrease their electricity consumption (∆Elec~ -696 kWh/month).

Change in electricity use with Marginal
Efficiency Gains
R <19 19 <R < 29 R>30 7 eer 11 eer 14 eer count=5 count=10 count=15
R <19
19 <R < 29
R>30
7 eer
11 eer
14 eer
count=5
count=10
count=15Electric Vehicle
ES Clothes washer
Devices
ES Refrigerator
ES Dishwasher
Air Conditioning
EER
Multipane Windows
Insulation R value
ES Clothes washer
Devices Electric Vehicle
Programmable Thermostat
Programmable Thermostat
Multipane Window
Insulation R value Air Conditioning EER ES Refrigerator
ES Dishwasher
Houses with Programmable thermostat
Houses
with
Multipane winows
35
Houses withprogrammable
thermostat windows
-14% change -16% change
Predicted use = 829
kWh/monthPredicted
use = 712
kWh/mont
h
Predicted use =
844 kWh/month
multi-paneHouses with
-14%
-16%

Change in electricity use with Marginal
Efficiency Gains36
R <19 19 <R < 29 R>30 7 eer 11 eer 14 eer count=5 count=10 count=15
* -14% * 0% * -1%
* -16%R <19
19 <R < 29
R>30
7 eer * -15% * -31%
11 eer * 12% * -4%
14 eer * 38% * 24%
*-11%
count=5
count=10
count=15
* -49%
LEGEND
Increase in electricity consumption
No effect
Net energy savings
* Statistically significant results to 10% level
Electric Vehicle
Electric Vehicle
* 0%
Insulation R value
Multipane Windows
Programmable Thermostat
Multipane Window
Insulation R value Air Conditioning EER ES Refrigerator
ES Dishwasher
ES Clothes washer
Devices
Programmable Thermostat
Air Conditioning
EER
ES Refrigerator
ES Dishwasher * 5%ES Clothes washer
Devices

Summary of Efficiency Analysis
� The observed effect of technical change is most significantly influenced by the presence of a programmable thermostat
37

Results with No Interaction Terms
(No cross effects or marginal analysis)38
Explanatory variable Coefficient
estimate
p-value % change in consumption
for 1 unit (or 10%++)
increase in X variable
Constant (bo) 7.97 0 *
Cooling Degree Days 0.00129 0 * 0.129%
1/ √(House Area) -73.8 0 * 8.15% ++
Insulation R value -0.00562 0.051 * -0.56%
Devices 0.0153 0.066 * 1.54%
Programmable Thermostat 0.0898 0.256 9.4%
Energy Star Clothes washer 0.0542 0.382 5.56%
Photovoltaic panels -0.05 0.625 -4.88%
Note: Devices include computers, TVs, tablets, cable or satellite boxes, DVRs/DVD/VCR/BluRay, Stereo systems, and gaming systems .
* Statistically significant results to the 10% level

Change in electricity use with Marginal
Efficiency Gains39
R <19 19 <R < 29 R>30 7 eer 11 eer 14 eer count=5 count=10 count=15
* -14% * 0% * -1%
* -16%R <19
19 <R < 29
R>30
7 eer * -15% * -31%
11 eer * 12% * -4%
14 eer * 38% * 24%
*-11%
count=5
count=10
count=15
* -49%
LEGEND
Increase in electricity consumption
No effect
Net energy savings
* Statistically significant results to 10% level
Electric Vehicle
Electric Vehicle
* 0%
Insulation R value
Multipane Windows
Programmable Thermostat
Multipane Window
Insulation R value Air Conditioning EER ES Refrigerator
ES Dishwasher
ES Clothes washer
Devices
Programmable Thermostat
Air Conditioning
EER
ES Refrigerator
ES Dishwasher * 5%ES Clothes washer
Devices

Summary of Efficiency Analysis
� The observed effect of technical change is most significantly influenced by the presence of a programmable thermostat
� “Enough” efficiency improvement is needed to overcome behavioral responses
� Homes do not appear to be rebounding into appliances (Saturation)
� Homeowners may leverage efficiency gains for device use
� Baseline technical state of home (and order of technical change)
matters
40

Policy Implications
� Make people thermally comfortable first
� Bundle incentives to achieve “enough” efficiency gains to overcome behavioral responses
� Could we better design incentives using existing technical state of home (per energy audit)?
� Would coupling education about this research with incentives affect outcomes?
41

Photovoltaic technology in the US

How do homeowners leverage the PV gains?
Possible scenarios:
�Displace conventional electricity
�Utilize for conventional end-uses (efficiency measure)
�Utilize for new services (devices, EV, etc.)
43
Empirical model:

How do homeowners leverage the PV gains?
44
Efficiency measures New services
LOW demand-side
characteristics
Manual R value ~ 16 Code minimum
dishwasher
Number of devices ~ 5 No Electric vehicle
HIGH demand-side
characteristics
Programmable R value ~ 36 EnergyStar Dishwasher Number of devices ~
15
At least one electric
vehicle

How do homeowners leverage the PV gains?
45
Efficiency measures New services
LOW demand-side
characteristics
Manual R value ~ 16 Code minimum
dishwasher
Number of devices ~ 5 No Electric vehicle
HIGH demand-side
characteristics
Programmable R value ~ 36 EnergyStar Dishwasher Number of devices ~
15
At least one electric
vehicle

How do homeowners leverage the PV gains?
46
Efficiency measures New services
LOW demand-side
characteristics
Manual R value ~ 16 Code minimum
dishwasher
Number of devices ~ 5 No Electric vehicle
HIGH demand-side
characteristics
Programmable R value ~ 36 EnergyStar Dishwasher Number of devices ~
15
At least one electric
vehicle

How do homeowners leverage the PV gains?
Key findings:
�Houses with PV could achieve energy reductions with the appropriate level of technological efficiency.
�The impact of PV adoption on energy demand depends on the efficiency performance of the household
�Homeowners do not appear to leverage PV gains for appliances: ‘Saturation’effect.
�Houses might utilize PV gains for electronic devices but not Electric vehicles.
NOTE: ~90% of PV costs were subsidized for our sample
47

Acknowledgements
� This work was funded by
� The University of Texas at Austin
� The data was provided by
� The Pecan Street Research Institute
� Academic Advisor:
� Dr. Michael Blackhurst
48


Marginal Efficiency Gains Within Space
Conditioning50
Elec Use ~ 640 kWh/
month
Elec Use ~ 844 kWh/
month Elec Use ~ 829 kWh/
month
Elec Use ~ 712 kWh/
month
6.2
6.3
6.4
6.5
6.6
6.7
6.8
6.9
7
Fitted
valu
es o
f Lo
g(E
lect
rici
ty C
onsu
mption)
Windows:
0= Single pane windows 1=Multipane window
Houses with Manual Thermostat Houses with Programmable Thermostat
0 1
Elec Use~ 829
kWh/month
Elec Use~ 712
kWh/month
(2)
(1)
Elec Use~ 640
kWh/month
(1) Houses with single pane windows consume more electricity (∆Elec~189
kWh/month) if they have a programmable thermostat as well.
Elec Use~ 844
kWh/month
(2) Houses with multipane windows and a programmable thermostat decrease their
electricity consumption (∆Elec~ -132 kWh/month).
Manual Thermostat Programmable Thermostat

Efficiency Gains for New
Services51
Eelec Use~677 kWh/
month
Eelec Use~1424 kWh/
month
Eelec Use~736 kWh/
month
Eelec Use~728 kWh/
month
6.2
6.4
6.6
6.8
7
7.2
7.4
7.6
7.8
Fit
ted
va
lues
of
Lo
g(E
lect
ric
ity
Co
nsu
mp
tio
n)
Vehicles:
0= Houses with no Electric Vehicle
1=Houses with Electric Vehicle
Houses with Manual Thermostat Houses with programmable thermostat
(
1
)
(2)
10

Households’ responses to solar energy
gains 52
Eelec Use~677 kWh/
month
Eelec Use~1424 kWh/
month
Eelec Use~736 kWh/
month
Eelec Use~728 kWh/
month
6.2
6.4
6.6
6.8
7
7.2
7.4
7.6
7.8
Fit
ted
va
lues
of
Lo
g(E
lect
rici
ty C
on
sum
pti
on
)
Vehicles:
0= Houses with no Electric Vehicle
1=Houses with Electric Vehicle
Houses with Manual Thermostat Houses with programmable thermostat
(1)
(2)
(1) Houses with no Electric Vehicle consume more
electricity (∆elec~59 kWh/month) if they have
a programmable thermostat as well.
(2) Houses with an Electric
Vehicle and a programmable thermostat
decrease their electricity consumption (∆Elec~ -696 kWh/month).
10

Households’ responses to solar energy
gains 53
1
Eelec Use~ 609 kWh/month
Eelec Use~ 793 kWh/month Eelec Use~ 746 kWh/month
Eelec Use~ 725 kWh/month
6.1
6.2
6.3
6.4
6.5
6.6
6.7
6.8
6.9
0 1
Fit
ted
valu
es o
f L
og
(Ele
ctri
city
Con
sum
pti
on
)
Space Conditioning:
0= Houses with no Programmable Thermostat
1= Houses with Programmable Thermostat
Houses with no Photovoltaic panels
Houses with Photovoltaic panels
(1)
(2)
(1) Houses with no programmable thermostat consume more electricity
(∆elec~ 137 kWh/month) if they have a solar panels
as well.(2) Houses with solar panels
and a programmable thermostat decrease their electricity consumption
(∆Elec~ -66 kWh/month).

The State of knowledge
o No quantitative literature
o Very limited qualitative literature:
o Kierstead (2007): few self-reported behavioral changes
o Erge et al. (2001): No difference in electricity consumption
o Haas et al. (1999): high-energy consumers (> 3500 kWh per year)
reduced overall demand after installation of PV whereas low
consumers increased their demand
o McAndrews (2011):nearly 80% self-report no change in energy
demands

Research questions
o Limitations: Self-reported data, energy consumption is not
evaluated quantitatively, short-term analysis.
o Question: How do homeowners leverage the PV gains?
o Displace conventional electricity?
o Utilize for conventional end-uses (efficiency measure)?
o Utilize for new services?
o Notes:
o ~90% of PV costs were subsidized for our sample