1 a strategy for fiscal adjustment when the recovery takes hold paolo mauro november 17, 2009...
TRANSCRIPT

1
A Strategy for Fiscal A Strategy for Fiscal Adjustment When the Adjustment When the Recovery Takes HoldRecovery Takes Hold
Paolo MauroPaolo Mauro
November 17, 2009November 17, 2009BangkokBangkok

2

3
Fiscal outlook in advanced G-20 countries (all variables in percent of GDP)
-12
-10
-8
-6
-4
-2
0
-7-6-5-4-3-2-10123
60
70
80
90
100
110
120
130
2000 01 02 03 04 05 06 07 08 09 10 11 12 13 14
General Government Gross Debt
2000 01 02
03 04 05 06 07 08 09 10 11 12 13 14
2000 01 02 03 04 05 06 07 08 09 10 11 12 13 14
Overall balance
Cyclically-adjusted primary balance
Primary balance

4
What’s driving the change in the deficit in the advanced G20 economies?
• 6½ percentage points of GDP from 2007 to 2010
• Fiscal stimulus: 1½ percent of GDP• Automatic stabilizers: ~ 2½ percent • Other structural change: ~ 2½ percent
– Expenditure increases: ~ 1½ percent– Revenue losses: ~ 1 percent
• Losses on financial sector support:– 0.8 percent of GDP in 2009 (U.S., Japan)

5
Decomposition of Decomposition of government debt government debt
increase, 2007 - 2014increase, 2007 - 2014(Total debt increase: 40 percent of
GDP)
Financial Support
(4.9)
(3.3)
Fiscal Stimulus
(11.9)
Automatic Stabilizers
Assets and Commodity Prices
(9.3)
Other
(4.5) Higher Interest Payments
(5.9)
6
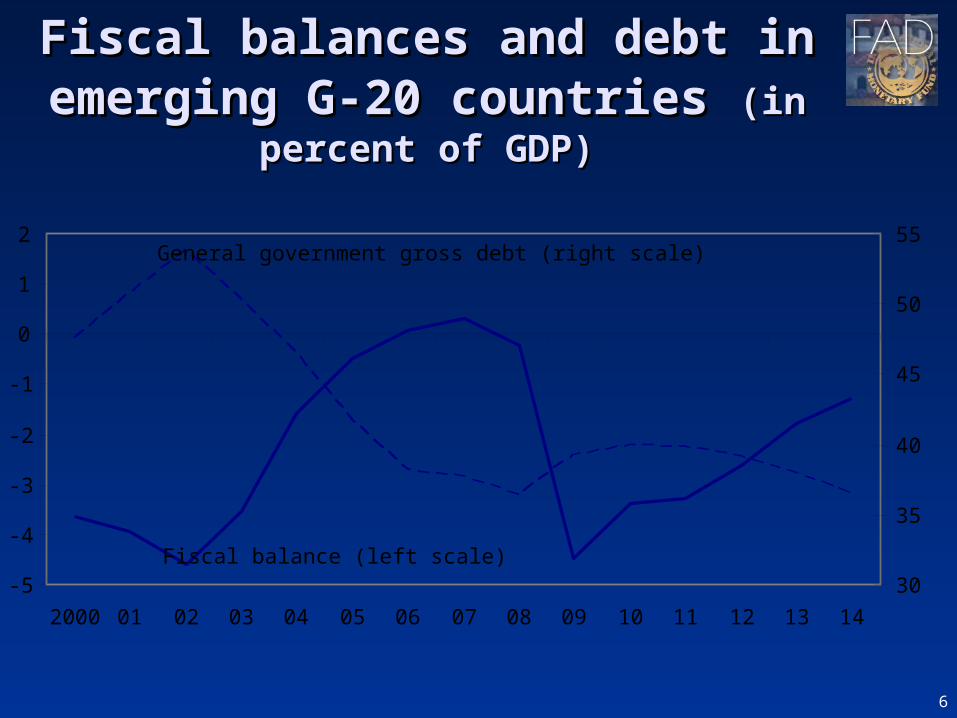
Fiscal balances and debt in Fiscal balances and debt in emerging G-20 countriesemerging G-20 countries (in (in
percent of GDP)percent of GDP)
-5
-4
-3
-2
-1
0
1
2
2000 01 02 03 04 05 06 07 08 09 10 11 12 13 14
30
35
40
45
50
55General government gross debt (right scale)
Fiscal balance (left scale)

7
Fiscal challenge: Stylized Fiscal challenge: Stylized factsfacts
The scale of the problem is The scale of the problem is unprecedentedunprecedented
Demographic trends are unfavorableDemographic trends are unfavorable Financial sector support only a small Financial sector support only a small
part of the increase in gross debt.part of the increase in gross debt.

8
Are markets worried?Are markets worried?Maybe; maybe not…yet? Maybe; maybe not…yet?
Sovereign CDS Spreads and EMBI Index
0
100
200
300
400
500
600
700
800
Ju
n-0
8
Ju
l-0
8
Au
g-0
8
Sep
-08
Oc
t-08
No
v-0
8
De
c-0
8
Jan
-09
Fe
b-0
9
Mar
-09
Ap
r-0
9
May
-09
Ju
n-0
9
Ju
l-0
9
Au
g-0
9
Sep
-09
Oc
t-09
No
v-0
9 0
40
80
120
160
200
EMBI Global Index 3/(lhs)
Emerging Markets CDS Index (lhs)
Advanced EconomiesCDS Index (rhs)
Sources: Markit, CMA, Datastream, and IMF Staff calculations
JAP
ITA
DEU
FRA
USA
GBR
-10 0 10 20 30 40 50 60 70
`
Change in Sovereign CDS Spreads since 2007 1/
1/ Change between October 2009 average and 2007 average.
Some signs of regularization… …some signs of differentiation?

9
Should we be concerned?Should we be concerned?Can’t we live with high debt?Can’t we live with high debt?
High debt may lead to high interest ratesHigh debt may lead to high interest rates Interest rates are historically lowInterest rates are historically low 40 percent increase in debt => 2 percent rise in rates?40 percent increase in debt => 2 percent rise in rates? Crowding out of other spendingCrowding out of other spending
Markets might react abruptly if they worry that governments Markets might react abruptly if they worry that governments do not have a plan for fiscal adjustmentdo not have a plan for fiscal adjustment
Reduced capacity to respond to future shocksReduced capacity to respond to future shocks
High debt may lead to slow growth? High debt may lead to slow growth?
10
Fiscal exit strategy: What Fiscal exit strategy: What should not be in the should not be in the
strategy strategy Inflation…Inflation… ...can raise seigniorage…but fiscal ...can raise seigniorage…but fiscal
relief is modestrelief is modest ……can reduce the real value of debtcan reduce the real value of debt But interest rates would rise with But interest rates would rise with
refinancing at higher ratesrefinancing at higher rates Inflation ↑ (6%) Inflation ↑ (6%) debt ratio ↓ (8- debt ratio ↓ (8-
9%)9%)
11
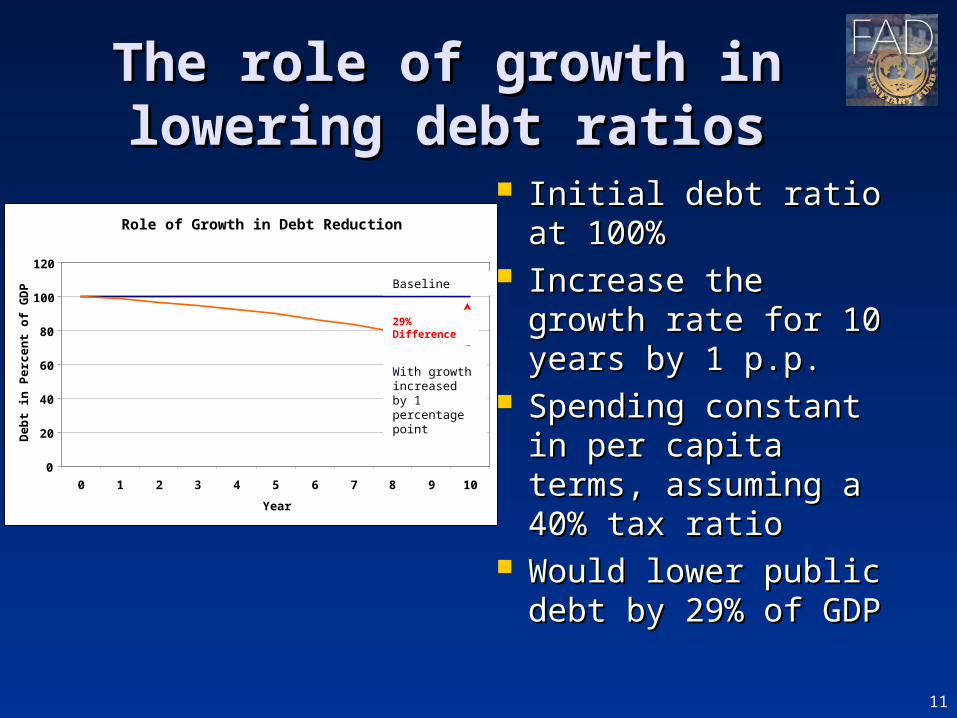
The role of growth in The role of growth in lowering debt ratioslowering debt ratios
Initial debt ratio at Initial debt ratio at 100%100%
Increase the growth Increase the growth rate for 10 years by 1 rate for 10 years by 1 p.p.p.p.
Spending constant in Spending constant in per capita terms, per capita terms, assuming a 40% tax assuming a 40% tax ratioratio
Would lower public Would lower public debt by 29% of GDPdebt by 29% of GDP
Role of Growth in Debt Reduction
0
20
40
60
80
100
120
0 1 2 3 4 5 6 7 8 9 10
Year
Deb
t in
Per
cen
t of
GD
P
29% Difference
With growth increased by 1 percentage point
Baseline

12
AssumptionsAssumptions
Goal: debt ratios < 60% of GDP by Goal: debt ratios < 60% of GDP by 20302030
Adjustment in the primary balance Adjustment in the primary balance will start in 2011will start in 2011
Adjustment will last 10 years; Adjustment will last 10 years; constant primary balance afterwardsconstant primary balance afterwards

13
General government gross debt-to-GDP ratio
0.00
20.00
40.00
60.00
80.00
100.00
120.00
2007
2008
2009
2010
2011
2012
2013
2014
2015
2016
2017
2018
2019
2020
2021
2022
2023
2024
2025
2026
2027
2028
2029
2030
-10.00
-8.00
-6.00
-4.00
-2.00
0.00
2.00
4.00
6.00
2007
2008
2009
2010
2011
2012
2013
2014
2015
2016
2017
2018
2019
2020
2021
2022
2023
2024
2025
2026
2027
2028
2029
2030
Cyclically- adjusted primary balance
Primary balance
Overall balance
Fiscal Balances in Advanced Economies (in percent of GDP)

14
Required Fiscal Adjustment in Structural Primary Balance Between 2010 and 2020
Aus
tral
ia
Aus
tria
Bel
gium
Can
ada
Den
mar
k
Fin
land
Fra
nce
Ger
man
y
Gre
ece
Icel
and
Irel
and
Ital
y
Japa
n
Kor
ea
Net
herl
ands
New
Zea
land
Por
tuga
l
Spa
in
Sw
eden
Uni
ted
Kin
gdom
Uni
ted
Sta
tes
-20
-15
-10
-5
0
5
10
Per
cent
of
GD
PFor most advanced economies, For most advanced economies,
major fiscal adjustment is major fiscal adjustment is requiredrequired
15
Why Is So Much Adjustment Needed?Why Is So Much Adjustment Needed?
To reverse discretionary stimulusTo reverse discretionary stimulus
To offset higher interest payments To offset higher interest payments
To address already-high structural deficits in some To address already-high structural deficits in some countriescountries
To address rising spending pressures not linked to To address rising spending pressures not linked to crisiscrisis
To account for revenues that may not come backTo account for revenues that may not come back

16
An optimistic angle on a big problemAn optimistic angle on a big problem
The scale of adjustment is large…The scale of adjustment is large…
… … But Not UnprecedentedBut Not Unprecedented 20+ advanced economies have improved their structural 20+ advanced economies have improved their structural
primary balances by at least 5 percentage points in primary balances by at least 5 percentage points in sustained adjustments in the past four decades.sustained adjustments in the past four decades.
10 have achieved adjustments of at least 10 percent.10 have achieved adjustments of at least 10 percent.
Primary adjustment was the bedrock of these effortsPrimary adjustment was the bedrock of these efforts Inflation is Inflation is notnot the answer the answer

17
Examples of large fiscal Examples of large fiscal adjustmentsadjustments
Episodes of Significant Fiscal Consolidation (Emerging Economies)
0 5 10 15 20 25
Romania 1996 to 1999
Turkey 1997 to 2001
Romania 1979 to 1984
Paraguay 1981 to 1990
Panama 1982 to 1986
Bulgaria 1993 to 1996
Hungary 1993 to 1996
Morocco 1982 to 1988
Chile 1999 to 2007
Slovak Republic 1992 to 1995
Lebanon 2000 to 2006
Egypt 1984 to 1987
Lebanon 1996 to 1999
Czech Republic 1995 to 1999
Jamaica 1997 to 2000
Turkey 1987 to 1990
Mexico 1981 to 1984
Jordan 1987 to 1990
Tunisia 1983 to 1989
Egypt 1991 to 1994
Jamaica 1983 to 1989
Georgia 1994 to 2004
Structural Balance in % of GDP
22 Emerging Economies
Episodes of Significant Fiscal Consolidation (Advanced Economies)
0 2 4 6 8 10 12 14 16 18 20
Japan1978 to1990
United Kingdom 1993 to 2000
Cyprus 2003 to 2007
Canada1985 to 1999
Belgium 1983 to 1998
Israel 1980 to 1983
China,P.R.:Hong Kong 2001 to 2007
Greece 1989 to 1995
Denmark 1982 to 1986
Sweden 1980 to 1987
Finland 1993 to 2000
Sweden 1993 to 2000
Ireland 1978 to 1989
Structural Balance in % of GDP
13 Advanced Economies

18
How fiscal adjustment How fiscal adjustment could be attainedcould be attained
Not renewing the Not renewing the stimulus measuresstimulus measures
Reform entitlements to fix Reform entitlements to fix as share of GDP as share of GDP (otherwise would rise by (otherwise would rise by 3-4% of GDP by 2030)3-4% of GDP by 2030)
Target stable real primary Target stable real primary spending per capita spending per capita (excluding entitlements)(excluding entitlements)
Tax measures: Broaden Tax measures: Broaden the tax base, correct the tax base, correct externalities (carbon externalities (carbon taxes ½ % of GDP)taxes ½ % of GDP)
8% Improvement in Cyclically Adjusted Primary Balance
Fiscal Stimulus Expiring (1.5%)
Freeze in Real
Spending (3.5%)
Tax Measures (3%)
0
1
2
3
4
5
6
7
8
9
Per
cen
t of
GD
P

19
ConclusionsConclusions
Too soon to tighten fiscal policiesToo soon to tighten fiscal policies NotNot too soon to: too soon to:
1.1. Communicate strategies and measures Communicate strategies and measures to ensure fiscal solvencyto ensure fiscal solvency
2.2. Implement actions without a negative Implement actions without a negative impact on demand (transparency and impact on demand (transparency and medium-term fiscal frameworks) medium-term fiscal frameworks)
3.3. Substantive reforms of entitlements Substantive reforms of entitlements with an impact only in the medium term with an impact only in the medium term should start nowshould start now