1 a stock market investor has $500 to spend and is considering purchasing an option contract on 1000...
TRANSCRIPT
1
A stock market investor has $500 to spend and is considering purchasing an option contract on 1000 shares of Apricot Computer. The shares themselves are currently selling for $28.50 per share. Apricot is involved in a lawsuit, the outcome of which will be known within a month. If the outcome is in Apricot’s favor, analysts expect Apricot’s stock price to increase by $5 per share. If the outcome is unfavorable, then the price is expected to drop by $2.75 per share. The option costs $500, and owning the option would allow the investor to purchase 1000 shares of Apricot stock for $30 per share. Thus, the investor buys the option and Apricot prevails in the lawsuit, the investor would make an immediate profit. Asides from purchasing the option, the investor could (1) do nothing and earn about 8% on his money, or (2) purchase $500 worth of Apricot shares.
Problem 4.15

2
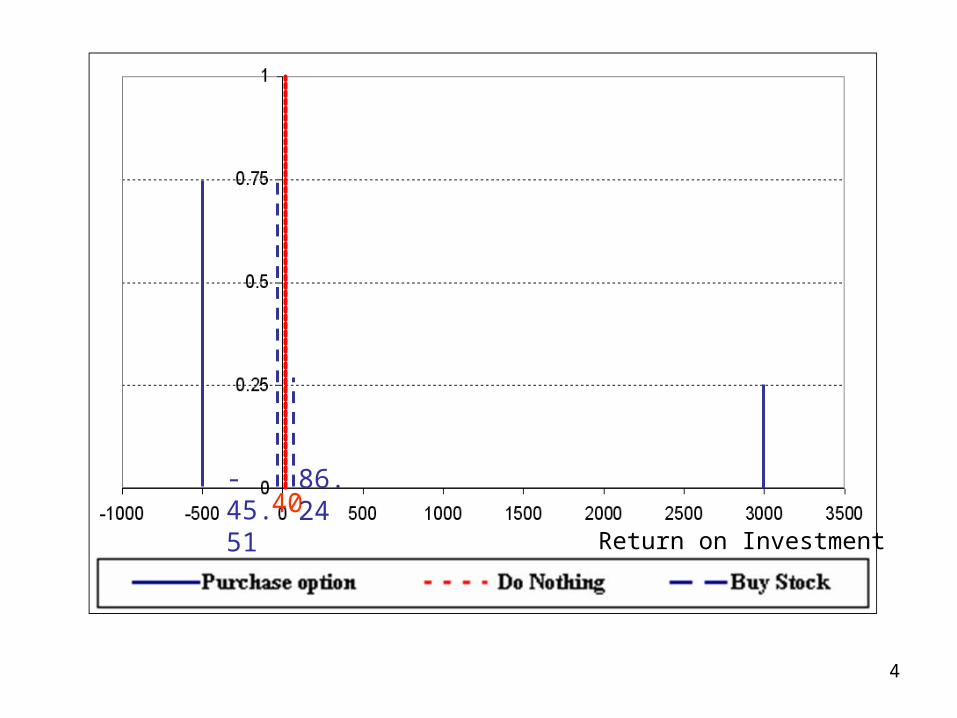
a. Construct cumulative risk profiles for the three alternatives, assuming Apricot has a 25% chance of winning the lawsuit. Can you draw any conclusions?
To construct risk profiles (cumulative or not cumulative), we have to first draw the decision tree
Purchase Option
Favorable Unfavorable
$3,000
-$500
-$500
$40 Do Nothing
Buy Stock
Favorable Unfavorable
$86.24
1000*($33.50-$30.00)=$3,500 $0
$500*8%=$40
-17*$28.5= -$484.5
17*$33.50 + $15.5*8%=$570.74 17*$25.75 + $15.5*8%=$438.99
-$45.51
(0.25)
(0.75)
(0.25)
(0.75)
Lawsuit Outcome
Lawsuit Outcome
Assumptions: 1) 8% is the monthly interest rate; 2) the investor can only purchase an integer number of shares and put the remaining money to savings

3
Decision Strategies:
1) Purchase option
2) Do nothing
3) Buy stock
Favorable Unfavorable
$3,000
-$500
(0.25)
(0.75)
Purchase Option Payoffs-$500$3,000
Probabilities0.750.25
$40 Do Nothing Payoffs
$40Probabilities
1
Buy Stock
Favorable Unfavorable
$86.24
-$45.51
(0.25)
(0.75)
Payoffs-$45.51$86.24
Probabilities0.750.75
4
40-45.51
86.24
Return on Investment

5
40-45.51
86.24
Therefore, no immediate conclusions can be drawn since no one alternative dominates another

6
b. If the investor believes that Apricot stands a 25% chance of winning the lawsuit, should he purchase the option? What if he believes the chance is only 10%? How large does the probability have to be for the option to be worthwhile?
Assuming 8% is the monthly interest rate and let p be the probability that Apricot will win the lawsuit
1) The expected monetary value associated with purchasing the option is:EMV(Purchase Option) = 3,000p – 500(1 – p) = 3,500p – 500
2) The expected monetary value associated with doing nothing is:EMV(Do Nothing) = 40
3) The expected monetary value associated with purchasing the stock is:EMV(Buy Stock) = 86.24p – 45.51(1 – p) = 131.75p – 45.51.
When p=0.25, EMV(Purchase Option) = $375, EMV(Do Nothing)=$40, EMV(Purchase Stock) = $-12.57
When p=0.1, EMV(Purchase Option) = -$150, EMV(Do Nothing)=$40, EMV(Purchase Stock) = $-32.33
EMV(Purchase Option) > EMV(Do Nothing) 3500p-500>40 p>0.154
EMV(Purchase Option) > EMV(Buy Stock) 3500p-500>131.75p-45.51 p>0.135 p>0.154

7
Job Offers
Robin Pinelli is considering three jobs. In trying to decide which to accept, Robin has concluded that three objectives are important to this decision. First, of course, is to maximize disposable income – the amount left after paying for housing, utilities, taxes, and other necessities. Second, Robin likes cold weather and enjoys winter sports. The third objective relates to the quality of the community. Being single, Robin would like to live in a city with a lot of activities and a large population of single professionals.
Developing attributes for these three objectives turn out to be relatively straightforward. Disposable income can be measured directly by calculating monthly take-home pay minus average monthly rent (being careful to include utilities) for appropriate apartment. The second attribute is annual snowfall. For the third attribute, Robin has located a magazine survey of large cities that scores those cities as places for single professionals to live. Although the survey is not perfect from Robin’s point of view, it does capture the main elements of her concern about the quality of the singles community and available activities. Also, all three of the cities under consideration are included in the survey.

8
Income
Rating
Snowfall
Rating
Magazine
Rating
Madison Publishing
$1,500
100(0.15)
MPR Manufacturing
0
(0.6)
Disposable
Income
200(0.70) 400(0.15) 100(0.15) 200(0.70) 400(0.15)
$1,300 (0.4)
Snowfall
75
7575
2525
100 150(0.15) 230(0.70) 320(0.15)
25
100100
Pandemonium Pizza0
25
10050
2550
37.5
100
57.580
100
56
5656
5656
056
00
$1,600
$1,200
0
Magazine
50
75
95
* The gray numbers are not in the original decision tree shown in the textbook

9
1. Verify the ratings in the consequence matrix are proportional scores
To do a tradeoff analysis, we have to first make sure different attributes have comparable measuresConvert the measures of three attributes – income, snowfall, and magazine score – to the scale of 0-100.
Income: Set $1600 = 100, $1200 = 0.
For an intermediate value x , its converted score = (x-min)/(max-min) = (x-1200)/(1600-1200)When x =$1300, (1300-1200)/(1600-1200)=25%, so its converted score is 25. When x =$1500, (1500-1200)/(1600-1200)=75%, so its converted score is 75.
Snowfall: set 400 =100, 0=0.
For an intermediate value x , its converted score = (x-0)/(400-0) When x = 100, (100-0)/(400-0)=25%, so its converted score is 25.When x = 150, (150-0)/(400-0)=37.5%, so its converted score is 37.5.When x = 200, (200-0)/(400-0)=50%, so its converted score is 50.When x = 230, (230-0)/(400-0)=57.5%, so its converted score is 57.5.When x = 320, (320-0)/(400-0)=80%, so its converted score is 80.

10
Magazine Score: Set 95=100, 50=0For an intermediate value x , its converted score = (x-50)/(95-50) When x = 75, (75-50)/(95-50)≈56%, so its converted score is about 56.

11
3. After considering the situation, Robin concludes that the quality of he city is most important, the amount of snow is next, and third is income. Furthermore, Robin concludes that the weight for the magazine rating in consequence matrix should be 1.5 times the weight for the snowfall rating and three times as much as the weight for the income rating. Use this information to calculate the weight for the three attributes and do calculate overall scores for all of the end of branches in the decision tree.
Denote the weights of income, snowfall or magazine as Ki , Ks, and Km, respectively.
Km = 1.5Ks, Km = 3Ki, and Km+ Ks + Ki = 1.
Solving the equations, we can getKm = 1/2, Ks = 1/3, and Ki = 1/6

12
Income Snowfall Magazine Overall
Weights: 1/6≈0.17 1/3≈0.33 ½=0.50 Score
Ratings: 75 25 56 49
75 50 56 57
75 100 56 74
Madison 25 25 56 41
25 50 56 49
25 100 56 66
100 37.5 0 29
MPR 100 57.5 0 36
100 80 0 43
Pandemonium 0 0 100 50
13
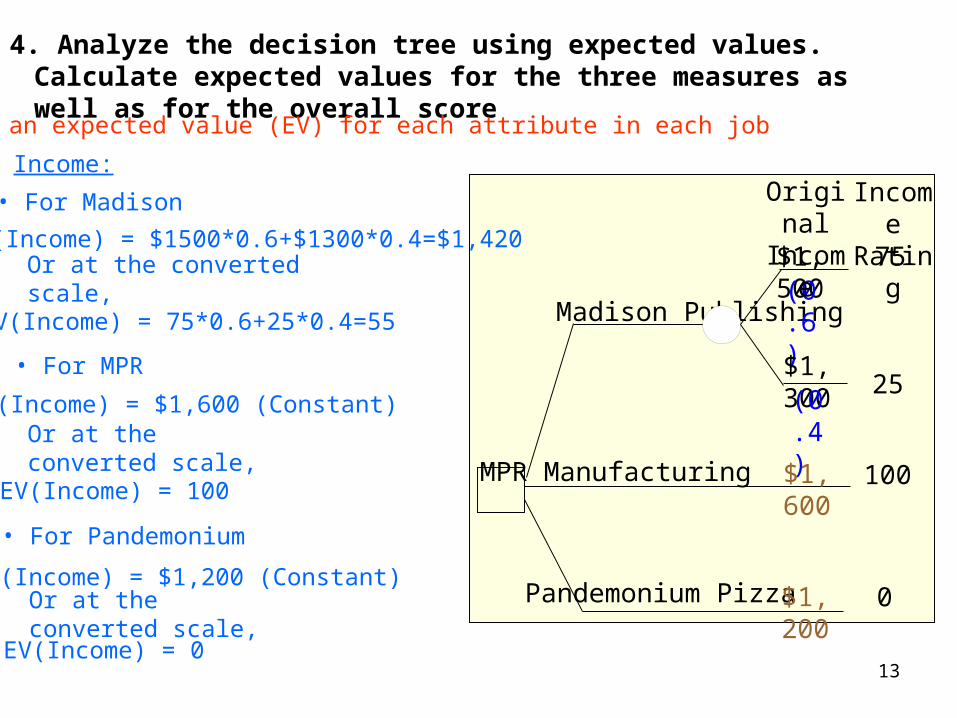
4. Analyze the decision tree using expected values. Calculate expected values for the three measures as well as for the overall score
There is an expected value (EV) for each attribute in each job
Income:
• For Madison
Madison Publishing
$1,500
MPR Manufacturing
(0.6)
$1,300 (0.4)
Pandemonium Pizza
$1,600
$1,200
0
75
100
25
Income
Rating
Original
Income
EV(Income) = $1500*0.6+$1300*0.4=$1,420
Or at the converted scale,
EV(Income) = 75*0.6+25*0.4=55
• For MPR
EV(Income) = $1,600 (Constant)
Or at the converted scale,
EV(Income) = 100
• For Pandemonium
EV(Income) = $1,200 (Constant)
Or at the converted scale,
EV(Income) = 0

14
Madison Publishing
100(0.15)
MPR Manufacturing
(0.6)
200(0.70) 400(0.15) 100(0.15) 200(0.70) 400(0.15)
(0.4)
Snowfall
150(0.15) 230(0.70) 320(0.15)
Pandemonium Pizza 0
Snowfall
Rating
0
25
100
50
2550
37.5
100
57.580
Snowfall:
• For Madison EV(Snowfall) = (100*0.15+200*0.7+400*0.15)*0.6+ (100*0.15+200*0.7+400*0.15)*0.4 =215
Or at the converted scale,
• For MPR
EV(Snowfall) =150*0.15+230*0.7+320*0.15=231.5Or at the converted scale,
• For Pandemonium
EV(Snowfall) = 0 (Constant) Or at the converted scale, EV(Snowfall) = 0
EV(Snowfall) = (25*0.15+50*0.7+100*0.15)*0.6+ (25*0.15+50*0.7+100*0.15)*0.4 =53.75
EV(Snowfall) =37.5*0.15+57.5*0.7+80*0.15=57.875
100*0.15+200*0.7+400*0.15U1
E(U1)=
U2
100*0.15+200*0.7+400*0.15E(U2)=
UE(U)=0.6*E(U1)+0.4*E(U2)

15
Magazine Score:
• For Madison EV(magazine) = 50 (Constant) Or at the converted scale, EV(magazine) = 56
• For MPR EV(magazine) = 75 (Constant) Or at the converted scale, EV(magazine) = 0
• For Pandemonium EV(magazine) = 95 (Constant) Or at the converted scale, EV(magazine) =100
Overall Score:
Madison Publishing
MPR Manufacturing
(0.6)
(0.15)
(0.15)
(0.4) (0.
15)(0.70)(0.15)
Pandemonium Pizza
(0.15)(0.70)
(0.15)(0.70)
Overall
Score
50
49
7457
4149
2966
3643
U1
49*0.15+57*0.7+74*0.15E(U1)=
U2
41*0.15+49*0.7+66*0.15E(U2)=
UE(U)=0.6*E(U1)+0.4*E(U2)
• For Madison
EV(Overall) = (49*0.15+57*0.7+74*0.15)*0.6+ (41*0.15+49*0.7+66*0.15)*0.4 =55
• For MPR
EV(Overall) =29*0.15+36*0.7+43*0.15=36
• For Pandemonium
EV(Overall) = 50 (Constant)

16
5. Do a risk-profile analysis of the three cities. Create risk profiles for each of three attributes as well as the overall score. Does any additional insight arise from this analysis?
Decision Strategies:
1) Madison Publishing
2) MPR
3) Pandemonium
Income:
Madison Publishing
$1,500 (0.6)
$1,300 (0.4)
Income$1,300$1,500
Probabilities0.40.6
Income$1,600
Probabilities1
Income$1,200
Probabilities1

17
0
0.2
0.4
0.6
0.8
1
1000 1200 1400 1600 1800
Madison Publishing MPR Pandemonium
Risk Profiles of Income
18
0
0.2
0.4
0.6
0.8
1
1000 1200 1400 1600 1800
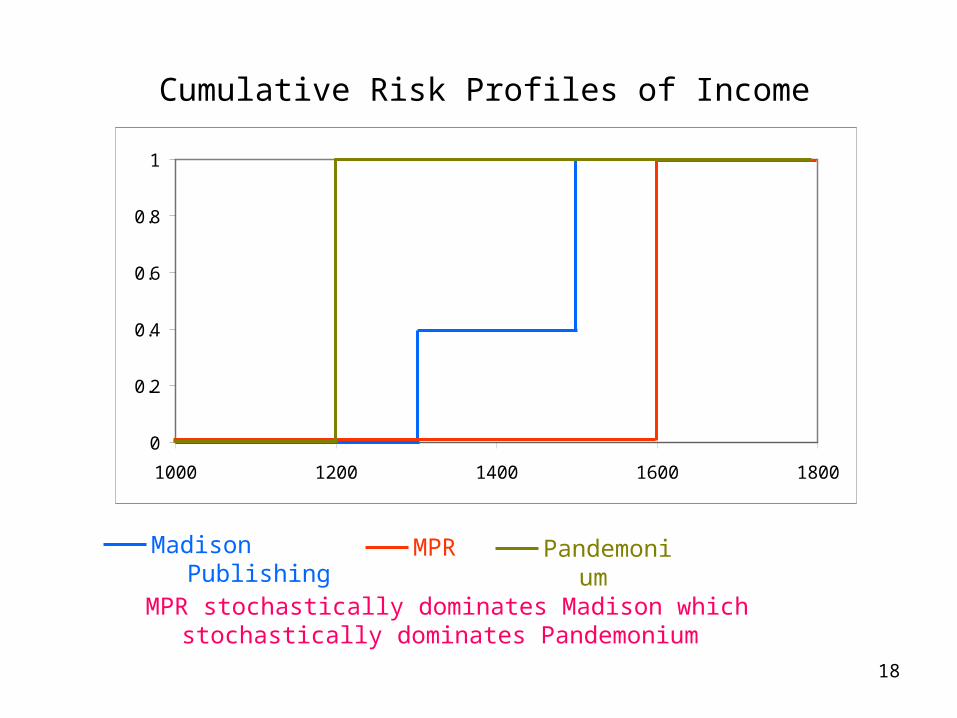
Cumulative Risk Profiles of Income
Madison Publishing MPR Pandemonium
MPR stochastically dominates Madison which stochastically dominates Pandemonium

19
Decision Strategies:
1) Madison Publishing
2) MPR
3) Pandemonium
Snowfall:
Madison Publishing
100(0.15)
(0.6)
200(0.70) 400(0.15) 100(0.15) 200(0.70) 400(0.15)
(0.4)
MPR Manufacturing 150(0.1
5) 230(0.70) 320(0.15)
Snowfall100200400
Probabilities0.6*0.15+0.4*0.15=0.150.6*0.70+0.4*0.70=0.700.6*0.15+0.4*0.15=0.15
Snowfall150230320
Probabilities0.150.700.15
Snowfall0
Probabilities1

20
Madison Publishing
0
0.2
0.4
0.6
0.8
1
-100 0 100 200 300 400 500
MPR Pandemonium
Risk Profiles of Snowfall

21
Cumulative Risk Profiles of Snowfall
Madison Publishing
0
0.2
0.4
0.6
0.8
1
-100 0 100 200 300 400 500
MPR Pandemonium
Both MPR and Madison stochastically dominates Pandemonium but no domination relation between MPR and Madison

22
Decision Strategies:
1) Madison Publishing
2) MPR
3) Pandemonium
Magazine Score:
Magazine50
Probabilities1
Magazine75
Probabilities1
Magazine95
Probabilities1

23
0
0.2
0.4
0.6
0.8
1
0 20 40 60 80 100
Risk Profiles of Magazine Score
Madison Publishing MPR Pandemonium

24
0
0.2
0.4
0.6
0.8
1
0 20 40 60 80 100
Cumulative Risk Profiles of Magazine Score
Pandemonium stochastically dominates MPR which stochastically dominates Madison
Madison Publishing MPR Pandemonium

25
Decision Strategies:
1) Madison Publishing
2) MPR
3) Pandemonium
Overall Score:
Madison Publishing (0.6)
(0.15)
(0.15)
(0.4)
(0.15)(0.70)
(0.15)(0.70)
49
7457
414966
MPR Manufacturing (0.15)(0.70)(0.15)
293643
Overall4149576674
Probabilities0.4*0.15=0.06
0.6*0.15+0.4*0.70=0.370.6*0.7=0.42
0.4*0.15=0.060.6*0.15=0.09
Overall293643
Probabilities0.150.700.15
Magazine50
Probabilities1

26
0
0.2
0.4
0.6
0.8
1
0 20 40 60 80 100
Risk Profiles of Overall Score
Madison Publishing MPR Pandemonium

27
0
0.2
0.4
0.6
0.8
1
0 20 40 60 80 100
Cumulative Risk Profiles of Overall Score
Madison and Pandemonium stochastically dominates MPR, but there is obvious domination relationship between Madison and Pandemonium
Madison Publishing MPR Pandemonium