1 a coordinated comprehensive plan for children and families in marion county creating a wellness...
TRANSCRIPT

1
A coordinated comprehensive plan
For children and families in
Marion County
Creating a wellness system for children and families . . .

2
Planning Process
Phase I - 2000 Client interviewsProvider surveyEarly Childhood Plan Phase II - 200119 High Level OutcomesStakeholder Discussions Community Forums
Phase II - 2002Measurement Plan Plan Update -
2004Changes in
community conditions
Progress on implementation

3
Planning Principles
1. Create a community-based, holistic approach
2. Assure family-centered practices3. Establish/maintain effective partnerships4. Utilize a balanced (SWOT) approach5. Include data6. Implement research-based accountability7. Promote innovation8. Reflect and incorporate diversity

4
Marion County’s Additional Planning Principles
1. Build on the Phase I plan2. Organize planning around the goal
areas in Building Results3. Engage education4. Emphasize analysis, priorities,
strategies

5
Three Goals for Marion County’s Children & Families Strong, nurturing families/
Caring communities and systems
Healthy, thriving children (Ages 0-8)
Healthy, thriving youth (Ages 9-18+)

6
Phase II Plan Organization
Executive Summary Narrative:
Overview and Goals 1-3
- SWOT (Strengths, Weaknesses, Opportunities, Threats)
- Priorities and Strategies- Rationale
Data Portraits- Trends/Statistics/Analysis
1. FAMILIES/ COMMUNITIES
2. YOUNG CHILDREN (0-8)
3. YOUTH (9-18+)
Appendices- Phase I Portions- Service Summaries- List of References- Inclusion Matrix

7
VISION STATEMENT
A community where …Everyone is committed to the well-being of
childrenFamilies are nurturedAll community members are healthyDiversity is honoredPeople live and work together, encouraging
and supporting one another

8
An Overview of Marion County Families
Population increase: 24.7% since 1990
75% urban, 3.1% on farms Families with children: 34.5% of
population Hispanic population accounts for
17.1% of total population More Oregonians over age 70 than
teenagers 7 state correctional institutions +
State Hospital

9
Overview: Race/Ethnicity
%
Change1990-1998
TOTAL 284,834 275,692 228,483 204,692 20.60%White 232,469 242,889 201,218 188,766 20.70%Black 2,539 2,447 2,039 1,412 20.00%Native American 4,111 3,562 2,970 2,176 19.90%Asian/Pacific Islanders 6,019 4,648 3,874 2,371 20.00%Hispanic 48,714 21,824 18,225 9,750 19.70%All Non-White *** *** 27,265 15,906
2000 1998* 1990** 1980**

10
Overview: Communities1-Apr-00 1-Apr-90 Change
% Change
Marion County 284,834 228,483 56,351 24.70%Aumsville 3,003 1,650 1,353 82.00%Aurora 655 567 88 15.50%Detroit 262 331 -69 -20.80%Donald 608 316 292 92.40%Gates* 471 499 -28 -5.60%Gervais 2,009 992 1,017 102.50%Hubbard 2,483 1,881 602 32.00%Idanha* 232 289 -57 -19.70%J efferson 2,487 1,805 682 37.80%Keizer 32,203 21,884 10,319 47.20%Mt. Angel 3,121 2,778 343 12.30%St. Paul 354 322 32 9.90%Salem* 136,924 107,793 29,131 27.00%Scotts Mills 312 283 29 10.20%Silverton 7,414 5,635 1,779 31.60%Stayton 6,816 5,011 1,805 36.00%Sublimity 2,148 1,491 657 44.10%Turner 1,199 1,281 -82 -6.40%Woodburn 20,100 13,404 6,696 50.00%Unincorporated 62,033 72,919 -10,886 -14.90%

11
GOAL 1: Strong, Nurturing Families
HIGH LEVEL OUTCOMES #1 - Reduce adult substance
abuse #2 - Reduce domestic violence #3 - Reduce poverty #4 - Child maltreatment #19 - Community engagement

12
Adult Substance Use
Oregon Marion
15.28%
16.04%
14.00%
14.50%
15.00%
15.50%
16.00%
16.50%
17.00%
Adults Who Abuse or Depend on AlcoholSource: Oregon Household Treatment Need Survey, 1999

13
Domestic ViolenceHigh Level Outcome #2: Domestic Violence
Arrests of Partners: Rate Per 1,000 adults
0
2
4
6
8
10
12
14
Oregon 0.78 6.03 8.01 5.65 5.49 4.59 7.4
Marion 0.88 5.51 13.34 7.21 6.78 4.31 7.2
94 95 96 97 98 99 2000

14
% With Incomes Below Federal Poverty Level
12.112.513.4
14.9
12.8
14
11.6
12.9
11
14.1
11
13.5
0
2
4
6
8
10
12
14
16
1990 1991 1992 1993 1994 1995 1996 1997 1998 1999
Poverty
Oregon
Marion

15
Child Maltreatment
Measure #4: Unduplicated rate of children who are reported to SCF for maltreatment per 1,000 children (0-17)
05
1015202530354045
Ra
te p
er
1,0
00
ch
ild
ren
Oregon
Marion
Oregon 11.5 11.0 10.1 10.0 10.2 11.8 12.3 13.5 12.2 9.6 9.7
Marion 9.8 9.0 9.3 9.2 9.1 12.2 13.1 14.0 13.2 10.0 12.4
1992 1993 1994 1995 1996 1997 1998 1999 2000 2001 2002

16
Client InterviewsSummer 2000 - Phase I
What services have been most helpful to you?
How did you learn about services you’ve participated in?
Have you experienced any problems getting services?
Are there services you need that aren’t available to you?
How do people treat you? Two wishes: what would you change?

17
Strengths (Client Surveys)
Information WIC Healthy Start Oregon Health Plan AFS Energy Assistance One-on-one
assistance with workers (Family Building Blocks & Healthy Start)
Bilingual staff Home visits - “Coming
to the home is a huge deal because your life can go on.” (EI mom)
Staff don’t make you feel stupid, they use common vocabulary
“I was in an abusive situation and you guys helped me with that.”

18
Phase II Strengths - Themes:
System Cooperation Common Grant
Application Lifespan Warmline Project Bond
Transportation CARTS- More access for rural
areas Information Sharing/
Data Collection CHIP Common Outcomes
Community Building Efforts
Community Progress Teams

19
Provider/Agency Survey(Summer 2000) Are there services that you identify
are needed by your clients that are not available locally?
What are the most common client needs identified by your staff?
Does your agency have a waiting list? How quickly can people get services
in your program(s)? In which communities can people
access your agency’s services?

20
Provider/Agency Survey: Most Frequently Mentioned “Missing Services” (Summer 2000)
Child Care (odd hours, weekends) (4) Transportation, Senior Transportation
(4) Respite (emergency, day) (4) Shelter (family, childless couples,
emergency) and crisis placements (5)

21
More... Primary care
physicians Dental care Housing vouchers Detox Prenatal care for
undocumented women
Emergency assistance
Placement, services for DD/dually diagnosed
Mental health services for preschoolers
Career/life planning for Spanish speakers
Housing for pregnant women, age 20+

22
Gaps and Barriers (Client Interviews):
“They don’t smile.” “I didn’t know who to call.” “I have a hard time being understood.” “I was told I didn’t qualify.” “Sometimes I miss appointments because
nobody can take me.” “I guess if I had two wishes I would wish I
wouldn’t have to come in here and ask you for help. That’s what I would want to change.”
“They need to offer more courage.”

23
Phase II Challenges - Themes:
Weak economy & unemployment
System Capacity
Meeting basic needs (highest level of hunger in the nation)
Integrated planning and service delivery
24
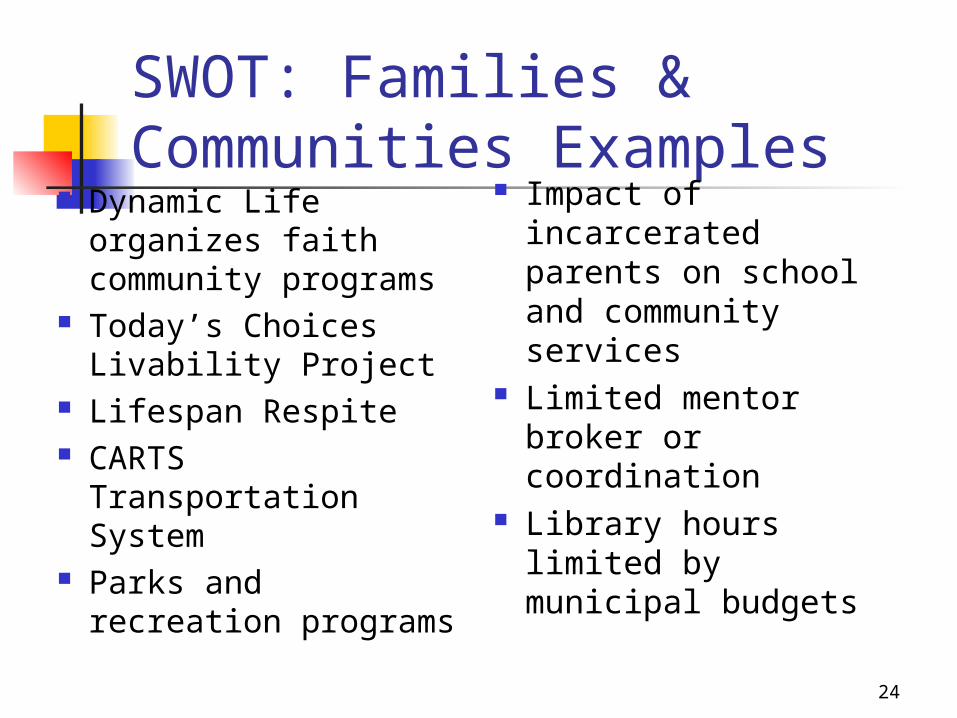
SWOT: Families & Communities Examples
Dynamic Life organizes faith community programs
Today’s Choices Livability Project
Lifespan Respite CARTS
Transportation System
Parks and recreation programs
Impact of incarcerated parents on school and community services
Limited mentor broker or coordination
Library hours limited by municipal budgets

25
Priority Areas:
Increase volunteerism and community engagement in the formal and informal service delivery system
Assure that services and informal supports are appropriate to diverse populations and cultures
Increase quality of, access to, and availability of, services and informal supports for all families
Increase the connections among economic development, workforce development, and social service delivery systems
Assess the impacts of community mobilization and service integration efforts

26
Strategy Examples: Engage communities in recognizing, accepting,
and helping to resolve their own problems Engage the faith community in a dialogue at
their tables around community issues related to families and children and common opportunities
Develop pools of volunteers to mentor people through systems
Encourage the development of community learning centers and family resource centers
Assure that families have access to information

27
GOAL 2: Healthy, Thriving Children (ages 0-8)
HIGH LEVEL OUTCOMES #5 - Improve prenatal care #6 - Increase immunizations #7 - Reduce alcohol, tobacco and
other drug use during pregnancy #8 - Increase child care availability #9 - Improve readiness to learn

28
Early Prenatal Care
Measure #5: Percent of babies whosemothers received early prenatal care
0%
20%
40%
60%
80%
100%
Oregon
Marion
Oregon 78.7%79.3% 79.0%78.5% 79.7%81.0% 80.2%80.9% 81.3%81.5% 81.6%
Marion 77.0%76.4% 76.9%76.4% 76.3%78.0% 75.0%74.1% 74.3%73.0% 73.7%
1992 1993 1994 1995 1996 1997 1998 1999 2000 2001 2002

29
Immunizations
Oregon
73%
76%
73%72%
74%
67%
60%
62%
64%
66%
68%
70%
72%
74%
76%
1994 1995 1996 1997 1998 1999
Percentage of adequately immunized two-year oldsSource: Oregon Health Division

30
Tobacco Use During Pregnancy
Measure #7a: Rate of infants (per 1,000) whose mothers used alcohol during pregnancy
0
20
40
60
80
100
120
Rat
e p
er 1
,000
bir
ths
Oregon
Marion
Oregon 30 30 30 20 20 16 19 14 10 13
Marion 30 40 40 20 30 12 26 17 9 9
1993 1994 1995 1996 1997 1998 1999 2000 2001 2002

31
Alcohol Use During Pregnancy
Measure #7a: Rate of infants (per 1,000) whose mothers used alcohol during pregnancy
0
20
40
60
80
100
120
Rate
per
1,0
00 b
irth
s
Oregon
Marion
Oregon 30 30 30 20 20 16 19 14 10 13
Marion 30 40 40 20 30 12 26 17 9 9
1993 1994 1995 1996 1997 1998 1999 2000 2001 2002
32
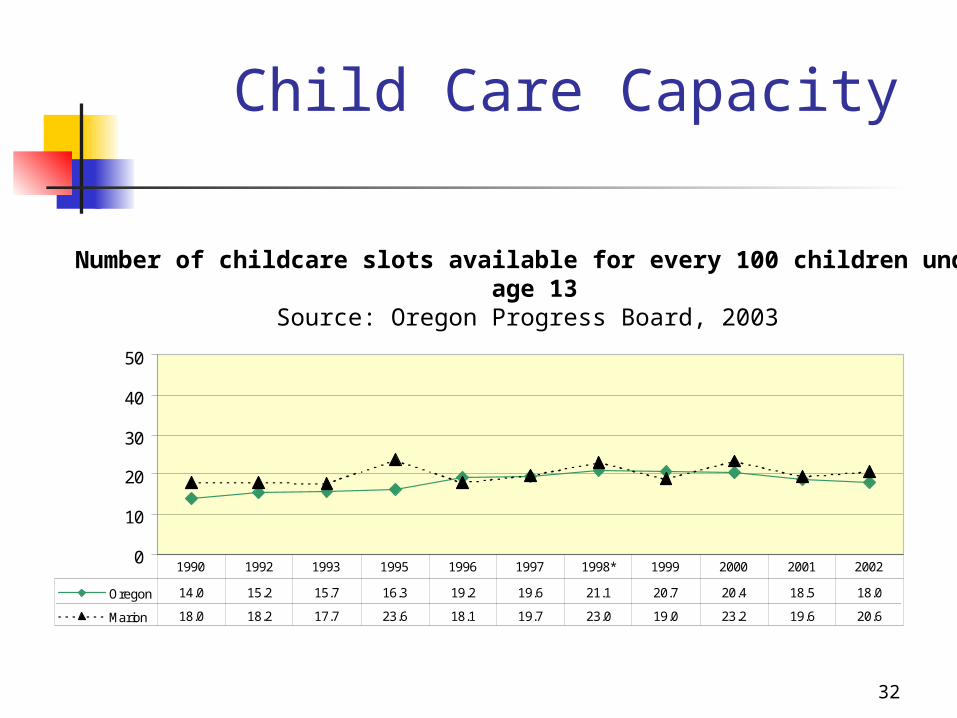
Child Care Capacity
0
10
20
30
40
50
Oregon 14.0 15.2 15.7 16.3 19.2 19.6 21.1 20.7 20.4 18.5 18.0
Marion 18.0 18.2 17.7 23.6 18.1 19.7 23.0 19.0 23.2 19.6 20.6
1990 1992 1993 1995 1996 1997 1998* 1999 2000 2001 2002
Number of childcare slots available for every 100 children under age 13
Source: Oregon Progress Board, 2003

33
Children Ready to Learn
58.1%60.7% 66.5%62.7%76.2%77.7%
0%
20%
40%
60%
80%
100%
Percentageof children entering
school ready to learn
1997 2000 2002
Year
Children Ready to Learn
Oregon Marion
Source: Department of Education

34
SWOT: Young Children and their Families (Examples)
Readiness to learn is a community priority
62.7% of young children meet all six “readiness” to learn areas (state ave. is 66.5%)
Few services for undocumented families
Lack of alcohol & drug treatment programs
Strong network of early childhood programs
- Healthy Start- Head Start- Early Intervention- Screenings and Immunizations - Prenatal Access Task Force- Child care provider training- Community Safety Net- Project BOND- Chemeketa Community College- Family Building Blocks

35
Priority Areas: Healthy growth
and development of young children
Supportive parenting
Childhood care and education

36
Strategy Examples: Integration of mental health services and
childhood care and education Universal access to prenatal care, especially
for diverse and hard-to-reach populations Implement 2-1-1 services Seek funding and implement Early Head
Start Implement child care provider education
reimbursement Assure protections and stable placements
for children at risk of abuse and neglect

37
Healthy, Thriving Youth
HIGH LEVEL OUTCOMES #10, 11, 12 - Decrease teen alcohol,
drug & tobacco use #13, 14, 15 - Decrease juvenile
arrests, maintain Youth Authority bed use, reduce recidivism
#16 - Reduce teen pregnancy #17 - Decrease youth suicide #18 - Reduce high school dropout rate

38
High School Dropout Rates
0%
5%
10%
15%
20%
25%
Oregon
Marion
Oregon 5.8% 5.7% 6.6% 7.4% 7.2% 6.7% 6.9% 6.6% 6.3% 5.3% 4.9%
Marion 5.3% 7.8% 9.2% 9.7% 9.5% 9.1% 8.7% 7.9% 8.3% 6.9% 6.5%
1992 1993 1994 1995 19961997
*1998 1999 2000 2001 2002

39
Teen Alcohol Use
2002 2000 1998
25.4%
28.4%
26.4%
25.3%26.0%
27.7%
22.0%
23.0%
24.0%
25.0%
26.0%
27.0%
28.0%
29.0%
30.0%
Oregon Marion
Measure #10: 8th graders who reported using alcohol in the past 30 days
Source: Oregon Progress Board

40
Juvenile Crimes Against Property
Measure #13b: Juvenile arrest per 1,000 juveniles for crimes against property
0102030405060708090
100
Ra
te p
er
1,0
00
ju
ve
nil
es
Oregon
Marion
Oregon 23 23 24 22 21 20 17 15 14 13 11
Marion 26 24 21 20 21 18 17 14 14 13 14
1992 1993 1994 1995 1996 1997 1998 1999 2000 2001 2002

41
Teen Pregnancy
Measure #16: Pregnancy rate per 1,000 females 10-17
0
10
20
30
40
50
60
Ra
te p
er
1,0
00
fe
ma
les
Oregon
Marion
Oregon 17.9 18.2 18.9 19.2 18.8 18.0 17.2 15.9 14.0 12.6 10.9
Marion 23.5 22.6 22.6 25.3 23.9 26.6 21.0 21 17.6 16.5 15.6
1992 1993 1994 1995 1996 1997 1998 1999 2000 2001 2002

42
SWOT: Youth Examples Asset movement:
Take the Time Youth Opportunity
System in development
Peer Courts in Woodburn, Silverton/Mt. Angel, Jefferson, Stayton, Salem, Keizer
24J “Making After School Count”
Skate Parks in Aumsville, Stayton, Jefferson, Hubbard, Salem
Marion County Suicide Prevention Program
Reductions in Youth Shelter Options
Transitional services are gap

43
Priority Areas: Increase support for youth: family, peers,
other caring adults Increase youth empowerment: leadership,
service, safety Increase boundaries and expectations for
youth Increase youth constructive use of time Increase youth commitment to learning and
school success Integrate the positive youth development
system

44
Strategy Examples: Form a countywide Youth Development
Consortium Implement early identification and
support for high risk behaviors, including parent support and training
Secure sustainable funding for core family-youth supports: mental health, primary health care, substance abuse services, homeless support/ shelter

45
Next Steps
Review and recommendations from community partners
Online Survey Compile Plan Update Commission on Children
and Families review Board of Commissioners
approval State due date: June
30th
