benchmark2007spring.indd 1 4/3/07 8:15:26 am magazines... · ames, ia 50010 1(866) 774-4242 ......
TRANSCRIPT

Benchmark2007Spring.indd 1 4/3/07 8:15:26 AM

Benchmark2007Spring.indd 2 4/3/07 8:15:36 AM

Contents 2007 PIGChAmP, InC. All rIGht reserVed. A fArms.Com ComPAny
Volume 2, Spring 2007 • Number 1
� Welcome to Benchmark A message from PigCHAMP and
Farms.com
� Industry outlook Here are some issues facing the
industry this year.
8 Intro to Benchmarking What benchmarking means, and
how you can use it most effectively.
10 a summary of the 200� data Productivity is higher, but range of
performance is still wide.
12 range of performance The real question is not the average
effect but the variation in effects.
1� narrow the Gap Lower the variability to achieve
more profi ts.
1� proportion of sows Bred by seven days
This measure is especially important for internal benchmarking.
1� canada comes out on top Once more, Canadian herds
outperform those in the United States.
18 lactation feed Intake is critical
How much sows eat during lactation has a huge impact on health, pig growth and sow longevity.
22 regional differences minimal
Production technologies are available to nearly all producers.
2� nursery and Grow-finish summaries
Standardized methods will help measurement efforts.
25 critical care Nutritional management of nursery
pigs can be the difference between success and failure.
2� variation in sow farm outputBenchmarking variation is a new exercise.
2� sow lameness a problem Early identifi cation of lame sows,
followed by their removal from the herd will minimize the economic effect.
28 sow retention rates are low The costs associated with low sow
retention are greater than you think.
30 the Weather and sow mortality
Several important factors can have an effect on sow mortality.
32 seasonal variation in pigs Born alive
A four-year study provides additional insight.
3� monitoring sow Inventory A wide range can mean ineffi cient
use of sow space.
3� how to Blend the Generations
Generational differences are inherent; here’s how to recognize characteristics and enhance working relationships.
Benchmark 3
In this Issue
puBlIshEd By:Farms.com Media & PigCHAMP
Aspen Business Park426 South 17th Street
Ames, IA 500101(866) 774-4242
www.pigchamp.comwww.farms.com
dIrEctor of communIcatIons & chIEf EdItor
JoAnn [email protected]
pIGchamp GEnEral manaGErBob Brcka
pIGchamp BEnchmarKInG manaGErSusan Olson
puBlIshEr & vIcE prEsIdEntJoe Dales
salEs manaGErAndrew Bawden
suBscrIptIon ratE1 issue $10.00
All rights reserved. Editorial materials are copyrighted. Permission to reprint may be
granted upon request.
6 Industry Outlook
Benchmark2007Spring.indd 3 4/3/07 8:15:41 AM

Farms.com Ltd and PigCHAMP are pleased to bring you the 2007 edition of Benchmark – PigCHAMP Year in Review. This magazine is designed to provide information and analysis that can help you and your pork enterprise.
Welcome to Benchmark
� Benchmark
The data in this review was sent in from operations across North America and represents more than one million sows of production, with additional data from other countries. We encourage you to use the information and expert advice to identify areas in which you are doing well compared to the “averages,” as well as where there might be opportunities for improvement. By sending in data, producers who participate in the PigCHAMP Benchmarking program also receive quarterly updates on how their operations compare to benchmark averages. In addition, PigCHAMP offers in-depth, customized reports for a small fee, but keep in mind there is no charge to participate in the basic Benchmarking program.
PigCHAMP would like to extend a special thank you to John Deen, Sukumarannair S. Anil, and Stephanie Rutten at the University of Minnesota for providing the analysis of the benchmark data. Susan Olson, Benchmarking Manager at PigCHAMP, has worked closely with Dr. Deen to make sure the information in the magazine is as accurate and timely as possible. We also want to acknowledge JoAnn Alumbaugh, Farms.com Director of Communications for her drive and passion to produce this high quality educational material. Finally, the industry sponsors who have advertised in this issue deserve our thanks; this publication would not be possible without their support.
PigCHAMP, is a proud member of the Farms.com Family of Companies, and strives to deliver on the mission of the organization, which is to provide: Innovative Information Products and Services for the Global Agriculture and Food Industries. We believe the data, analysis and articles provided in Benchmark help support this mission. Visit www.pigchamp.com and www.farms.com to learn more about our company, products and services.
We hope you find this year’s Benchmark publication helpful in your operation. We welcome the opportunity to discuss how we can work with you in the future.
Graham Dyer Bob Brcka President and CEO General ManagerFarms.com Ltd. PigCHAMP, Inc.
Benchmark2007Spring.indd 4 4/3/07 8:15:58 AM

Looking for that place where meatquality and efficient growth intersect?
Use the map.
Monsanto Choice Genetics, Map Your Success, Monsanto Imagine and the vine are registered trademarks of Monsanto Technology LLC©2007 Monsanto Company ALL RIGHTS RESERVED www.MonsantoChoiceGenetics.com
The new composite boar line from Monsanto Choice Genetics, Inc. offers uncompromised performance.Beyond traditional breeding programs – beyond even identifying individual genes – Monsanto Choice Genetics®
has created a detailed map of the swine genome, identifying almost 6,000 genetic markers. By precisely targetingdesirable traits through genomics, Monsanto Choice Genetics can offer new boar lines that focus on the mostprofitable intersection of meat quality and efficient growth.
In the past, breeding for rapid growth might mean compromised meat quality, while selecting for quality couldimpact feed efficiency. Today, that's history. And these new boars are just the beginning. As market demands shift,Monsanto Choice Genetics’ proprietary technology will speed development of lines to meet them. The MonsantoChoice Genetics Swine Genome Map shows the way to uncompromised performance, productivity, and profitability.
Visit www.MonsantoChoiceGenetics.com for the whole story – learn how the future of the industry is beingmapped out.
93897 2/28/07 10:00 AM Page 1
Benchmark2007Spring.indd 5 4/3/07 8:16:14 AM

� Benchmark
Pork Industry outlookNew challenges join existing issues to keep life
interesting for pork producers.By JoAnn Alumbaugh
1
Being a pork producer is like climbing a mountain: at times the footing is steady and the handholds are sure. At other times, an avalanche or an unexpected thunderstorm races your way, and you’re forced to find shelter. Often, the challenges are external but internal difficulties can also be devastating. That’s where the use of benchmarking as covered in this magazine can lead to herd improvement.
There will never be “smooth climbing” without squalls. As sure as one problem is solved, another will take its place. But that is the case regardless of your business, and it’s a fact of life that not all businesses will survive. While there are many topics of concern in the pork industry, here are five economically important challenges to watch and plan for.
Impact of Ethanol The portion of the U.S. corn crop used for ethanol production was less than 5% 10 years ago, but it was greater than 20% in 2006. The United States currently has 100 active ethanol plants that can produce over 5 billion gallons of ethanol each year. An additional 58 plants are under construction or are being expanded. Another 150 ethanol plants have been proposed. It is apparent that the ethanol industry will compete with the livestock and poultry industries for corn and at least in the near term, impact swine production by causing higher feed costs. According to Dermot Hayes at Iowa State University, the growing demand for corn used in ethanol production in the U.S. has already increased the costs of hog production by approximately 10%.
The National Pork Producers Council has expressed its concerns about the adverse affects on its members of the rapid expansion of the corn-based ethanol industry.
“Pork producers continue to have the jitters over the rapid expansion of the corn-based ethanol industry and the challenges that expansion presents to maintaining our competitiveness with domestic and international meat protein competitors,” states Joy Philippi, immediate past president of NPPC and a producer from Bruning, Neb. “Pork producers believe that to maintain a healthy rural economy – indeed a healthy economy in general – market-based bio-fuels policies and regulations must ensure a balance between the food, fuel and feed needs of the country,” emphasizes Phillipi.
According to NPPC, the high demand for corn has pushed the per-bushel price up to $4 from $2 last summer, raising pork producers’ feed input costs to $65 per pig from $35. With that increase, pork production may need to decline by as much as 15% to allow the industry to recoup higher production costs, reports a November 2006 study by Iowa State University’s Center for Agricultural and Rural Development. The Center also estimates that a 30% production-cost increase will raise retail prices for pork, beef, dairy and chicken by 7.5%.
anImal carE IssuEs Smithfield Foods, the largest pork producer in the country, has announced it will eliminate the use of gestation stalls within the next 10 years. Maple Leaf Foods, the largest pork-producing company in Canada, has made a similar
2
Benchmark2007Spring.indd 6 4/3/07 8:16:23 AM

Benchmark �
announcement. While both companies obviously garnered a certain amount of positive press, it’s likely they are looking at the issue from a political standpoint, and want to solidify a strong relationship with the McDonalds and Wal-Marts of the world. They may have also seen “the writing on the wall,” with the passage of constitutional amendments in Florida and Arizona that prohibit pregnant sows from being confined in individual gestation crates.
The unfortunate outcome is that sows may not be better off in group housing.
If it were proven open housing was better for sows, producers might have a different perspective on the issue, but that isn’t the case.
The general public, or at least the animal rights groups, want a say in how food is produced, which means agriculture will constantly be faced with new challenges. This is the world we live in. People in affluent societies have the time and money to back “causes” without recognizing the implications of their actions. “Best management practices” or “sound scientific research” have been removed from the equation.
As with ethanol, pork producers are on the wrong side of the political issue. Unless the industry takes a proactive approach, it will always be on the defensive. Research on new systems should be supported, but moving to new systems must follow monitored trials with group sizes comparable to real-life situations.
sWInE hEalth and dIsEasEsPresently, the two diseases of most concern are Porcine Reproductive and Respiratory Disease (PRRS) and Porcine Circovirus Associated Diseases (PCVAD).
PRRS causes abortions, respiratory distress and death losses of up to 100%. The economic impact of PRRS in a breeding operation during the year of an outbreak has been estimated to be as high as $110 to $240 per female. In nursery pigs, PRRS causes increased death loss and decreased growth rate and feed conversion efficiency.
While PCVAD is not a new disease, there has been a widespread epidemic since the mid-1990s. Symptoms include wasting, difficult breathing, unthriftiness, enlarged lymph nodes, paleness, jaundice, emaciation, diarrhea and death (up to 40%). It is endemic in most pig populations around the world, and a laboratory diagnosis is always required for confirmation.
PCVAD can cause increased morbidity, mortality and treatment costs. In addition, average daily gain, feed efficiency and reproductive performance are adversely affected. The disease can occur in the absence of other significant pathogens but PCVAD is more severe in combination with other agents. The virus is spread horizontally from pig to pig via manure and body fluids. There is also some suspicion that subclinical vertical transmission from sow to piglets may lead to PMWS.
ExportsU.S. exports of pork and pork products have increased by more than 389% in volume terms and more than 361% in value terms since the implementation of the NAFTA in 1994 and the Uruguay Round Agreement in
1995. January-November 2006 exports were 1,147,835 metric tons valued at $2.6 billion. This is an increase of 9% by volume and 8% by value over pork exports during the same time period in 2005, so it’s easy to see how important exports are to the pork industry.
The USDA has reported that U.S. meat exports have generated 200,000 additional jobs and that this number has increased by 20,000 to 30,000 jobs per year as exports have grown. Exports are financially significant. The income multiplier from meat exports is 54% greater than the income multiplier from bulk grain exports. Each hog marketed in the United States consumes 12.82 bushels of corn and 183 pounds of soybean meal. With an annual commercial slaughter of 105.3 million animals in 2006, this corresponds to 1.34 billion bushels of corn and 9.63 million tons of soybean meal. Approximately 16% of this production is exported, and these exports account for approximately 216 million bushels of corn and 1.54 million tons of soybean meal.
Trade is important to pork producers. The industry has identified several priorities for 2007, including trade promotion agreements with Peru, Colombia and Panama, as well as extension of Trade Promotion Authority (TPA). With 96% of the world’s population residing outside of the United States, producers here must continue to gain access to potential customers.
thE farm BIllFor the last 10 years, the United States has spent $20 billion on farm bills, and Barry Flinchbaugh, the highly-respected agricultural economist from Kansas State University feels that trend will continue, at least in terms of the discussions. The 2006 budget ended up being nearly a carbon copy of the 2005 budget. Flinchbaugh says we need wisdom and experience to craft a good farm bill.
Unlike previous years, the farm bill is being determined at the same time we’re debating a new trade agreement with the WTO, points out Flinchbaugh. “That rarely happens. The first myth is that we have budget problems. The second myth is that the WTO is going to force us to cut farm programs. Not true.
“The WTO has no authority and isn’t asking for authority on how much we spend in the farm bill. It’s not how much we spend, it’s how we spend it,” continues Flinchbaugh bluntly. And while it would be easier to develop a domestic program without worrying about the WTO, that’s impossible.
“When you export 27% of everything you produce, it’s not very smart to discount the WTO,” states Flinchbaugh.
dEvElop your planHow do you remain among those who thrive? The most effective tools you have for climbing to the pinnacle are information, application of best management practices and implementation of new technologies. Identifying challenges and developing a plan to overcome them are among your best defenses.
3
4
5
Benchmark2007Spring.indd 7 4/3/07 8:16:27 AM

8 Benchmark
Benchmarking is an inevitable part of any production process. It can be done informally, through comparisons during conversations at meetings or other get-togethers. It can be done through retrospective comparisons, by asking producers to recall prior productivity levels. Finally, it can be done by taking the records and analyzing the data in a standardized method across farms.
The latter is the method used in this benchmarking report. The broad use of PigCHAMP recording on farms along with the wise decision, made many years ago, to benchmark based on the collection of actual production data has created an incomparable opportunity to compare and measure productivity on swine farms.
IdEntIfy trEndsIn this database producers submit, on a quarterly basis, a backup of their production data, which is then used to create a quarterly report back to these producers to allow regular benchmarking. Such benchmarking can identify trends that deviate from expected productivity and can produce real opportunities for improvement. For reproductive records, quarterly comparisons are approximately the maximum frequency that is of use.
On a yearly basis, however, this database affords the opportunity to identify longer-term trends. In addition, the yearly review allows partners in production to recognize opportunities for improvement in the current herd. As always, there are illustrations that present opportunities, as well as the limitations of current productivity outcomes. Some are universal to the industry, and some are limited to underperforming farms. As you review these results, it is useful to keep a number of aspects in mind.
This database summarizes performance across individuals sows or growing pig groups, and then summarizes on a farm-by-farm basis. This allows data validity steps to be taken to ensure utility. We test whether the sows’ productivity is recorded correctly and whether herds are stable and in production methods. This level of validation is often not seen in summary results in agriculture.Most of these comparisons are in the area of reproductive effi ciencies. Reproduction benchmarking
•
•
is often characterized by differences in capability to achieve high performance. That high performance is rarely tied to any single costly technology. In most cases, the variation that we see in reproductive productivity is not a strategic differentiation but simply an outcome of management. In other words, most farms are capable of reaching the higher levels of reproductive effi ciencies seen in this database.We are seeing generalized trends in improvements in reproductive output, and we believe the long history of PigCHAMP benchmarking has contributed to these improvements. There are two ways of viewing causes of improvement. The fi rst is to suggest that improvements in productivity have occurred in all farms. The second is to suggest that there is a “selection of the fi ttest” occurring, where only the best farms survive. Though the latter does occur, it appears that most improvement is occurring within farms.It is still surprising that there is such a large range of productivity. There are very few technological secrets or capabilities that are not available to all participants in the industry. Yet we must view opportunities for
improvement as relatively diffi cult to attain. It is unlikely that there is one “silver bullet” that can be discerned from these benchmarks for a farm.
Of course, benchmarking productivity is not the only area for improvement. It is part of a set of tools and opportunities for progress within this industry. It is a relatively effi cient method of analysis and it can allow us to
prioritize and identify new opportunities.
Editor’s Note: Dr. John Deen is a veterinarian and associate professor at the College of Veterinary Medicine, University of Minnesota.
•
•
The broad use of PigCHAMP recordkeeping on farms, along with the wise decision to benchmark based
on the collection of actual production data, has created an incomparable opportunity to compare and
measure productivity on swine farms.
An IntroduCtIon to BenChmArkInGUse the information for
long-term herd improvement.By John Deen and Stephanie Rutten-Ramos
Benchmark analysis
Benchmark2007Spring.indd 8 4/3/07 8:16:33 AM

Benchmark2007Spring.indd 9 4/3/07 8:16:37 AM

of record keeping systems and summarizes the results to allow benchmarking and characterization of the industry as a whole. Our endeavor is to allow producers to identify
2006 has brought another year of improved productivity and a continued wide range of performance across farms. This database takes the reports of the PigCHAMP family
10 Benchmark
Benchmark analysis
A summAry of the 2006 dAtAProductivity is higher,
but range of performance is still wide.By Sukumarannair S. Anil and John Deen
u.s. year-end summaryfarms included for summary = 493
pigcare variables pigchamp variables used mean sd median upper 10 percentile lower 10 percentile
Repeat services Number repeat services 418.21 459.131 270.00 938.00 82.00
% Repeat services Percent repeat services 12.86 6.454 11.50 21.20 6.00
Total services Total number of services 3645.90 3873.230 1987.00 8136.00 836.00
Farrowings Number of sows farrowed 2884.10 3143.080 1454.00 6592.00 578.00
Farrowing rate Farrowing rate 77.43 10.933 79.40 86.70 67.70
Total born Total pigs born 34926.93 38684.770 17986.00 82866.00 7002.00
Total born per litter Average total pigs per litter 11.99 0.749 12.05 12.90 10.98
Total liveborn Total pigs born alive 31449.45 34995.870 16451.00 74525.00 6271.00
Liveborn per litter Average pigs born alive/litter 10.69 1.288 10.80 11.60 9.80
Liveborn/female/year litters/fem/yr * ave pigs born alive per litter 23.37 3.835 23.90 26.89 20.00
Total stillborn Total stillborn pigs 2646.87 2837.330 1481.00 6467.00 509.00
Stillborn per litter Average stillborn pigs 0.94 0.306 0.95 1.30 0.59
Total mummified Total mummified pigs born 807.03 1272.560 321.00 2080.00 45.00
Mummified per litter Average mummies per litter 0.23 0.163 0.20 0.40 0.05
Sows weaned Sows farrowed and weaned 2860.17 3136.660 1451.00 6594.00 578.00
Piglets weaned Total pigs weaned 27608.71 30825.730 14694.00 63708.00 5514.00
Piglets weaned per litter Pigs weaned per litter weaned 9.30 1.154 9.42 10.19 8.60
% Total losses of liveborn Pre-weaning mortality 12.11 3.878 11.98 16.88 7.90
Average weaned weight Average litter weaning weight (N=182) 114.53 37.084 119.90 143.20 88.00
Piglets age at weaning Average age at weaning 19.06 2.666 19.40 21.00 17.00
Piglets weaned/sow/year Pigs wnd / mated female / yr 21.52 3.499 22.00 24.70 18.60
Piglets weaned/female/year Pigs wnd / female / year 20.35 3.456 20.70 23.88 17.35
Total boars Ending boar inventory 10.38 27.379 4.00 20.00 0.00
Sows added Females entered 826.97 1125.550 413.00 1781.00 142.00
Sows culled or sold Sows and gilts culled 690.12 1011.330 351.00 1437.00 111.00
% Cull per year Culling rate (N=491) 53.10 55.193 47.90 68.60 31.60
Sows died Sow and gilt deaths 121.20 166.681 60.00 299.00 20.00
% sow deaths per year Death rate (N=491) 8.84 3.776 8.40 13.40 4.90
total sows ave female inv - ave gilt pool inv 123�.29 1313.�10 ��5.00 2��8.00 291.20
Benchmark2007Spring.indd 10 4/3/07 8:16:41 AM

Benchmark 11
methods for potential improvement and to allow allied industries to identify opportunities as well.
As a whole, we continue to see many opportunities, particularly for those farms in the lower percentiles of specific productivity measures. As well, we see great opportunities to maintain productive sows in the herd for longer periods of time. Much more discussion has been placed on the quality of pigs at time of weaning,
and management of parity structure is one of those opportunities. We see some movement in weaning age as well, with more herds having average weaning ages in excess of 20 days.
Pig farming will continue to have challenges, but the engine that provides the pig supply is the sow herd. Based on this, we should continue to see a relatively plentiful supply of pigs on the market.
Pig farming will continue to have challenges, but the engine that provides the pig supply is the sow herd.
summary Comparison Between PigChAmP Care 3000 and PigChAmP farms included for summary: 488
pigcare variables pigchamp variables used mean sd median upper 10 percentile lower 10 percentile
Repeat services Number repeat services 114.98 120.574 73.50 273.00 22.00
% Repeat services Percent repeat services 15.92 36.740 12.50 25.50 5.80
Total services Total number of services 941.45 999.293 509.50 2052.00 208.00
Farrowings Number of sows farrowed 723.26 809.685 370.50 1676.00 142.00
Farrowing rate Farrowing rate 74.09 11.818 76.85 86.20 58.10
Total born Total pigs born 8702.58 9901.190 4365.00 20513.00 1694.00
Total born per litter Average total pigs per litter (N=487) 11.91 0.822 11.99 12.91 10.80
Total liveborn Total pigs born alive 7866.09 9046.970 3920.50 18210.00 1535.00
Liveborn per litter Average pigs born alive/litter 10.70 0.916 10.78 11.69 9.70
Liveborn/female/year litters/fem/yr * ave pigs born alive per litter 22.80 3.855 23.22 27.10 17.92
Total stillborn Total stillborn pigs 649.08 697.578 368.50 1629.00 121.00
Stillborn per litter Average stillborn pigs 0.96 0.326 0.96 1.34 0.59
Total mummified Total mummified pigs born 179.95 269.905 75.50 465.00 8.00
Mummified per litter Average mummies per litter 0.22 0.184 0.20 0.40 0.03
Sows weaned Sows farrowed and weaned 698.93 797.833 355.50 1668.00 147.00
Piglets weaned Total pigs weaned 6895.23 7939.650 3452.50 16082.00 1396.00
Piglets weaned per litter Pigs weaned per litter weaned 9.30 0.935 9.40 10.20 8.41
% Total losses of liveborn Pre-weaning mortality 12.42 4.385 12.19 17.76 7.37
Average weaned weight Average litter weaning weight (N=144) 120.04 31.974 123.00 148.00 97.00
Piglets age at weaning Average age at weaning 19.43 2.317 19.60 21.40 17.10
Piglets weaned/sow/year Pigs wnd / mated female / yr 20.98 3.500 21.38 24.75 16.90
Piglets weaned/female/year Pigs wnd / female / year 19.85 3.568 20.38 23.80 15.60
Total boars Ending boar inventory 10.39 27.545 4.00 20.00 0.00
Sows added Females entered 203.64 275.717 97.00 479.00 29.00
Sows culled or sold Sows and gilts culled 171.07 223.059 94.50 368.00 32.00
% Cull per year Culling rate (N=481) 53.27 35.201 46.60 76.90 26.70
Sows died Sow and gilt deaths 29.71 47.656 14.00 71.00 3.00
% sow deaths per year Death rate (N=481) 7.91 4.685 7.30 13.20 3.10
total sows ave female inv - ave gilt pool inv 12�8.0� 1358.8�0 �03.10 2�93.80 291.00
Benchmark2007Spring.indd 11 4/3/07 8:16:41 AM

12 Benchmark
wIde rAnGe of PerformAnCeThe real question is not the
average effect but the variation in effects. By John Deen
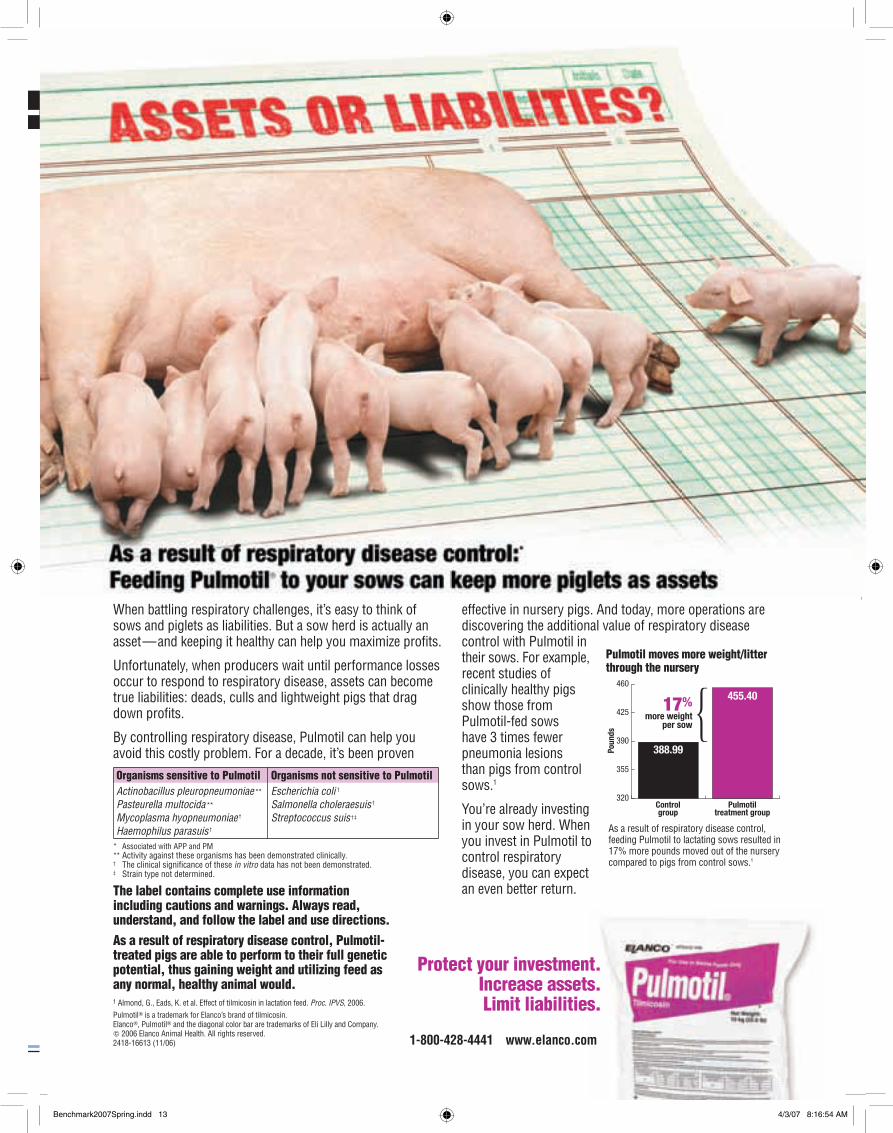
When battling respiratory challenges, it’s easy to think ofsows and piglets as liabilities. But a sow herd is actually anasset—and keeping it healthy can help you maximize profits.
Unfortunately, when producers wait until performance lossesoccur to respond to respiratory disease, assets can becometrue liabilities: deads, culls and lightweight pigs that dragdown profits.
By controlling respiratory disease, Pulmotil can help youavoid this costly problem. For a decade, it’s been proven
effective in nursery pigs. And today, more operations arediscovering the additional value of respiratory diseasecontrol with Pulmotil intheir sows. For example,recent studies ofclinically healthy pigsshow those fromPulmotil-fed sows have 3 times fewerpneumonia lesions than pigs from controlsows.1
You’re already investingin your sow herd. Whenyou invest in Pulmotil tocontrol respiratorydisease, you can expectan even better return.
Protect your investment.Increase assets.Limit liabilities.
1-800-428-4441 www.elanco.com
1 Almond, G., Eads, K. et al. Effect of tilmicosin in lactation feed. Proc. IPVS, 2006.
Pulmotil� is a trademark for Elanco’s brand of tilmicosin.Elanco�, Pulmotil� and the diagonal color bar are trademarks of Eli Lilly and Company.� 2006 Elanco Animal Health. All rights reserved.2418-16613 (11/06)
As a result of respiratory disease control:*
Feeding Pulmotil� to your sows can keep more piglets as assets
Organisms sensitive to Pulmotil Organisms not sensitive to PulmotilActinobacillus pleuropneumoniae**
Pasteurella multocida**
Mycoplasma hyopneumoniae †
Haemophilus parasuis †
Escherichia coli †
Salmonella choleraesuis †
Streptococcus suis †‡
* Associated with APP and PM** Activity against these organisms has been demonstrated clinically.† The clinical significance of these in vitro data has not been demonstrated.‡ Strain type not determined.
The label contains complete use informationincluding cautions and warnings. Always read,understand, and follow the label and use directions.
320
355
390
425
460
Controlgroup
17%more weight
per sow
Poun
ds
Pulmotiltreatment group
388.99
455.40
Pulmotil moves more weight/litterthrough the nursery
As a result of respiratory disease control,feeding Pulmotil to lactating sows resulted in17% more pounds moved out of the nurserycompared to pigs from control sows.1
As a result of respiratory disease control, Pulmotil-treated pigs are able to perform to their full geneticpotential, thus gaining weight and utilizing feed asany normal, healthy animal would.
One of the starkest characteristics of benchmarking productivity is the wide range of performance being seen across this industry. One of our favorite numbers is “pigs born alive per mated female per week.” It measures the output on a weekly basis as a function of the inventory of sows in the herd. “Mated females” is defi ned as including all females in the herd except for those gilts that have not yet been mated for the fi rst time.
What strikes us is the wide range of performance. First of all, the average output is approximately .45 pigs born per sow per week. The average 95% range of pigs born per sow per week within a farm is from .26 to .64 pigs born alive. This range occurs in farms that are trying to stabilize output to utilize downstream facilities as effi ciently as possible. Part of this variation is due to seasonal infertility, but much of it is due to variation in performance.
Interestingly, this variation in productivity is highest when productivity is lowest. Though the average standard deviation for the year is .09 pigs per sow per week, this varies over the year from .7 to .11. This suggests that there are increased opportunities for improvement when the herd is challenged.
The study of variation is really a study of capability. Where variation exists there is opportunity for improvement that should be readily available. Where variability increases we see an illustration of differing capabilities of farms to adjust to insults. The largest insult on a regular basis is seasonal infertility. By showing a larger variation in output from sows bred during the summer, we can focus on more than simply the fact that the average farm reduces productivity levels. We can see that not all farms are affected equally. Some farms are relatively unaffected while other farms are severely affected by this factor. The real question is not the average effect but the variation in effects.
There is a large number of benchmarking studies that examine variation quite closely, especially in similarly operated enterprises. By similarly operated enterprises we are not speaking simply of farms that have the same geographic region. We are talking about farms that have
the same objective, in most cases maximizing sow output, and that are operated in a similar manner. Across our database, most farms use farrowing crates and have relatively similar genotypes. There are some differences in capabilities to gain large litter size, but opportunities to maximize farrowing rate and other effi ciencies appear to be quite similar.
What we fi nd in variation analysis, often called capability analysis, is that implementation of strategies
is the largest source of variation between enterprises. In other words, it is not what we know; it is how we do it.
A case in point would be the variation in farrowing rates. The coeffi cient of variation in this indice is 14.1%. Compare this to
the variation in total number of pigs born. That coeffi cient of variation is 6.2%. It suggests that there is greater opportunity for improvement in the farrowing rate. There are differences in genotype that affect the total number of pigs born and there are regional differences that affect this number as well. However, it is more diffi cult to pick up a pattern in the variation of farrowing rate, even though it is much larger. Nor are there a large number of undisclosed technologies that are not available to all producers. It does appear that implementation of correct procedures within the farm is needed to reduce this variation.
As producers look for benchmarks in which they have the greatest capability for improvement, they must look at not only the rankings of their farms compared to the rest of the population, they must also look at the breadth of variation within that ranking. Look for the greatest range of variation in productivity as it points you in the area where you have the greatest capabilities for change. Not only is it the greatest capability for change, but the answers are close at hand as other producers are capable and actually implementing a higher level of compliance to proper technique.
Benchmark analysis
The study of variation is really a study of capability. Where variation exists there is opportunity for improvement that should be readily available.
Benchmark2007Spring.indd 12 4/3/07 8:16:49 AM
When battling respiratory challenges, it’s easy to think ofsows and piglets as liabilities. But a sow herd is actually anasset—and keeping it healthy can help you maximize profits.
Unfortunately, when producers wait until performance lossesoccur to respond to respiratory disease, assets can becometrue liabilities: deads, culls and lightweight pigs that dragdown profits.
By controlling respiratory disease, Pulmotil can help youavoid this costly problem. For a decade, it’s been proven
effective in nursery pigs. And today, more operations arediscovering the additional value of respiratory diseasecontrol with Pulmotil intheir sows. For example,recent studies ofclinically healthy pigsshow those fromPulmotil-fed sows have 3 times fewerpneumonia lesions than pigs from controlsows.1
You’re already investingin your sow herd. Whenyou invest in Pulmotil tocontrol respiratorydisease, you can expectan even better return.
Protect your investment.Increase assets.Limit liabilities.
1-800-428-4441 www.elanco.com
1 Almond, G., Eads, K. et al. Effect of tilmicosin in lactation feed. Proc. IPVS, 2006.
Pulmotil� is a trademark for Elanco’s brand of tilmicosin.Elanco�, Pulmotil� and the diagonal color bar are trademarks of Eli Lilly and Company.� 2006 Elanco Animal Health. All rights reserved.2418-16613 (11/06)
As a result of respiratory disease control:*
Feeding Pulmotil� to your sows can keep more piglets as assets
Organisms sensitive to Pulmotil Organisms not sensitive to PulmotilActinobacillus pleuropneumoniae**
Pasteurella multocida**
Mycoplasma hyopneumoniae †
Haemophilus parasuis †
Escherichia coli †
Salmonella choleraesuis †
Streptococcus suis †‡
* Associated with APP and PM** Activity against these organisms has been demonstrated clinically.† The clinical significance of these in vitro data has not been demonstrated.‡ Strain type not determined.
The label contains complete use informationincluding cautions and warnings. Always read,understand, and follow the label and use directions.
320
355
390
425
460
Controlgroup
17%more weight
per sow
Poun
ds
Pulmotiltreatment group
388.99
455.40
Pulmotil moves more weight/litterthrough the nursery
As a result of respiratory disease control,feeding Pulmotil to lactating sows resulted in17% more pounds moved out of the nurserycompared to pigs from control sows.1
As a result of respiratory disease control, Pulmotil-treated pigs are able to perform to their full geneticpotential, thus gaining weight and utilizing feed asany normal, healthy animal would.
Benchmark2007Spring.indd 13 4/3/07 8:16:54 AM

1� Benchmark
Benchmark analysis
Most people are shocked to see the range of variability that still exists in the industry today. Given the spread of achievement out there, it is safe to say there are lots of potential profits being left on the table. Having said that, there is also a perception among many that unless you have entered the top 25% in production metrics you have departed or soon will depart the industry. The truth of course is that there is no such place as Lake Woebegon, that mythical place invented by Garrison Keillor where, “all the women are strong, all the men are good-looking, and all the children are above average.” So, before we sport bumper stickers claiming our swine unit is on the honor roll, it is a good idea to understand the variation in performance we see in the metrics, and explain what it might mean for your operation.
varIatIon Is normalFirst, we know that variation in performance is a normal, predictable and permanent part of any biological system. It cannot be eliminated and it is a function of the response of living organisms to their environment and the changes in their environment. Not all variation has negative economic consequences. Geneticists are always hoping for variation so they can garner the very top end for future advancements. On the other hand, cash flow is often directly tied to production variance and therefore it can be problematic if it is out of control.
We experience biological production as a distribution of outcomes that can be described statistically by the average and some measure of dispersion around the average, such as the variance or standard deviation. The key to increased performance is to raise the average profitability while reducing its variance. We begin by talking about profits since there are hundreds of ways to affect profits in an organization. In many cases, the most important change you should make to affect profits is unique to your organization.
not Easy, But Worth thE EffortIncreasing the average of a production metric while decreasing its variance is without question an uphill battle. The natural order will be to increase variance when the average is raised, and moving against the natural order of things requires vigilance, understanding
and effort. One of the key understandings top producers bring to their management is that while nature deals us a system with built-in variation, the important thing is to keep from adding to the variation through sloppy management practices, poor technology or improper nutrition etc.
As you size up your performance with the benchmarking metrics provided, focus on the opportunity you may have been missing through past decisions you have made. In articles on the Farms.com website, I have focused on opportunity cost as a very valuable tool for
opening insights into possible future improvements. As you scan the range of outcomes in the industry and compare it to your own, you may want to think about not only the metrics but the profit potential that has been left on the table due to the factors and choices that have resulted in your system performance today.
nEt IncomE Is thE GoalIt is important to think about the cost of achieving gains in any of the metrics and the likely future payoff. I have been to countless producer meetings over that last two decades where plaques, prizes and other recognitions were given to producers on the basis of high achievement in one or more of the production metrics. An award I have never seen given is one for the farm that produced the highest net income or highest return on equity in total or per pig. Simply trying to maximize or minimize production metrics is a naïve approach to the future. Take a look at where you stand, analyze the cost and return associated with improving a key metric and make your move toward the one with the highest net payoff
– not the highest bragging rights. Forget the plaque, go for the cash.
Editor’s Note: Dr. Dennis DiPietre is a swine industry consultant from Columbia, Missouri.
nArrow the GAPLower the variability to achieve more profits.
By Dennis DiPietre
As you size up your performance with the benchmarking metrics provided, focus on the opportunity you may have
been missing through past decisions you have made.
Benchmark2007Spring.indd 14 4/3/07 8:16:57 AM

Benchmark analysis
CHORE-TIME®Sow Farrowing System
Made to Work. Built to Last.®
CTB AdvertisingAd No. CT-2386F-1206
Chore-Time Hog Production Systems
CHORE-TIME®Free-Access Sow Gestation System
Chore-Time Hog Production Systems
A Division of CTB, Inc.Phone 800-341-1039
CHORE-TIME®Free-Access Sow Gestation System
CHORE-TIMECHORE-TIMECHORE-TIME®®®Free-Access Sow Free-Access Sow Free-Access Sow Gestation SystemGestation SystemGestation System
CHORE-TIME®Free-Access Sow Gestation System
Benchmark2007Spring.indd 15 4/3/07 8:17:02 AM

1� Benchmark
sows bred seven to 14 days after weaning, appear to have much lower levels of reproductive performance. It is unclear why this occurs, but it seems to be repeatable across many farms. One hypothesis is simply that sows are not monitored as closely after the fi rst week and these matings are of a lower quality. This fact also seems to be supported by the increase in the number of single-mated sows.
The fi gure shows a strong seasonal trend in this measure as well. This affects the culling rate and the inventory of open sows. It also has a strong correlation with farrowing rate and litter size.
This indice is an excellent internal monitoring measure. It is not one that we normally compare from herd to herd and it is not included in our quarterly and annual reports. Yet, within the barn, it is easily seen when the sows accumulate and a rapid response can be made to address this problem. The sows should be considered a specifi c monitorable population that can be benchmarked from week to week
within the farm. Factors such as season, lactational feed intake, parity and estrus detection can all be identifi ed as contributing factors on any given farm, and can be fi xed in a rapid fashion.
There are various indices that can be used for benchmarking. Some of these are more appropriate for farm-to-farm benchmarking and some are more appropriate for internal benchmarking. The latter does not show up on these pages but can be important, nonetheless. One such example that is found in the PigCHAMP Performance Monitor is the indice entitled “proportion of sows bred by seven days.”
At fi rst sight this is an odd indice, because the “seven days” sounds arbitrary or antiquated. The question may be, “Why it is not fi ve days or eight days?” The answer derives itself from some time ago, when sows were weaned on all farms on a weekly basis. At that time it was a measure of being able to clean out the breeding pens for the next batch of weaned sows. With many farms now weaning twice a week, or even more frequently, this may seem like an outmoded indice. However, it does appear as an important measure even on farms that wean multiple times a week.
This indice continues to be important for two reasons. First, there is something special about a cutoff of seven days. The research is relatively old at this point, but it does appear that sows not bred within seven days, especially
81
82
83
84
85
86
87
88
89
90
91
92
12/14/05 3/24/06 7/2/06 10/10/06 1/18/07
Date
Pro
po
rtio
n (
%)
fIGurE 1: trEndlInE of proportIon of soWs BrEd for 200�
The sows should be considered a specifi c monitorable population that can be benchmarked
from week to week within the farm.
Benchmark analysis
ProPortIon of sows Bred By seVen dAys
This measure is especially important for internal benchmarking.
By John Deen
Benchmark2007Spring.indd 16 4/3/07 8:17:07 AM

0
2
4
6
8
10
12
Jan-Mar Apr-Jun Jul-Sep Oct-DecQuarters
Dea
th r
ate
a aa
b
In general, the Canadian sow herd appears to be more productive than the American sow herd, and this mirrors what we’ve seen in the past. There is a higher number of pigs per sow per year in Canadian herds in this database, and each of the contributing variables is also higher. Particularly signifi cant is the difference in farrowing rate and the number of nonproductive sow days per year.
Some have attributed this difference to climactic differences, though little evidence of such a major effect is actually seen. Some have argued that the contrast can be attributed to differing fi nancial pressures, with a lower potential of profi tability within the Canadian herd at this time. This seems like a logical premise.
Another reason that appears to be popular is that farms selling weaned pigs are more likely to maximize their output. This may be due in part to the fact that they do not have to stabilize their output to the same level as some swine units, and it may also be due to the fact that they can focus on a very narrow range of technologies for specialization in reproduction. Canada has a large number of farms that specialize in raising and selling weaned pigs, and these appear to be the leaders in reproductive output.
Note: There were no signifi cant differences in performance of Canadian herds across different quarters, except for average number of piglets born alive /litter. Bars with different letters indicate signifi cant difference in performance of U.S. (lower case letters) and Canadian (upper case letters) herds across different quarters.
CAnAdA Comes out on toPOnce more, Canadian herds outperform
those in the United States.By Sukumarannair S. Anil and John Deen
Ave
rag
e #
of
pig
s w
ean
ed/
mat
ed f
emal
es/
year
0
5
10
15
20
25
30
Jan-Mar Apr-Jun Jul-Sep Oct-DecQuarters
USA
CANADA
a a ab
USA
CANADA
6870727476
7880828486
Jan-Mar Apr-Jun Jul-Sep Oct-DecQuarters
Farr
ow
ing
Rat
e
ab b
c
USA
CANADA
1010.210.410.610.8
1111.211.411.611.8
12
Jan-Mar Apr-Jun Jul-Sep Oct-DecQuarters
Ave
rag
e #
of
bo
rn a
live
/ lit
ter
A
ab b
a
BB
A
USA
CANADA
avEraGE numBEr of pIGlEts Born alIvE /lIttEr durInG 200� In u.s. and canadIan hErds
USA
CANADA
USA
CANADA
USA
CANADA
dEath ratE durInG 200� In u.s. and canadIan hErds
farroWInG ratE durInG 200� In u.s. and canadIan hErds
avEraGE numBEr of pIGs WEanEd/matEd fEmalEs/yEar durInG 200� In u.s. and canadIan hErds
Benchmark 1�
Benchmark2007Spring.indd 17 4/3/07 8:17:11 AM

18 Benchmark
Benchmark analysis
lACtAtIon feed IntAke Is CrItICAlHow much sows eat during lactation has a huge impact on health, pig growth and sow longevity.
By Sukumarannair S. Anil
18 Benchmark
studies have evaluated the direct relationship between lactation feeding and sow longevity. Secondly, the most predominant dimension of lactation feed intake used in research has been the average quantity consumed during the entire lactation.
ExtrEmEs on thE loW EndEfforts to improve any production scenario must focus on the low extremes. Translating this to lactation feed intake, producers should focus on those sows consuming significantly lower quantities of feed during any lactation day. The scientific proposition that there are time points during lactation when the physiological mechanisms controlling reproduction, such as estrus after weaning, are more sensitive to reduction in feed intake supports this argument.
A recent study at the University of Minnesota analyzed the direct link between lactation feed intake and sow longevity. This research demonstrates that sows consuming < 3.5 kg of feed per day during the first two weeks of lactation had a higher likelihood of removal from the herd before the next parity. The likelihood of removal was the highest (odds ratio 2.36, confidence interval 1.311- 4.261) for sows that consumed no feed in any one day during the first two weeks of lactation com-pared to the rest of the population.
KEy factors to consIdErFactors affecting lactation feed intake include parity, litter size, pregnancy weight gain, mean room temperature, particle size and digestibility of the feed, availability of ad libitum water, frequency of feeding and feeder design. All these parameters need to be properly addressed to ensure adequate lactation feed intake. It goes without saying, we cannot force a sow to eat if she does not want to eat, but we can always look for options to prevent that from happening in the first place. The strategies to achieve this may include early detection of signs of diseases and other painful conditions and providing an environment conducive to promote eating
during lactation.
Editor’s Note: Dr. Sukumarannair S. Anil is a veterinarian and post-doctoral researcher at the College of Veterinary Medicine, University of Minnesota.
Measures to improve longevity of breeding females have been accorded a high priority in swine breeding herds. Although a sow may be removed from the herd at any time during its reproductive cycle, from an epidemiological standpoint, lactation is a high risk event. A great deal of the challenge to longevity is related to inadequate feed consumption during lactation. The nutritional demand on sows during lactation – especially modern, highly prolific sows – may not be met even with ad libitum feeding.
The nutritional demand on lactating sows is further exacerbated in younger parity females as they have the additional requirement to support growth. Inadequate lactation feed intake may affect sow longevity both directly and indirectly. The direct effects may be associated with excessive depletion of body reserves to maintain lactation, while the indirect effects are mediated by conditions that impair breeding performance.
Studies have indicated that highly productive sows may have physical limitations in consuming the quantity of feed required to replenish the minerals secreted during a heavy lactation. This may make them more prone to conditions such as osteomalacia, which can lead to lameness and removal from the herd. Similarly, there is research evidence that vital reproductive performance indicators such as wean-to-estrus interval and embryo survival rate are adversely affected by a low level of feeding during lactation.
BalancInG actSince reproductive efficiency is a prerequisite for retaining sows in the breeding herd, any factor leading to a compromise in the reproductive performance of the sow can impair sow longevity. Arguably, a shorter lactation length means less body weight loss and less exposure to higher nutrient demands in the short term. However, it also means that sows with short lactation periods farrow more litters in the same time frame and will have a greater metabolic demand. Epidemiological evidence has linked shorter lactation length with high risk of removal. When the length of lactation is short, the diet therefore must ensure that milk production demands are fulfilled and post-weaning breeding performance remains unaffected.
A glance at the literature on lactation feeding research reveals two interesting points. First, though inadequate lactation feed intake is linked to inefficient reproduction and consequent sow removals, only a few
Benchmark2007Spring.indd 18 4/3/07 8:17:14 AM

Benchmark analysis
© 2007 Boehringer Ingelheim Vetmedica, Inc. Enterisol is a registered trademark of Boehringer Ingelheim Vetmedica, GmbH, Ingelheim, Germany.Always read, understand and follow the label directions. Do not use concurrently with antibiotics.
BIVI175BM
Enterisol® Ileitis keeps on tap.
Ileitis immunity is as easy as turning on the water. Enterisol Ileitis protects your pigs with long-lasting immunity. It’s there when you need it and it takes the guesswork out of ileitis control. Now that’s what we call a liquid asset. Ask your animal health professional for details, or call Boehringer Ingelheim at 1-800-325-9167.
Enterisol® Ileitis
www.bi-vetmedica.com
BiVi175BM Spigot ad ƒ.indd 1 3/19/07 9:40:53 AMBenchmark2007Spring.indd 19 4/3/07 8:17:17 AM

N E V E R S T O P I M P R O V I N G
After six generations, the PIC Camborough® family remains the industry standard for prolificacy, mothering
ability, longevity and maternal influence on growing pig performance. In the past five years, we have made
significant improvements in lifetime sow productivity by focusing on total pounds marketed per sow as a
measure of total system profitability. Are you ready to go from Pigs/Sow/Year to Profit/Sow/Year?
CAMBOROUGHThe international standardin F1 female genetics.
CAMBOROUGH 29The newest member of theCamborough family.
CAMBOROUGH 23Maximum durability now withimproved growth and leanness.
For more information on the Camborough family or other PIC products, call 1-800-325-3398 or visit us on the web at www.pic.com.
CAMBOROUGH 22Exceptional terminal pigperformance and carcass quality
530840_PigChamp_ad_sprdPSY2.indd2-3 2-3 3/2/07 1:41:36 PM
N E V E R S T O P I M P R O V I N G
After six generations, the PIC Camborough® family remains the industry standard for prolificacy, mothering
ability, longevity and maternal influence on growing pig performance. In the past five years, we have made
significant improvements in lifetime sow productivity by focusing on total pounds marketed per sow as a
measure of total system profitability. Are you ready to go from Pigs/Sow/Year to Profit/Sow/Year?
CAMBOROUGHThe international standardin F1 female genetics.
CAMBOROUGH 29The newest member of theCamborough family.
CAMBOROUGH 23Maximum durability now withimproved growth and leanness.
For more information on the Camborough family or other PIC products, call 1-800-325-3398 or visit us on the web at www.pic.com.
CAMBOROUGH 22Exceptional terminal pigperformance and carcass quality
530840_PigChamp_ad_sprdPSY2.indd2-3 2-3 3/2/07 1:41:36 PMBenchmark2007Spring.indd 20 4/3/07 8:17:21 AM