1. 2 participants will understand … use of common formative and summative assessments to enhance...
TRANSCRIPT

MODULE 2Secondary
A Year in the Life of a Data Driven School
MODULE 2Secondary
A Year in the Life of a Data Driven School
1

Welcome Back!
2

Outcomes Participants will understand…
Use of common formative and summative assessments to enhance Tier 1 data collection
Data Tracking of Assessments for Curriculum Alignment with Standards
Different Data to Analyze Tier 1 Health SBLT Process Responsibilities for Identifying and
Tracking Targeted At-Risk Student Populations TDT Problem-Solving and Recommendations for Tier
1 and Tier 2 Services IPST Process for Parent Request, Teacher Request,
and Re-Evaluation3

WHY ARE YOU HERE?
4
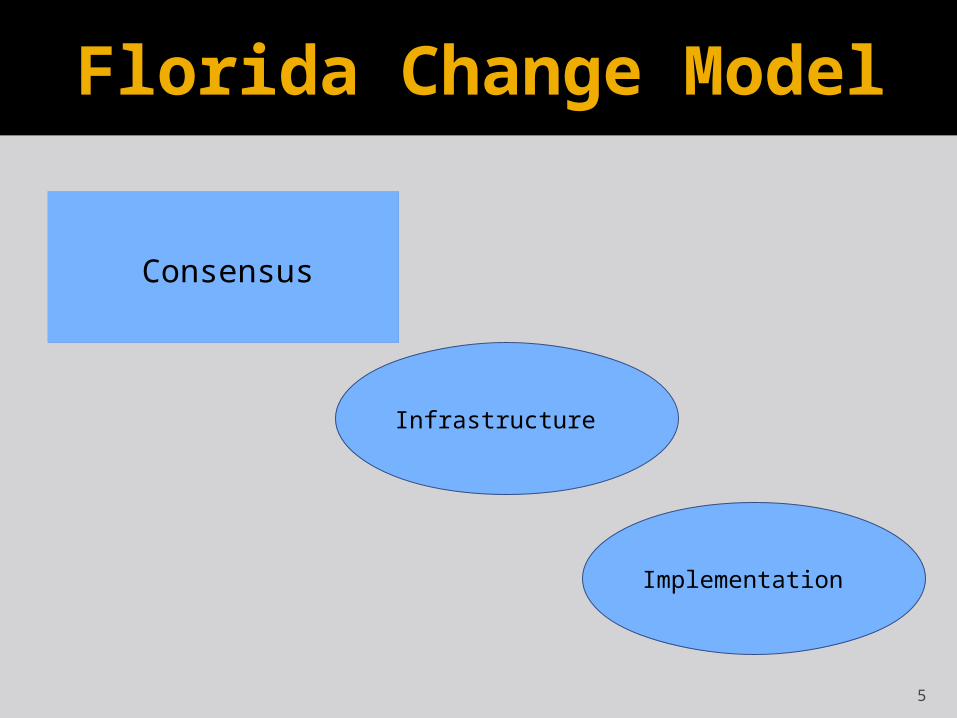
Florida Change Model
Infrastructure
Implementation
Consensus
5

Consensus Building
Continues… 6

You can lead the horse to water…
1. Innovators/adopters: welcome change
2. Susceptibles: resent current practices; feelings of dissonance
3. Nonsusceptibles: do not believe change is needed
4. Resisters: sabotage change efforts
(Powell, 1988)
7

Problem Solving – STEP Zero
“Step 0” in problem-solving model = building foundation for collaboration.
Steps: Establish and maintain rapport among members. Formulate sense of trust and respect (How?) Clarify expectations for participation including
roles and responsibilities, shared accountability, legal and ethical guidelines, preferred communication lines and so forth.
Establish understanding for problem-solving process.
8

B.E
.S.T
Professional
Learning
Com
munities
R t IHow do we tie all of these initiatives
together?9

Brevard Effective Strategies for Teaching
ProfessionalLearning
Communities
Response to
Intervention
Student Achievement
10

Problem Solving Process –Florida’s Model
EvaluateDid the plan work?
Problem AnalysisWhy is it occurring?
Problem IdentificationWhat is the problem?
Develop and Implement PlanWhat can we do about it?
What does your DATA say about
student achievement?
11

In order to implement RtI, you need a few pieces of infrastructure:
Capacity to Problem-Solve Capacity to Collect Data, and Make Sense of it
Capacity to Display Data Over Time
Capacity to deliver instruction at different intensities (Tiered-levels of services)
12

Problem Solving Step 1
13

What Data Are We Looking At?
Historical & CurrentAcademic Data
*Student data*Class data *Benchmark
data*Grade level
data
Formative Data
Summative Data
Progress Monitoring
Behavioral Data
Intervention Data
14

Using Data to… Analyze the past – How did we do?
What can we do better? Plan for today, drive our instruction-
What should we do differently? Diagnose-What specifically is the
issue? Progress Monitor-Is what we are
doing working? Predict the future
15

Identify students early.
Ensure that students’ difficulties are not due to a lack of alignment between the instruction, curriculum, environment, and learner (I.C.E.L.).
Modify instruction and implement evidenced-based interventions based on individual needs.
Make informed decisions about what resources are needed to ensure student success.
Goals of RtI in FloridaT i R – Thinking is Required
16

I.C.E.L.
DATA
INSTRUCTION
CURRICULUM
ENVIRONMENT
LEARNER
17

Common Assessments
Formative and SummativeCreated by teachers, in collaborative PLCs, to
Inform Tier 1 Instruction

The first school-leveled factor to increase student achievement is to provide a guaranteed and viable curriculum. Has the most impact on student achievement Is the combination of two interdependent
factors▪ Opportunity to learn (OTL) ▪ Time
▪ Marzano (2003) , What Works in Schools
Guaranteed and Viable Curriculum

Intended Curriculum Implemented Curriculum Attained Curriculum
Discrepancy between the intended curriculum and the implemented curriculum is where Opportunity to Learn (OTL) makes a prominent factor in student achievement.
▪ Marzano (2003) , What Works in Schools
Guaranteed and Viable Curriculum

Action Steps - Increase OTL Identify and communicate the intended
curriculum Connect essential curriculum and
instructional time Sequence and organize essential content Ensure implemented curriculum Protect the instructional time available
Guaranteed and Viable Curriculum
Students should all be exposed to the same standards, knowledge, skills, and opportunity to learn in each class
▪ Marzano (2003) , What Works in Schools
If all students are expected to demonstrate the same knowledge and skills (attained curriculum), regardless of the teacher to which they are assigned, it only makes sense that teachers must work together in a collaborative effort to assess student learning.
Guaranteed and Viable Curriculum
and more importantly, learned !!!

How does this relate to common assessments?
Feedback is “information communicated to the learner that is intended to modify his or her thinking or behavior for the purpose of improving learning”
▪ John Hattie & Helen Timperley, (2007), The Power of Feedback
Assessment is the most common form of feedback
▪ Marzano, (2010), Formative Assessment & Standards-Based Grading
23

Common Assessments are frequent and common to all students in a class, grade, or content area.
Ex: All English 1 Honors
Algebra II
7th Grade Integrated Science
10th Grade American History, etc.
(Fullan, 2005a;Hargreaves & Fink, 2006; Reeves, 2004; Schomoker, 2003; Stiggins, 2005).
Common Assessments

One of the most
powerful, high-leverage
strategies for improving student learning
that is available to schools is the creation of Common
Assessments in the content areas.

Frequent, common, high-quality formative assessments help teachers inform instruction before summative assessment occurs. (Fix problems before failing).
Designed by teachers (experts) who are collaboratively working together (PLC)
To help a group of students develop agreed-upon knowledge and skills
Why such a powerful strategy?

Formative vs. Summative
FORMATIVE ASSESSMENTS
SUMMATIVE ASSESSMENTS
are assessments FOR learning
measure a few things frequently
are assessments OF learning
measure a lot of things once

Formative vs. Summative
FORMATIVE ASSESSMENTS
SUMMATIVE ASSESSMENTS
Answers the questions:
Are students learning what they need to learn?
Who needs additional time and support to learn?
Answers the question:
Which students learned what was intended and which did not?

Formative vs. Summative
FORMATIVE ASSESSMENTS
SUMMATIVE ASSESSMENTS
are timely, in-process measurements that inform teachers regarding the effectiveness of the: core curriculum instructional strategies interaction of these
with the learner.
determine whether students have met intended standards by a specific deadline.

Formative vs. Summative A medical analogy
FORMATIVE ASSESSMENTS
SUMMATIVE ASSESSMENTS
is like a physical exam can provide both the
“doctor” and the “patient” with timely information regarding the patient’s well-being
can help with a prescription for an ailing person
or assist a healthy person to become even stronger.
is like an autopsy
can provide useful information that explains why the ‘patient’ has failed or what has already happened
but the information often comes too late... at least from the patient’s
perspective.

Formative Assessments
Clearly defined goals related to learning and assessment
help teachers provide descriptive feedback to students
provides students with concrete information in how to improve
This feedback is due to in-depth analysis of the results.

Formative Assessments
The growth students experience helps to build confidence as learners
The growth teachers experience helps to build teacher efficacy and instructional skill set
32

Common Formative Assessments
Inform the practice of individual teachers.
provide teachers with a basis of comparison as students learn, skill by skill
how the performance of their students is similar to and different from other students who took the assessment.

Common Formative Assessments
In terms of RtI, this is called peer comparison data
It also assesses the effectiveness of the
core curriculum
instructional strategies
learning environment (opportunities to learn)
learner interaction with these elements
34

Common Formative Assessments
• Common formative assessments help identify groups of students who need additional support and time to ensure their learning.
• Everything students might SAY, DO, or CREATE has the potential to be formative because it can provide information about how much they understand and helps the teacher plan the next steps of instruction.• Obtrusive Assessments – take instructional time
• Unobtrusive Assessments – do not take instructional time
• Student generated assessments

Teachers in common courses in a school …
◦ Are responsible for ensuring students acquire knowledge and skills
◦ Will work together (it makes sense) ◦ Should divide responsibilities, No
duplication of effort (expensive!)
Team Work vs. Group Work

Team Work vs. Group Work
Teachers in common courses in a school …
◦ Use common data to inform and improve the practice of individual teachers as well as teams of teachers
◦ Use common data to build the capacity of the team to achieve at higher levels
◦ Have a ‘Plan B’ essential to systematic interventions when students do not learn.
37

So, what does it look like?


Start with the end in mind…
Start with the end in mind
◦ What do we want our students to learn?◦ What are the standards? Strands?◦ What are the assessments that we will use
to measure these standards? Strands?
Unpack the Standards, Map the Curriculum, Assessments, Units, and Lessons
How to begin?

How to begin?
◦ What curriculum will we use to teach these standards and strands?
◦ What lessons will we use to address the standards/strands?
◦ When will we measure?◦ What is our plan to address students
who need more time/instruction? (Plan B)?
43

As teachers analyze data, consider: For each question or assessment item –
how many students got it right, how many students got it wrong?
What does this tell you about the test question?
It is across all classrooms? Is the data different across the classrooms?
Collecting Data, considerations…

Collecting Data, considerations…
As teachers analyze data, consider: Did one teacher cover the material
differently? Does this reflect in the formative
measures, also? How can we address inclusion classes?
45

As teachers analyze data, consider: For each test item, for the students who
got it wrong, what did they choose? Is there a pattern to the ‘wrong’ answers chosen?
Did a lot of students choose answer B or are they spread out across B, C, and D if the answer is A?
Collecting Data, considerations…

Collecting Data, considerations…
As teachers analyze data, consider:
Is it a possible bad test item that needs to be re-written to assess the standard objective?
How will you determine this?
47

Formative - Summative

DeLaura Middle School:
Using Data to Close the
Achievement Gap

Review of Last Year…
Using Data to Drive Instruction What was required of teachers?
How did we get buy in? Lessons learned. 50
Collecting Data
Summative Assessments
Formative Assessments
51

Analyzing Data
Teacher Data Teams Summer meetingsDetermining strengths and weaknesses
52

Analyze Content Area Summative Assessments to Look for Trends, Problems, Strengths and Weaknesses.
53

School Culture: Creating Conditions for Success
Essential that teachers understand that the data is feedback, not an indictment.
Teachers will resist using data if they feel that the information will be used against them for evaluative or punitive purposes.
Leadership should facilitate school climates where it is professionally and emotionally safe to look at student data.
Teachers need to collaboratively examine classroom-level data so that they can identify and learn effective instructional techniques from each other
54

Taking Action
Curriculum mappingFormative assessmentsUsing the data to drive instructionReteaching – ensuring student
learning
55

Collaboration is the key to success!

Looking Back…•Summative Data•Historical Data
57

Building Level Challenges:DATA
Collection What is collected and who collects it? How frequently is it collected?
Organization Disaggregated by grade, gender, race, language,
SES? Designed to answer specific questions (Tier 1/2
effectiveness? Display-necessary to evaluate RtI
Goals/Benchmarks Aimline Trendline Rate
58

Analyze the past –
How did we do?
What problems can we identify?
What can we do better?
59

60

2006-07
2007-08
2008-09
2009-10
2010-11
2011-12
2012-13
2013-14
0
10
20
30
40
50
60
70
80
90
100
% Meeting High Stan-dards Read-ing
Linear (% Meeting High Stan-dards Read-ing)
% Making Learning Gains Read-ing
Linear (% Making Learning Gains Read-ing)
Awesome Elementary FCAT Reading Data Trends
Per
cen
t
61

CORE REPORTS
62

Student Desk Top Data System
63

Example: Turning Historical Data Into Action
Problem ID Several years of declining writing scores
Why is problem occurring? Lack of consistency with curriculum and
instruction in each class Lack of clear expectations for student
behaviors and performance What will we do about it?
64
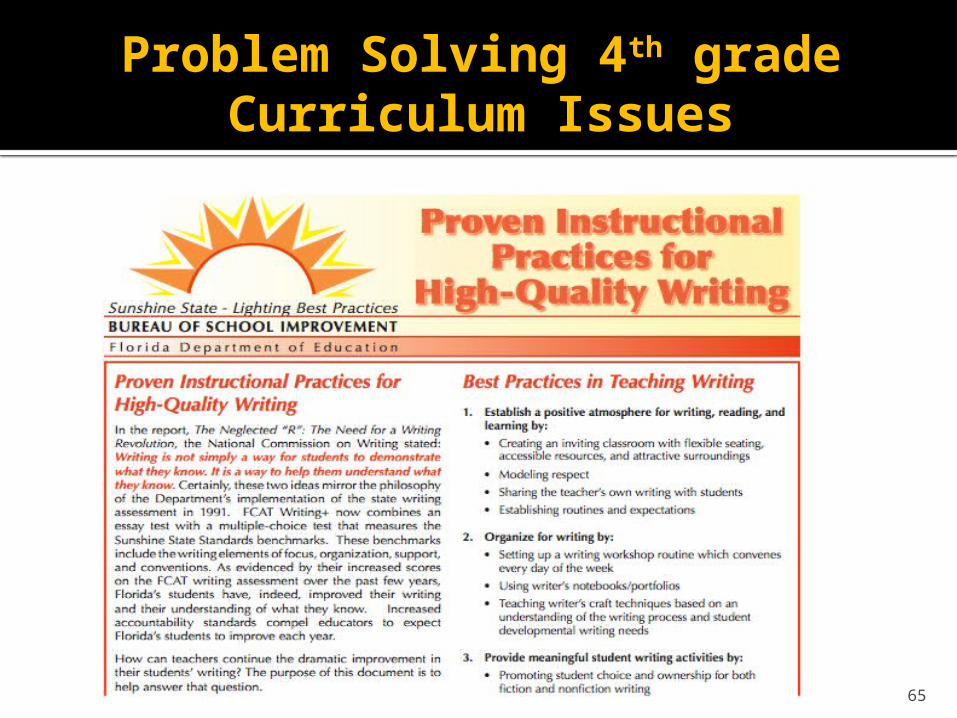
Problem Solving 4th gradeCurriculum Issues
65
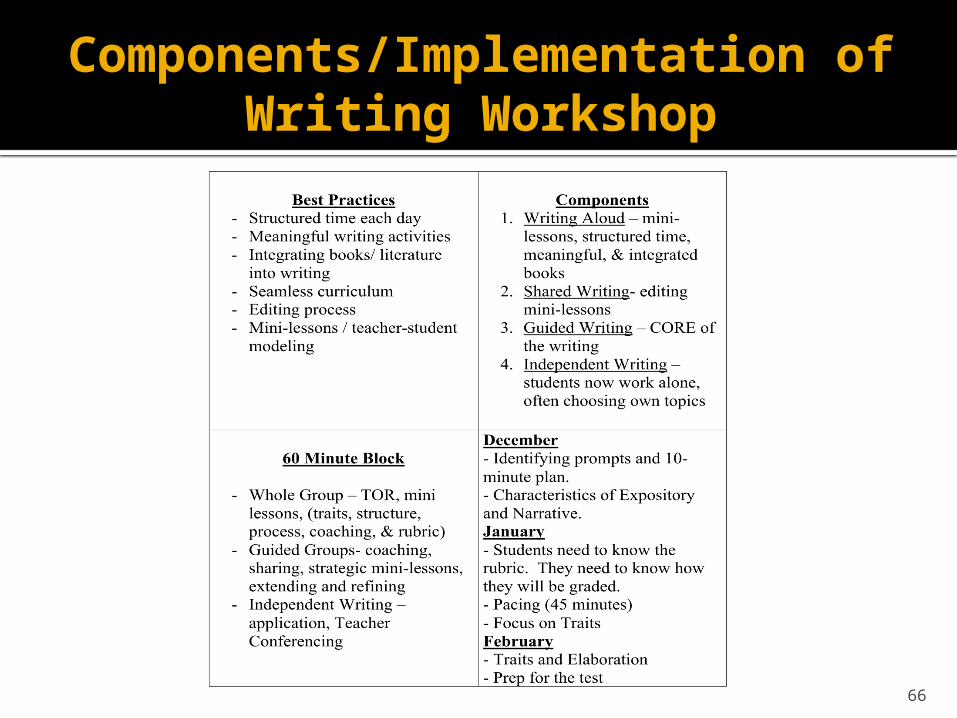
Components/Implementation of Writing Workshop
66

67

That doesn’t just happen…
It’s the result of Problem Solving
through Multiple Tiers of Instruction
and monitoring Response to Instruction/Intervention.
68

The Power of Great Assessment:
Using Rather Than Reporting Data Use Data to:
inform instructional strategies
measure growth over time identify
misunderstandings & measure mastery
Report Data to:
update parents, principals, school
track student’s progress Reward or consequence
students
69

Utilizing A3
To Document RtI
70

Using A3 to Manage RtI DataSchool Leadership Teams
Using CORE reports
71

Core Reports Is the Grade Level healthy?
Is the core meeting the needs of 80% of the students?
Are we meeting the needs of our
SUBGROUPS?
72

Activity
73
Look at the data
-What questions do you have?
- Do you have all the information you need to make choices?

Activity
74
Look at the data
- As a diagnostic test, what choices would you make?
- As a summative test, what choices would you make?

Using A3 to Manage RtI Data Teacher Data Teams
Area of Concern
Observations
Set up/ record meetings
75

Click on name of student, hit enter, and scroll down the page to Areas Of Concern (Tiers 1-2).
76

Scroll down the page to Areas Of Concern (Tiers 1-2).
77

Click on “Green Symbol” to open new window to create Areas Of Concern.
* Note: Please add a new Area of Concern for each subject area (e.g. reading, math), behavior, etc.
To DELETE an area of concern, click on the red X and then click on OKAY. 78

79

Select Learning Consideration by clicking on drop down box.
80

Enter information into Description Box and Comment Box. Click Okay to save information.
81

Once the Area of Concern has been created, your next step is to create as many interventions, progress monitoring updates, observations, assessments as needed .
Click on Magnifying Glass to enter information on the following areas: Observations, Interventions, Progress Monitoring
Click on red X to DELETE an area of concern and then click OKAY. 82

ADDING OBSERVATIONSAdd OBSERVATIONS by clicking on the Green Plus sign . Then click Okay.Update the OBSERVATION by clicking on the Magnifying Glass .
To DELETE progress monitoring click on the red X and then click OKAY.
83

84

Parent Conferences and other meetings can be documented in the MEETINGS section.Add MEETING information by clicking on the Green Plus sign . Then click Okay. Update MEETING info by clicking on the Magnifying Glass . To DELETE meeting info click on the red X and then click OKAY.
85

One Way To Do It:RtI Process for Secondary Schools
Roles and Responsibilities School-based Leadership Team (SBLT) Teacher Data Team (TDT)
Student Review System Identifying AYP-driven priority students
Timeline It’s not too late to start!

August-OctoberSBLT – Step 1
Review historical data from to discuss general Tier 1 strengths/weaknesses and set priorities for concern areas Tier 1 – B.E.S.T. model for improvement Tier 2 – Intervention reading and math Targeted at-risk students - AYP-focused
▪ Grade level(s)▪ Sub-group(s)

August - October SBLT – Step 2
Student Review System FAIR – Reading comp., MAZE, Word
analysis District Math and Science Assessments G.P.A. Attendance Behavior Teacher-directed

August - October SBLT – Step 3
Decide on time and place to provide a consensus survey with faculty Paper survey Online survey
Plan overview faculty training by RtI coach 15-20 minutes
Plan A3 faculty training by RtI coach 20 minutes in lab during plannings

August - October SBLT – Step 4
Identify/Appoint Teacher Data Team(s)
Middle Schools▪ MESH teams
High Schools▪ Four teachers, Guidance, Literacy Coach▪ All MESH and grade levels represented

September – OctoberData Collection and Review
Literacy Coach Lowest 25%, L1 and L2 students Works with reading teachers
RtI Coach L3 or above
Guidance Counselor Alert English teachers of identified
students from historical data for Tier 1 classroom supports

OctoberTDT Preparation
Student Review System is updated RtI Coach and Literacy Coach
SBLT - prioritizes students for TDT review and problem-solving
Guidance Counselor – contacts all teachers of priority students for A3 observational input
TDT – meets to review and problem-solve

HOLDING EFFECTIVE TEACHER DATA TEAM
MEETINGS
93
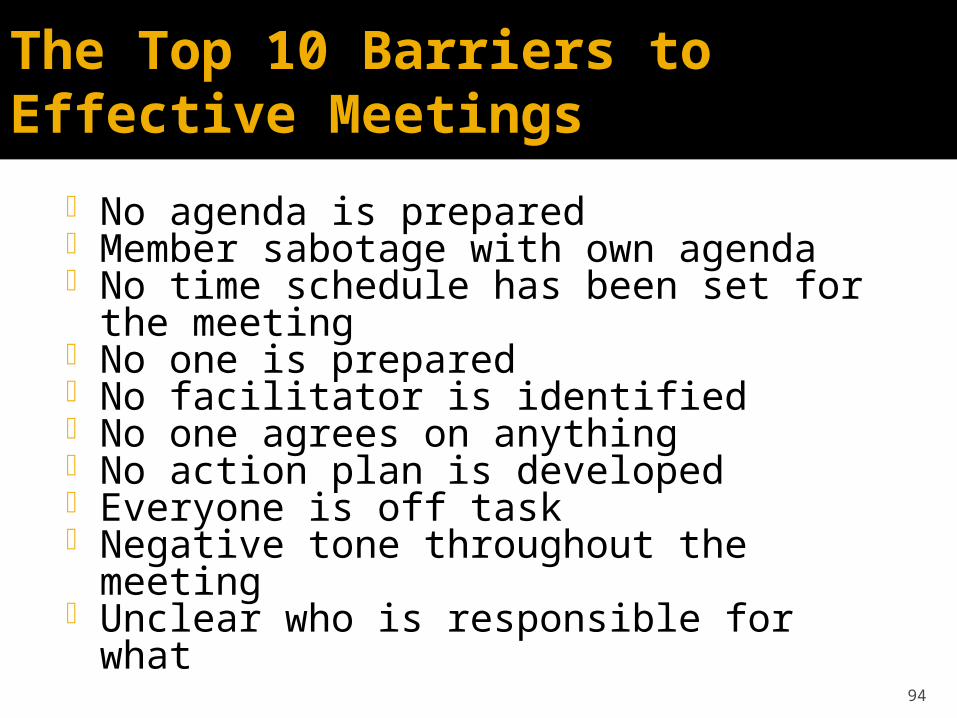
The Top 10 Barriers to Effective Meetings
• No agenda is prepared• Member sabotage with own agenda• No time schedule has been set for the
meeting• No one is prepared• No facilitator is identified• No one agrees on anything• No action plan is developed• Everyone is off task• Negative tone throughout the meeting• Unclear who is responsible for what
94

Teacher Data Meetings
PURPOSE
Student AchievementCollaborate to problem
solve and plan interventions both at Tier 1 and Tier 2 level
Monitor student progress
Learn from each other 95

Defining Roles
Work with your team to develop a job description for each of these Teacher Data team roles and assign a school-based person to each.
Facilitator Timekeeper
Recorder96

Problem Solving Process –Florida’s Model
EvaluateDid the plan work?
Problem AnalysisWhy is it occurring?
Problem IdentificationWhat is the problem?
Develop and Implement PlanWhat can we do about it?

OctoberTDT Problem-Solving
What are the problems? Individual and/or group
Why are they occurring? ICEL – individual and/or group (focus on
ICE) Hypothesis
What are we going to do about it? MESH Tier 1 classroom strategies
Is it working? Review in December/January
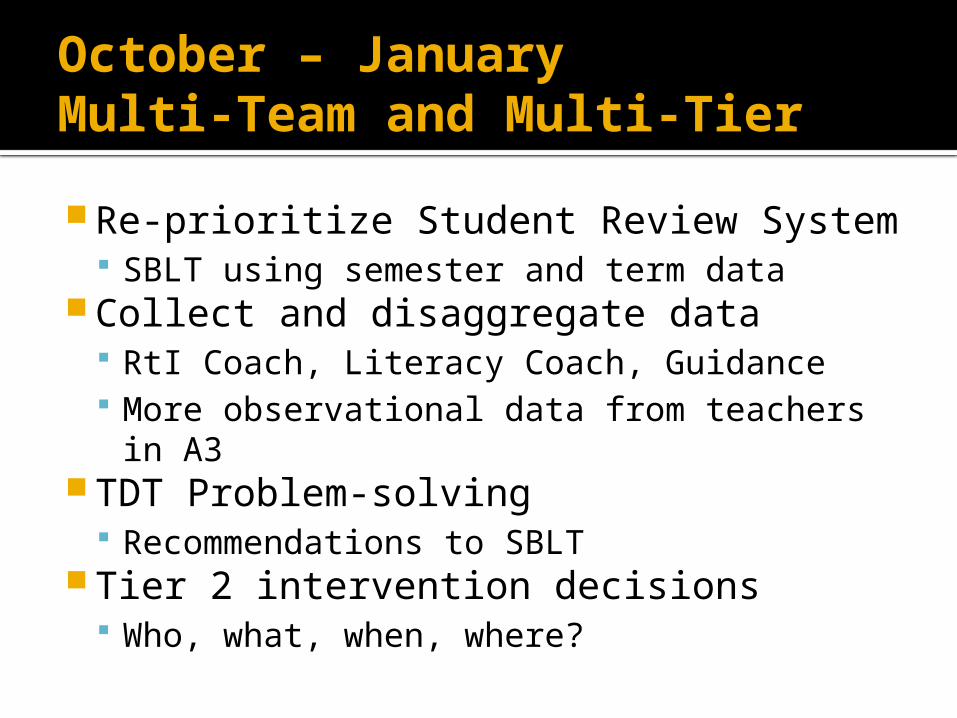
October – JanuaryMulti-Team and Multi-Tier
Re-prioritize Student Review System SBLT using semester and term data
Collect and disaggregate data RtI Coach, Literacy Coach, Guidance More observational data from teachers in
A3 TDT Problem-solving
Recommendations to SBLT Tier 2 intervention decisions
Who, what, when, where?

January – MarchPriority Students Tier 2
Priority students receive Tier 2 additional interventions
Jefferson Middle School - 2010 Who: AP and ASP-funded proctor What: Voyager computer-based program When: Once a week during activity
period Where: Computer lab
March – MaySBLT and TDT – What Now?
SBLT - Is it Working? Review Tier 1 and Tier 2 data Begin planning for next year
▪ Instructional PD, curriculum mapping, school-wide environmental issues
TDT Review priority student Tier 2 data and
make MESH recommendations Review problem-solving process for
lessons learned

IPST Teacher-directed referral
▪ TBD Parent-directed referral
▪ TBD Re-evaluation
▪ TBD
102

Wrapping- Up Use of common formative and summative
assessments to enhance Tier 1 data collection Data Tracking of Assessments for Curriculum
Alignment with Standards Different Data to Analyze Tier 1 Health SBLT Process Responsibilities for Identifying
and Tracking Targeted At-Risk Student Populations
TDT Problem-Solving and Recommendations for Tier 1 and Tier 2 Services
IPST Process for Parent Request, Teacher Request, and Re-Evaluation
103