1 / 19 perspective on visualizing social sciences remco chang charlotte visualization center unc...
Post on 19-Dec-2015
218 views
TRANSCRIPT

1 / 19
Perspective on Visualizing Social Sciences
Remco ChangCharlotte Visualization Center
UNC Charlotte

2 / 19
Financial Visual Analysis
• UNC Charlotte’s success with Bank of America and financial visual analytics– Fraudulent Wire Transaction Analysis– “Finding a needle in a stack of needles” – Bill Fox
• Failure of a blackbox approach
• The Art and Science of analysis

3 / 19
Financial Visual Analysis
4 / 19
What is Information Visualization?
• A case study of how a visualization application differs from a visual analytical tool…
5 / 19
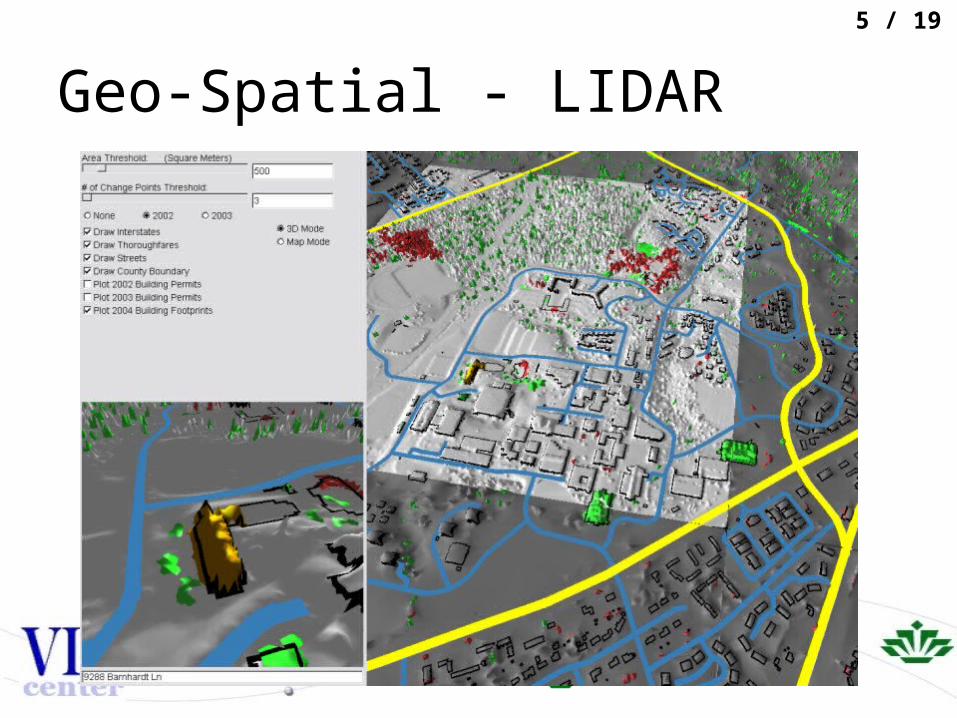
Geo-Spatial - LIDAR

6 / 19
Geo-Spatial - LIDAR

7 / 19
Geo-Spatial - LIDAR
• Identify buildings without permits
• It’s a useful application…
• but it’s not an analysis tool.

8 / 19
Geo-Spatial - LIDAR

9 / 19
Geo-Spatial - LIDAR

10 / 19
Geo-Spatial - LIDAR
Suburban Region City Center Difference

11 / 19
Geo-Spatial – Urban Analysis
• DIA presentations mentioned Google Earth’s short coming
• Demo of UrbanVis

12 / 19
Geo-Spatial – Urban Analysis
• Query-free Exploration– no need to generate n(n-1)/2 plots to find
relationships between every two variables– you don’t have to know what you’re looking for…
• “Here’s what I’m interested in, there’s where it is”– Combination of data analysis and GIS

13 / 19
Agent-Based Modeling
• DARPA sponsored project• Modeling Afghanistan• Using off-the-shelf package (NetLogo)
• (show NetLogo image)

14 / 19
Agent-Based Modeling

15 / 19
Agent-Based Modeling

16 / 19
Agent-Based Modeling

17 / 19
Agent-Based Modeling• Details on demand
• Juxtaposes different variables for comparison in one glance
• Allows for multiple resolutions• A framework for combining different models
• Would work great in a collaborative environment such as a multi-touch table

18 / 19
Agent-Based Modeling
• Visualization is not an after thought…
• Embed analysis and reasoning directly into the visualization
19 / 19
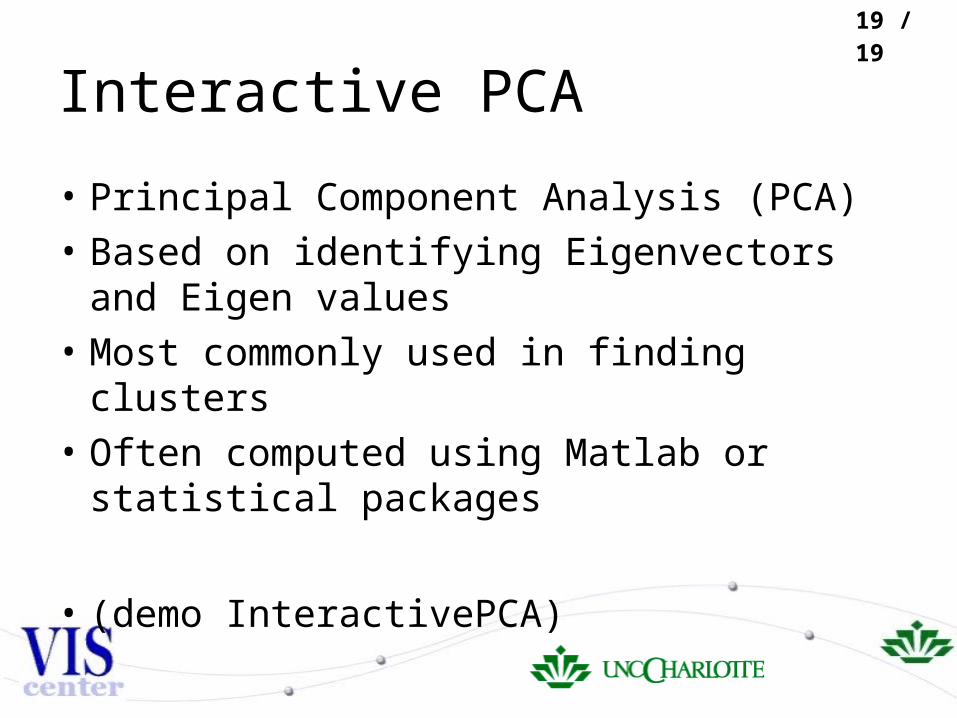
Interactive PCA
• Principal Component Analysis (PCA)• Based on identifying Eigenvectors and Eigen
values• Most commonly used in finding clusters• Often computed using Matlab or statistical
packages
• (demo InteractivePCA)
20 / 19
Backup

21 / 19
PCA

22 / 19
• Fincen: Financial Crime Enforcement Network, part of Dept of Treasury
• Bill Fox - Senior Vice President and Senior Compliance Executive at Bank of America