1 11 league of cities
TRANSCRIPT

Strengthening California Cities through Advocacy & Education
The Voice for Real Estate

It’s important to keep real estate
in perspective…
Things aren’t always what they seem.

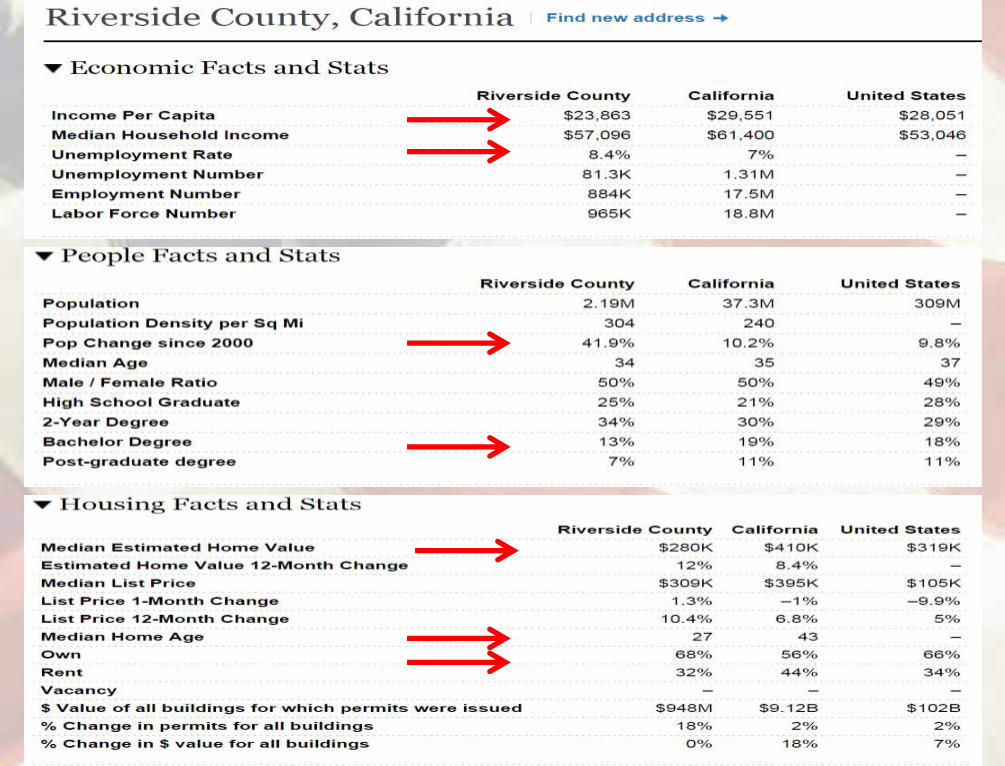


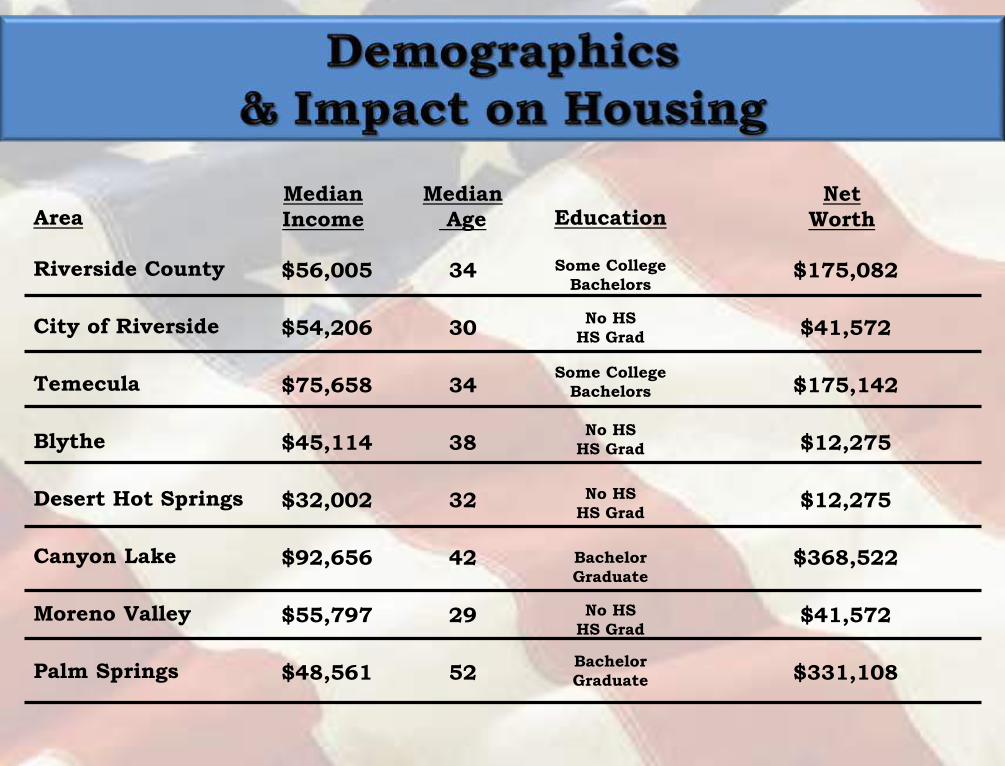
Area
Riverside County
City of Riverside
Temecula
Blythe
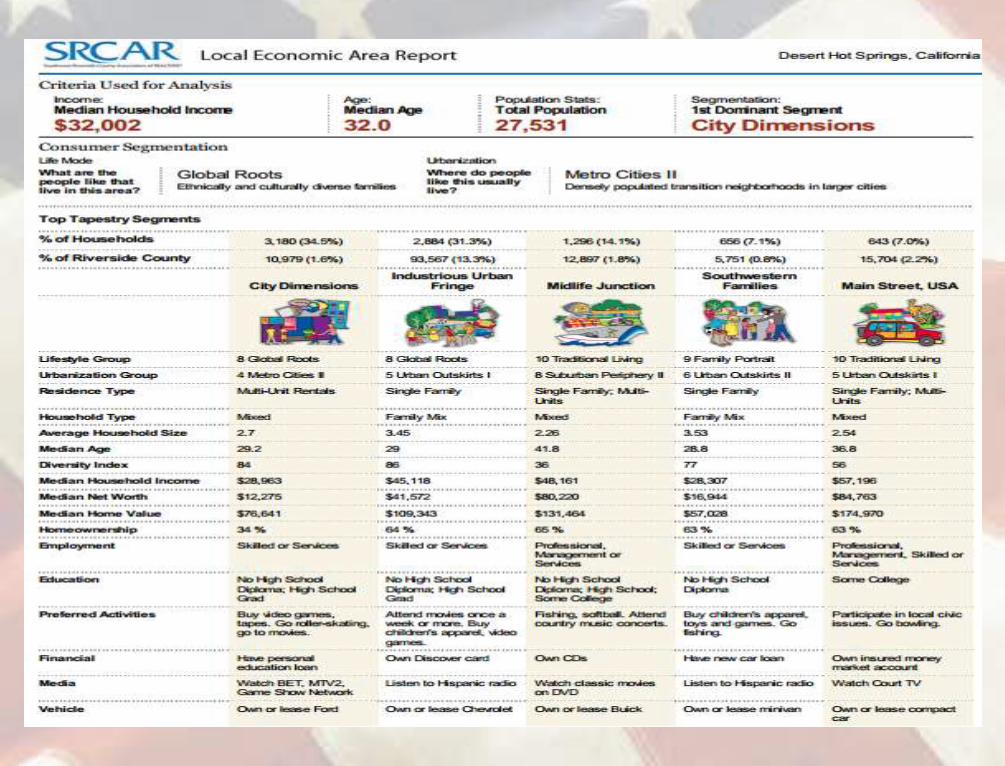
Desert Hot Springs
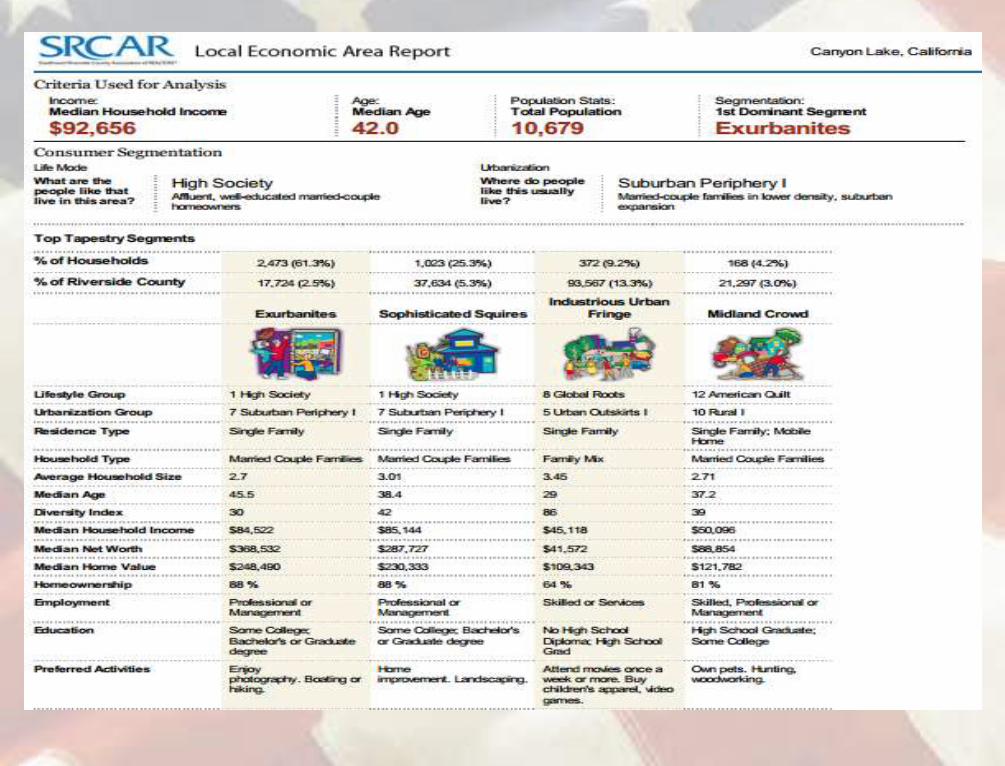
Canyon Lake
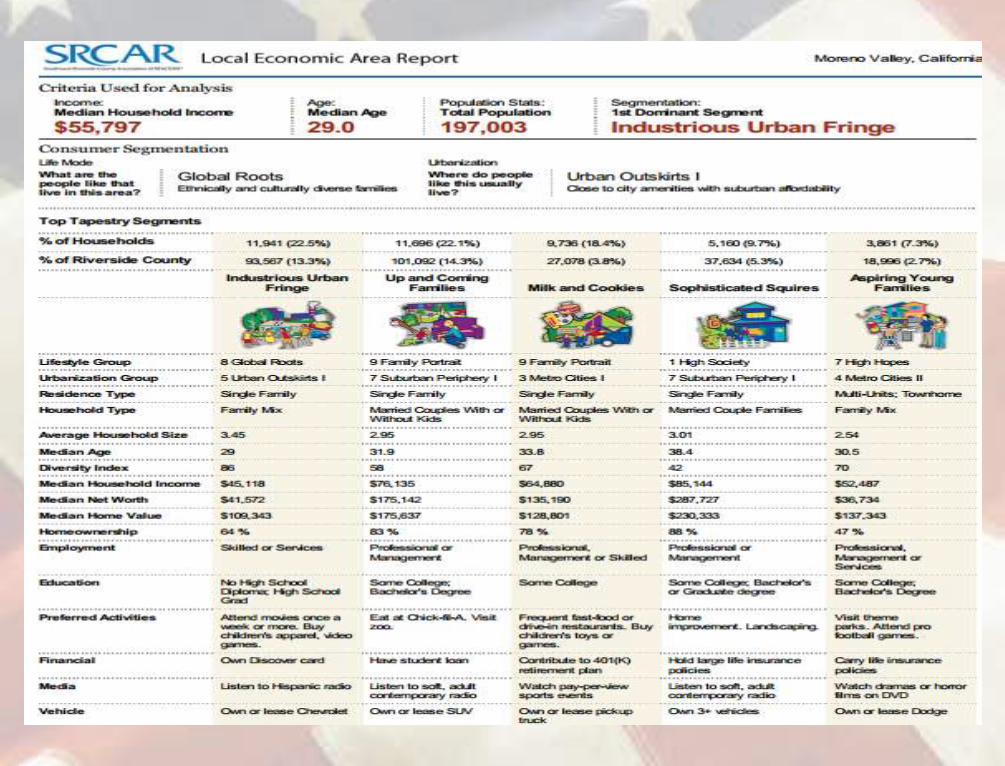
Moreno Valley
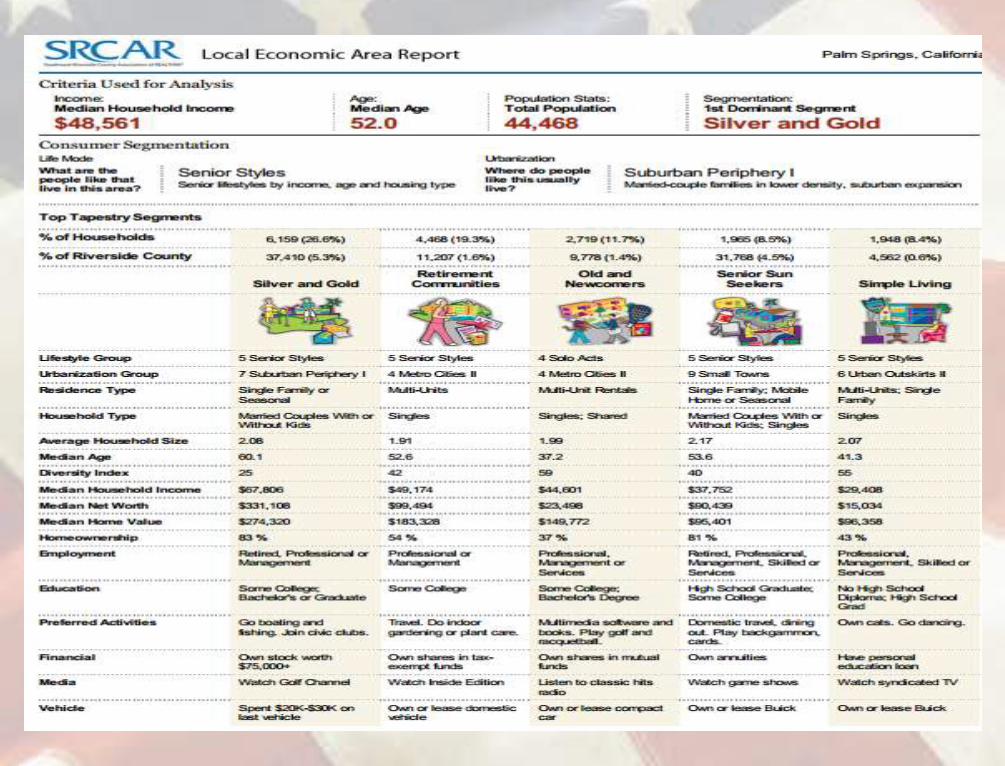
Palm Springs
Median
Income
$56,005
$54,206
$75,658
$45,114
$32,002
$92,656
$55,797
$48,561
Median
Age
34
30
34
38
32
42
29
52
Education
Some College
Bachelors
No HS
HS Grad
Some College
Bachelors
No HS
HS Grad
No HS
HS Grad
Bachelor
Graduate
No HS
HS Grad
Bachelor
Graduate
Net
Worth
$175,082
$41,572
$175,142
$12,275
$12,275
$368,522
$41,572
$331,108


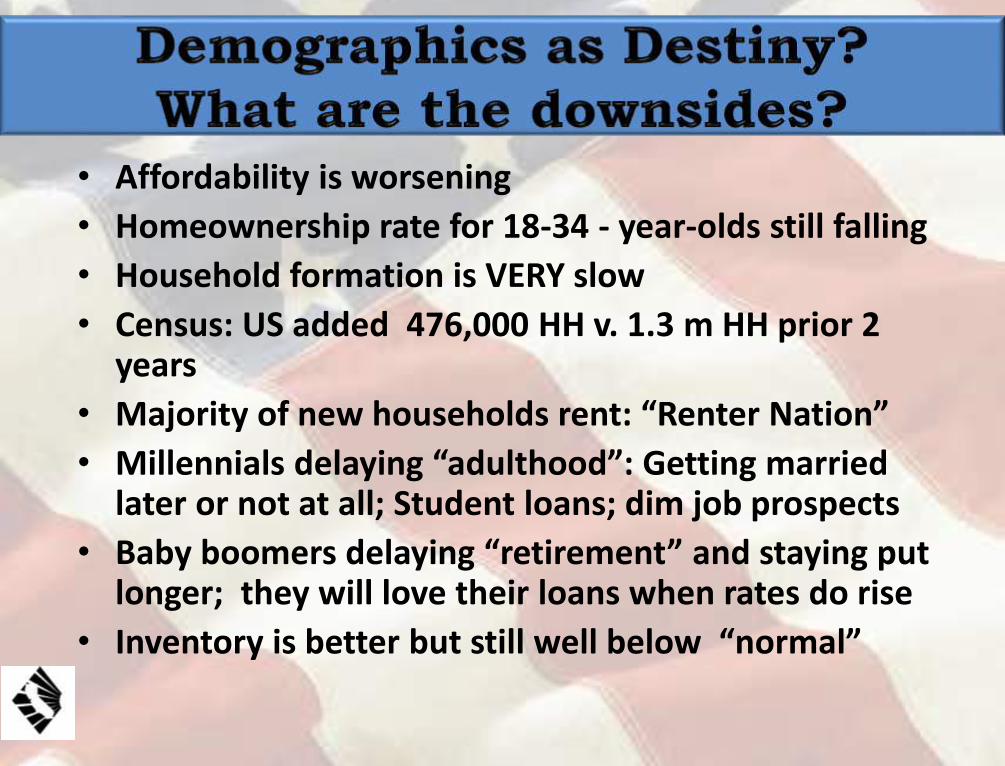
• Affordability is worsening
• Homeownership rate for 18-34 - year-olds still falling
• Household formation is VERY slow
• Census: US added 476,000 HH v. 1.3 m HH prior 2 years
• Majority of new households rent: “Renter Nation”
• Millennials delaying “adulthood”: Getting married later or not at all; Student loans; dim job prospects
• Baby boomers delaying “retirement” and staying put longer; they will love their loans when rates do rise
• Inventory is better but still well below “normal”

CA Home Sales: 2000 – 2014
-5.8%-8.2%
-40%
-30%
-20%
-10%
0%
10%
20%
30%
40%
-
100,000
200,000
300,000
400,000
500,000
600,000
700,000
Sales Percent Change
SERIES: Sales of Existing Detached HomesSOURCE: CALIFORNIA ASSOCIATION OF REALTORS®
Units YOY % Chg
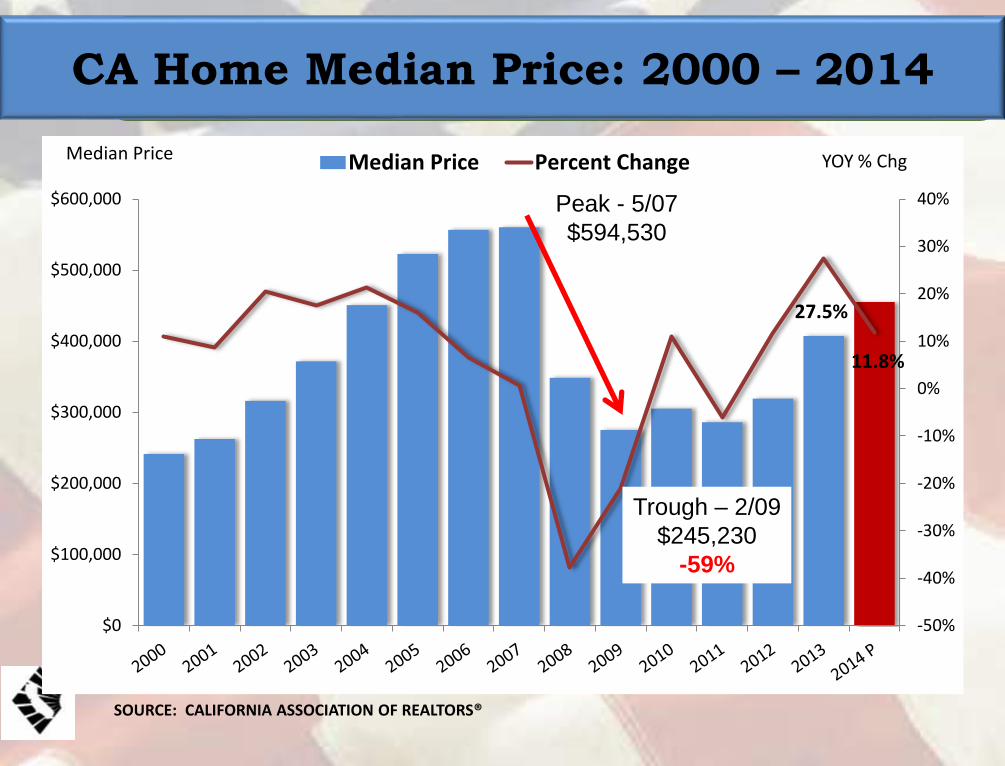
CA Home Median Price: 2000 – 2014
27.5%
11.8%
-50%
-40%
-30%
-20%
-10%
0%
10%
20%
30%
40%
$0
$100,000
$200,000
$300,000
$400,000
$500,000
$600,000
Median Price Percent Change
SOURCE: CALIFORNIA ASSOCIATION OF REALTORS®
Median Price YOY % Chg
Peak - 5/07
$594,530
Trough – 2/09
$245,230
-59%

0
500
1000
1500
2000
2500
1/1
1
2/1
1
3/1
1
4/1
1
5/1
1
6/1
1
7/1
1
8/1
1
9/1
1
10
/11
11
/11
12
/11
1/1
2
2/1
2
3/1
2
4/1
2
5/1
2
6/1
2
7/1
2
8/1
2
9/1
2
10
/12
11
/12
12
/12
1/1
3
2/1
3
3/1
3
4/1
3
5/1
3
6/1
3
7/1
3
8/1
3
9/1
3
10
/13
11
/13
12
/13
1/1
4
2/1
4
3/1
4
4/1
4
5/1
5
6/1
4
7/1
4
8/1
4
9/1
4
10
/14
Inventory Sales
Southwest California
Inventory v Sales
REO’s & SS Decline
Standard SalesIncrease
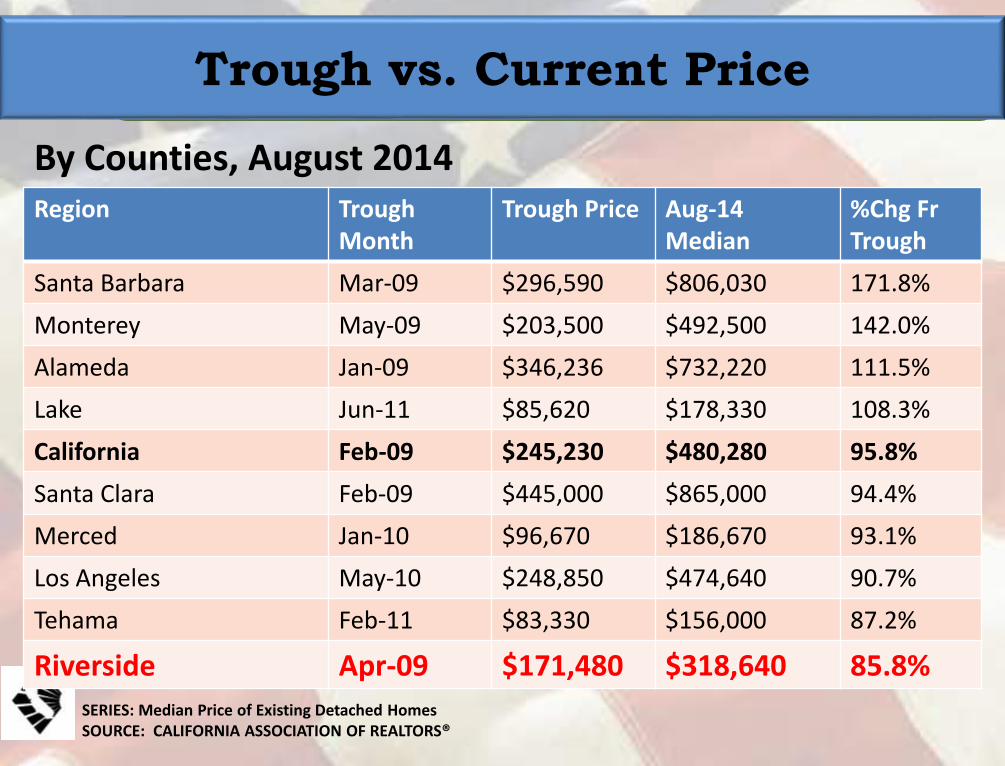
Trough vs. Current Price
By Counties, August 2014
SERIES: Median Price of Existing Detached HomesSOURCE: CALIFORNIA ASSOCIATION OF REALTORS®
Region Trough Month
Trough Price Aug-14Median
%Chg FrTrough
Santa Barbara Mar-09 $296,590 $806,030 171.8%
Monterey May-09 $203,500 $492,500 142.0%
Alameda Jan-09 $346,236 $732,220 111.5%
Lake Jun-11 $85,620 $178,330 108.3%
California Feb-09 $245,230 $480,280 95.8%
Santa Clara Feb-09 $445,000 $865,000 94.4%
Merced Jan-10 $96,670 $186,670 93.1%
Los Angeles May-10 $248,850 $474,640 90.7%
Tehama Feb-11 $83,330 $156,000 87.2%
Riverside Apr-09 $171,480 $318,640 85.8%
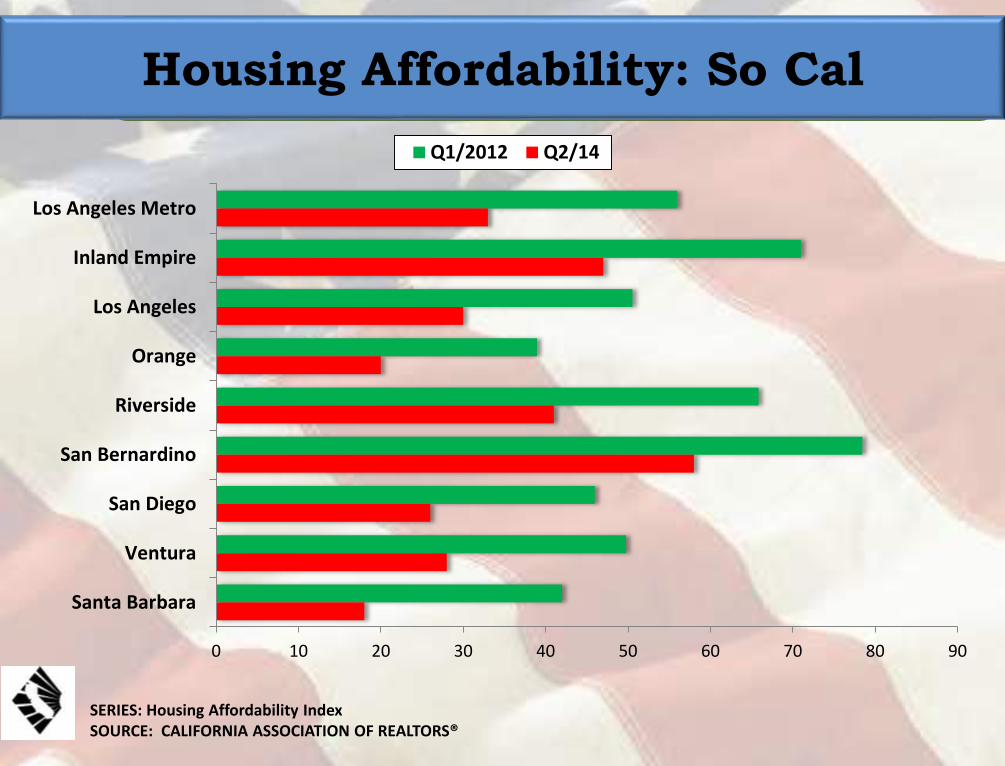
Housing Affordability: So Cal
0 10 20 30 40 50 60 70 80 90
Los Angeles Metro
Inland Empire
Los Angeles
Orange
Riverside
San Bernardino
San Diego
Ventura
Santa Barbara
Q1/2012 Q2/14
SERIES: Housing Affordability IndexSOURCE: CALIFORNIA ASSOCIATION OF REALTORS®
$-
$100,000
$200,000
$300,000
$400,000
$500,000
$600,000 California US
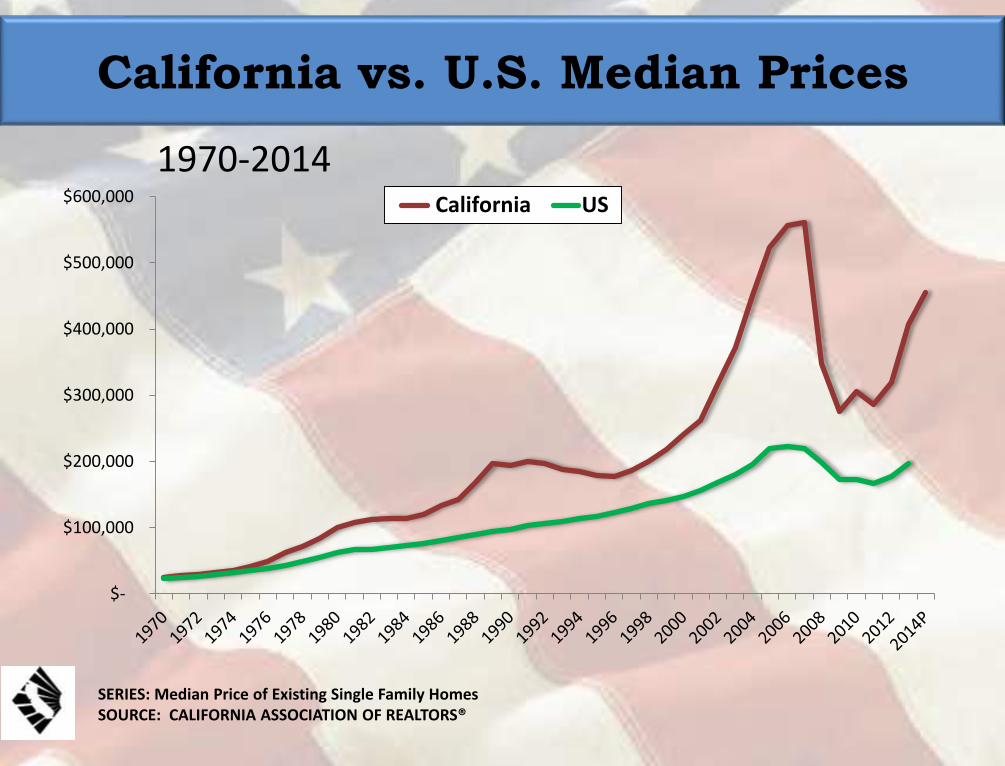
California vs. U.S. Median Prices
1970-2014
SERIES: Median Price of Existing Single Family HomesSOURCE: CALIFORNIA ASSOCIATION OF REALTORS®
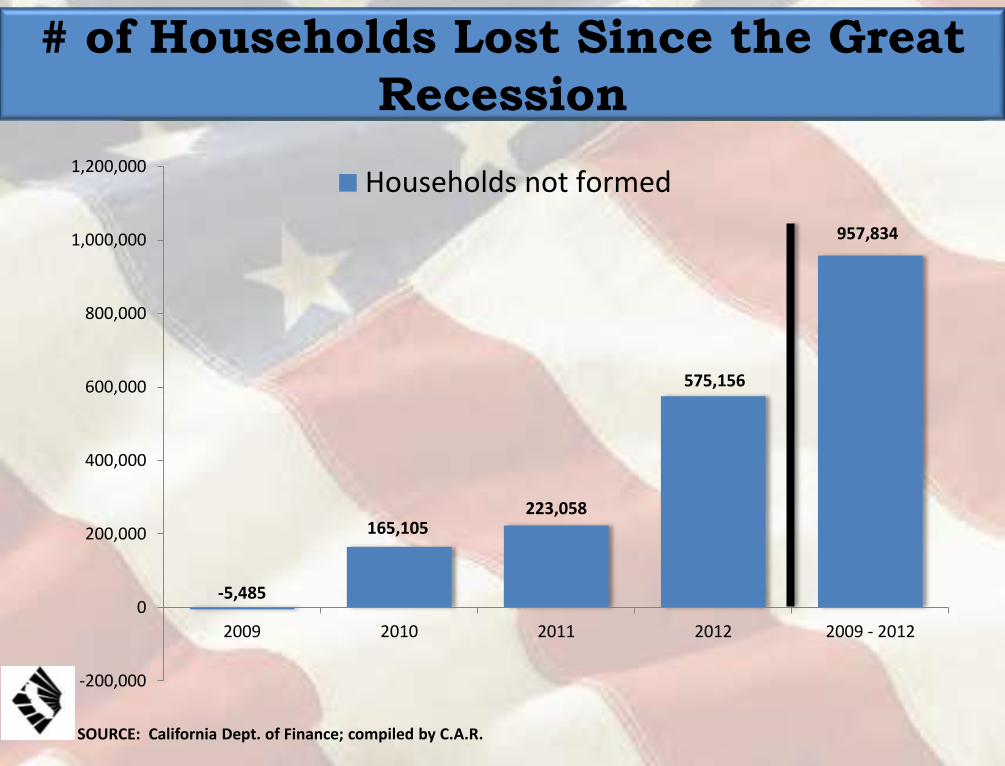
-5,485
165,105223,058
575,156
957,834
-200,000
0
200,000
400,000
600,000
800,000
1,000,000
1,200,000
2009 2010 2011 2012 2009 - 2012
Households not formed
# of Households Lost Since the Great
Recession
SOURCE: California Dept. of Finance; compiled by C.A.R.
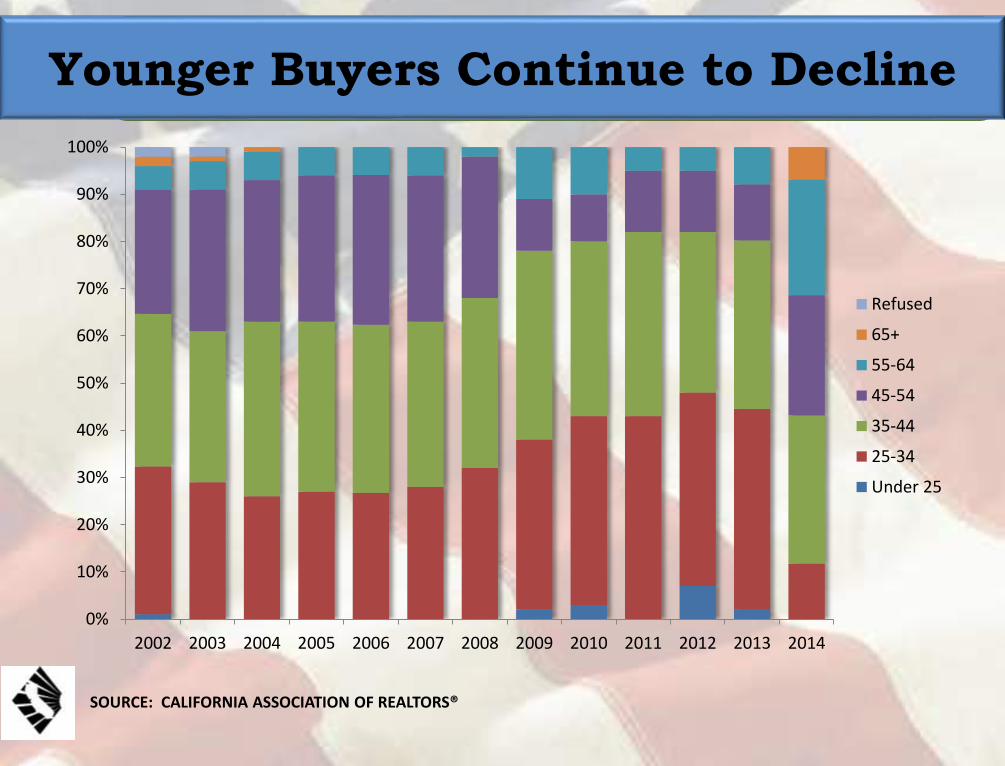
Younger Buyers Continue to Decline
0%
10%
20%
30%
40%
50%
60%
70%
80%
90%
100%
2002 2003 2004 2005 2006 2007 2008 2009 2010 2011 2012 2013 2014
Refused
65+
55-64
45-54
35-44
25-34
Under 25
SOURCE: CALIFORNIA ASSOCIATION OF REALTORS®
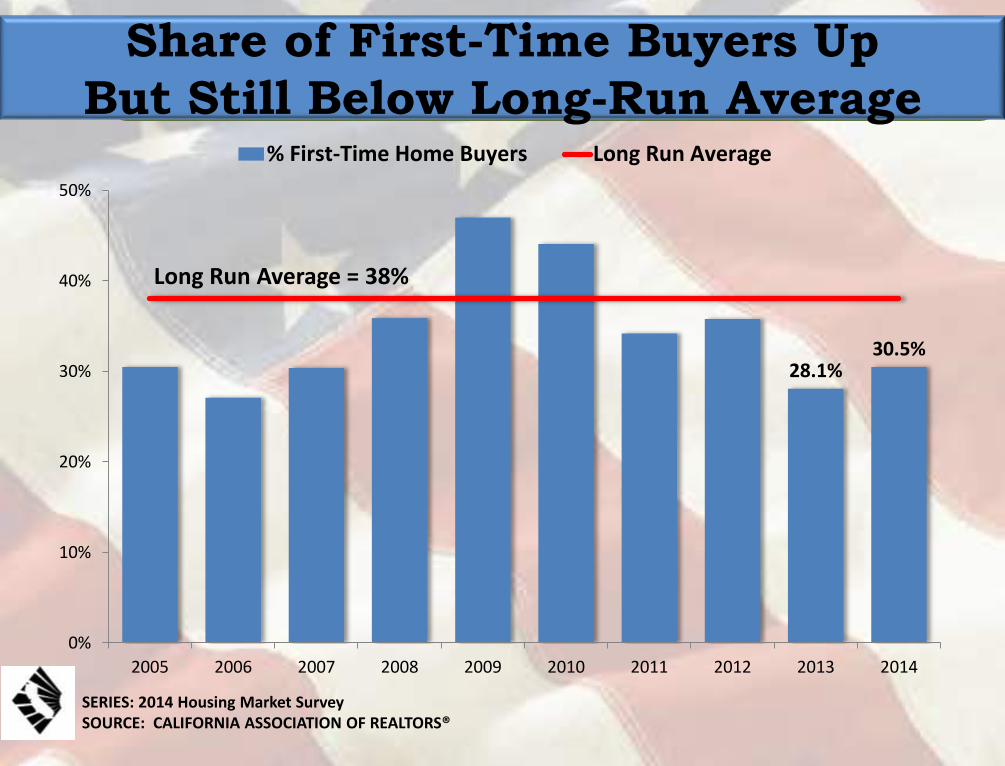
Share of First-Time Buyers Up
But Still Below Long-Run Average
28.1%30.5%
0%
10%
20%
30%
40%
50%
2005 2006 2007 2008 2009 2010 2011 2012 2013 2014
% First-Time Home Buyers Long Run Average
Long Run Average = 38%
SERIES: 2014 Housing Market SurveySOURCE: CALIFORNIA ASSOCIATION OF REALTORS®
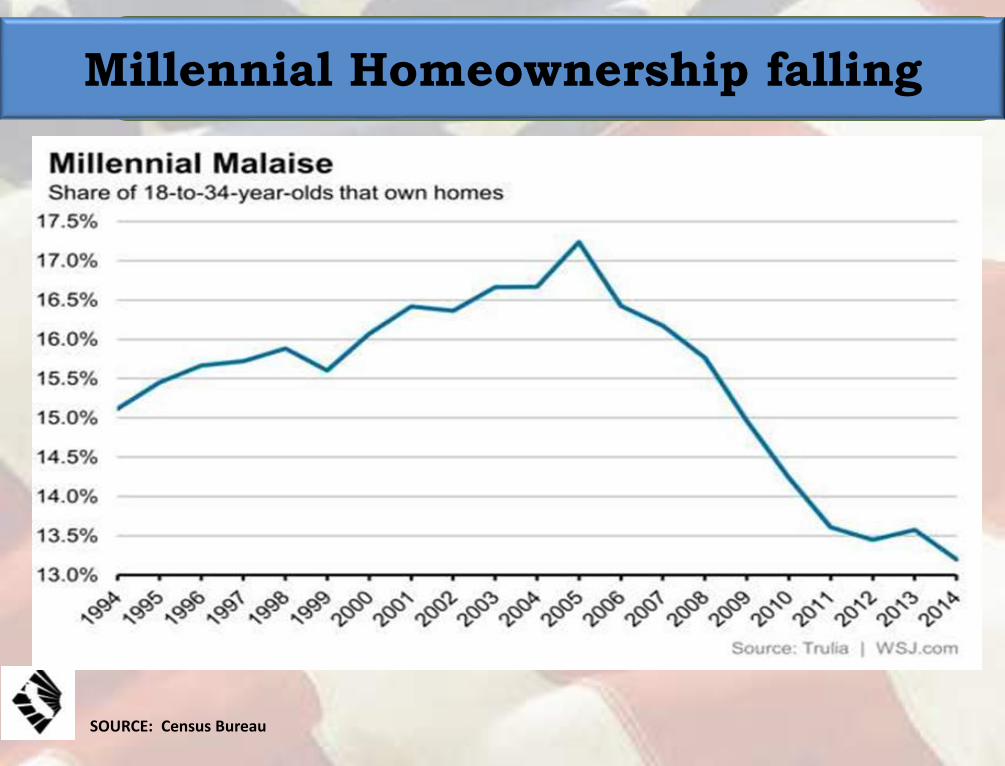
Millennial Homeownership falling
SOURCE: Census Bureau
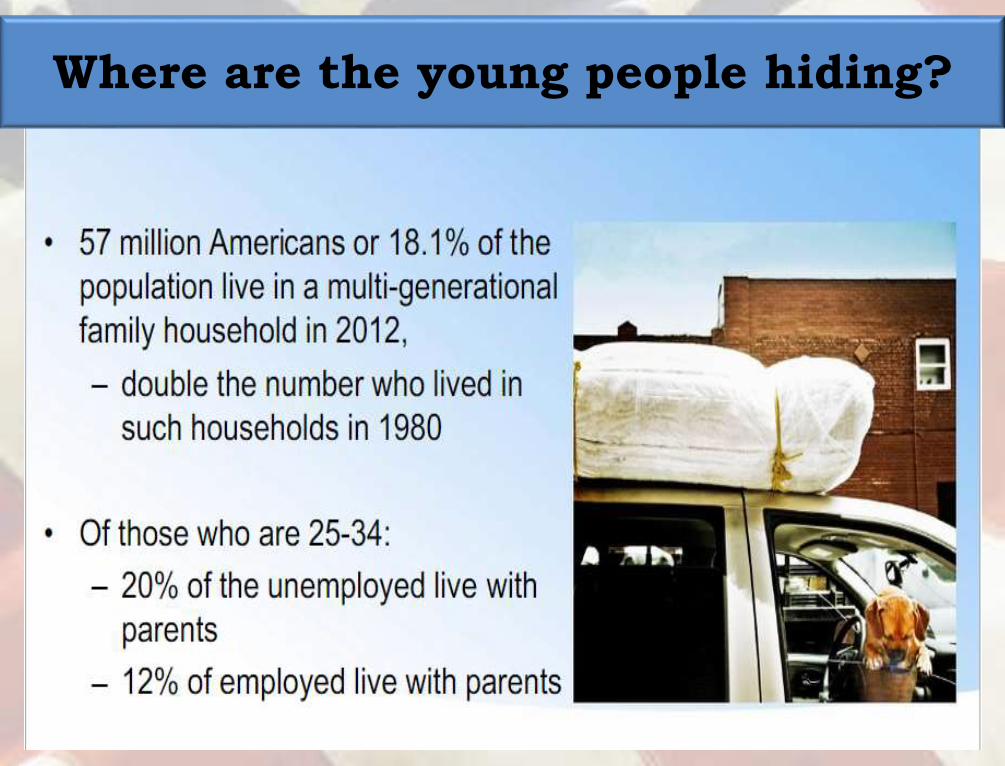
Where are the young people hiding?
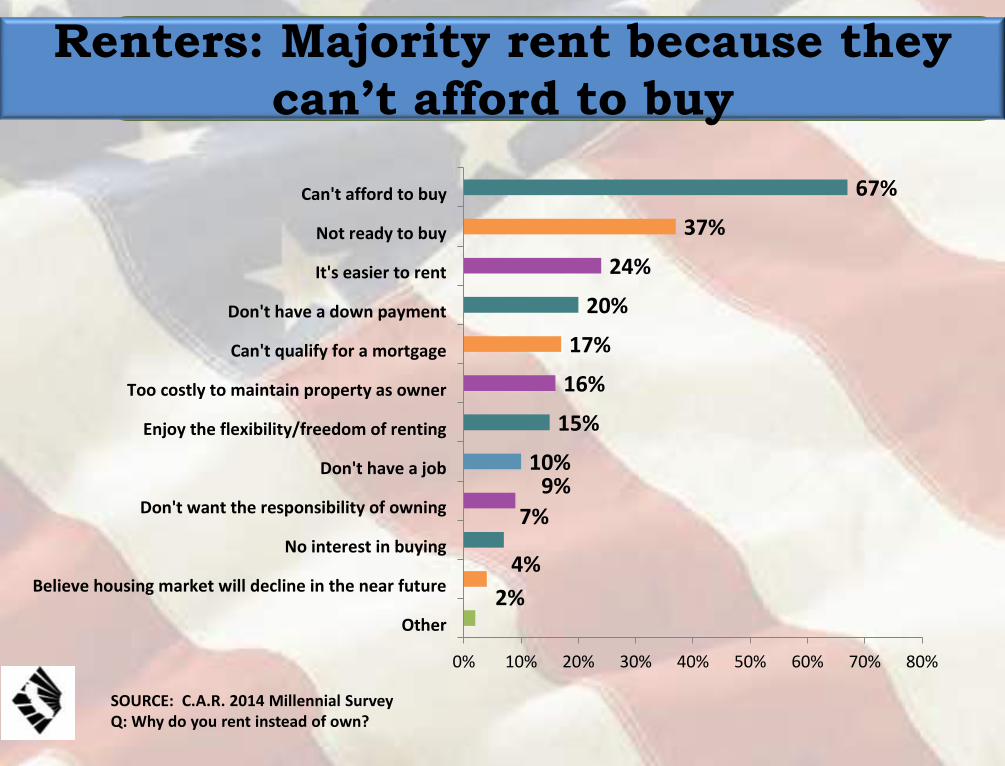
Renters: Majority rent because they
can’t afford to buy
SOURCE: C.A.R. 2014 Millennial SurveyQ: Why do you rent instead of own?
2%
4%
7%
9%10%
15%
16%
17%
20%
24%
37%
67%
0% 10% 20% 30% 40% 50% 60% 70% 80%
Other
Believe housing market will decline in the near future
No interest in buying
Don't want the responsibility of owning
Don't have a job
Enjoy the flexibility/freedom of renting
Too costly to maintain property as owner
Can't qualify for a mortgage
Don't have a down payment
It's easier to rent
Not ready to buy
Can't afford to buy
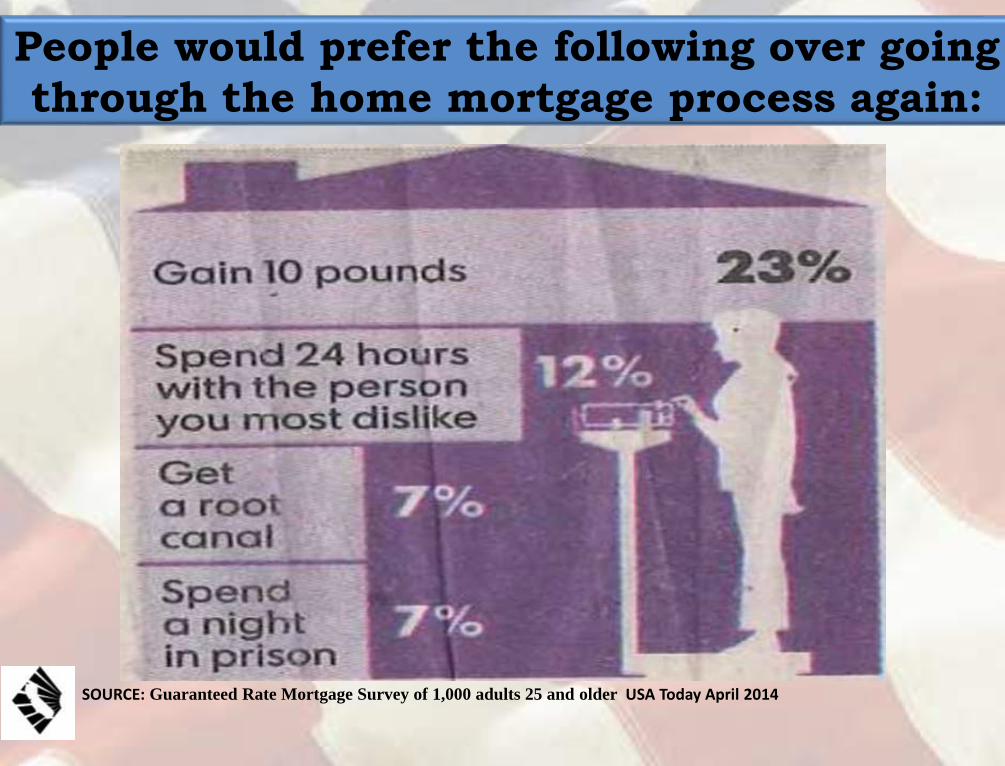
People would prefer the following over going
through the home mortgage process again:
SOURCE: Guaranteed Rate Mortgage Survey of 1,000 adults 25 and older USA Today April 2014

Housing Fundamentals are positive.
What are some upsides?
• Mortgage rates are low & lending is loosening up a bit
• Affordability is still good and price gains are slowing
• Foreclosure & delinquency rates are low & distressed sales are less than 10% of the market
• Investors are leaving creating more opportunity for buyers needing financing
• Overall homeownership rate has stabilized
• International demand for housing in CA still strong
• Construction is up – residential and non-residential

Share of underwater Mortgages in Plunging
Q409 – Q114Share of Underwater Mortgages is Plunging
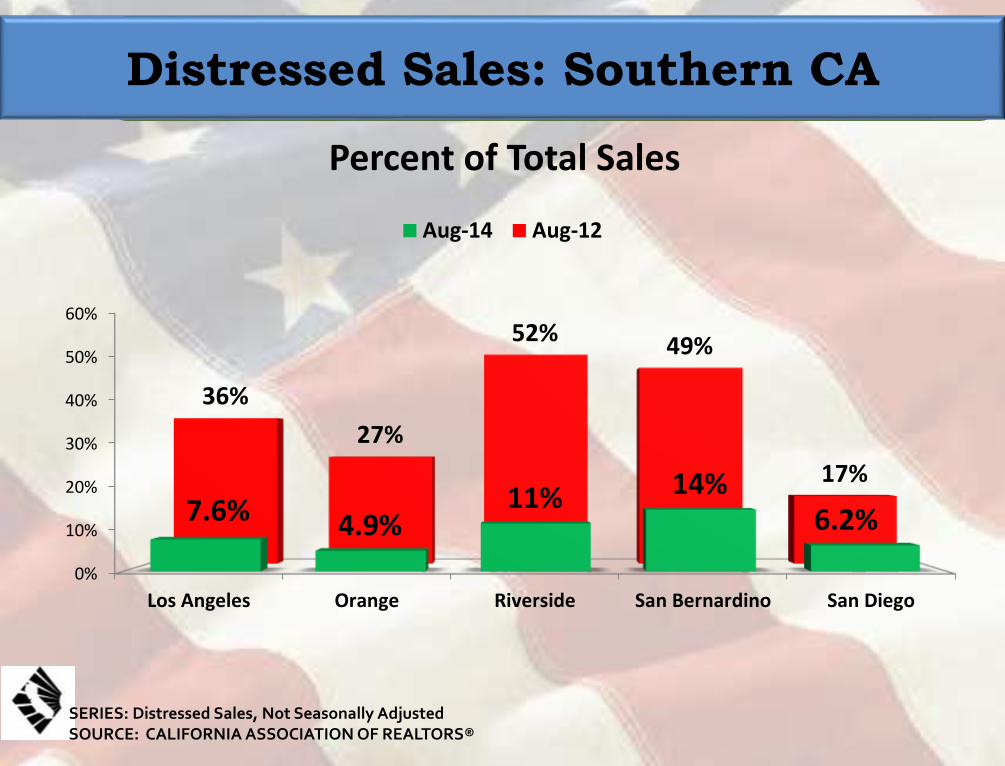
Distressed Sales: Southern CA
Percent of Total Sales
0%
10%
20%
30%
40%
50%
60%
Los Angeles Orange Riverside San Bernardino San Diego
7.6% 4.9%11% 14%
6.2%
36%
27%
52% 49%
17%
Aug-14 Aug-12
SERIES: Distressed Sales, Not Seasonally AdjustedSOURCE: CALIFORNIA ASSOCIATION OF REALTORS®
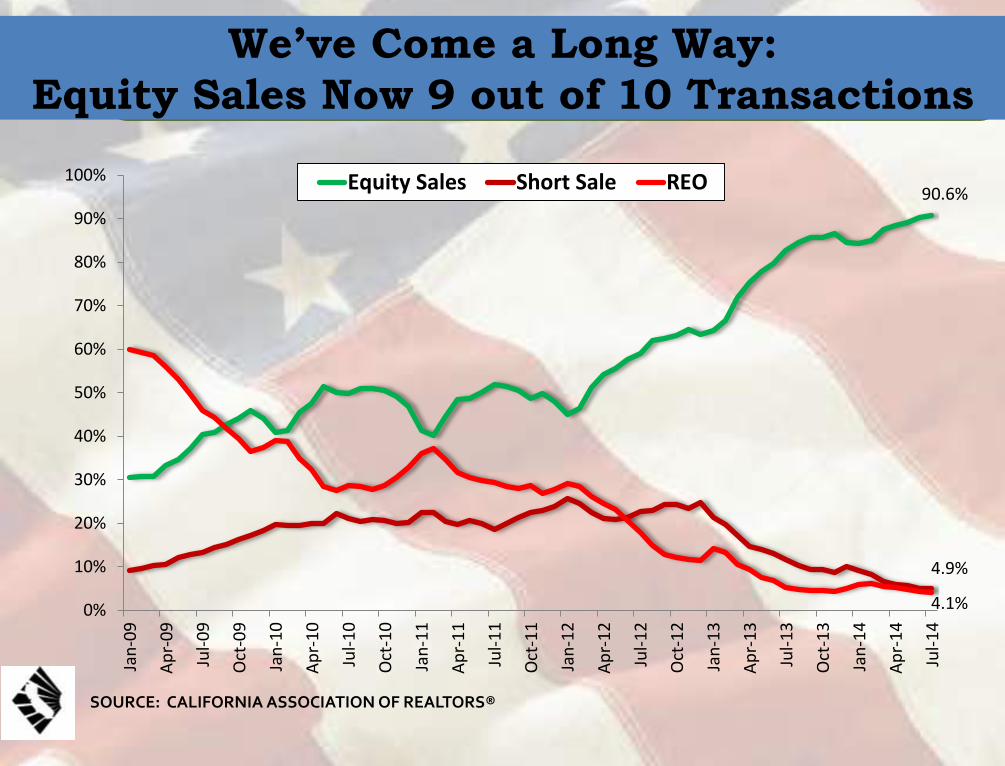
We’ve Come a Long Way:
Equity Sales Now 9 out of 10 Transactions
90.6%
4.9%
4.1%0%
10%
20%
30%
40%
50%
60%
70%
80%
90%
100%
Jan
-09
Ap
r-0
9
Jul-
09
Oct
-09
Jan
-10
Ap
r-1
0
Jul-
10
Oct
-10
Jan
-11
Ap
r-1
1
Jul-
11
Oct
-11
Jan
-12
Ap
r-1
2
Jul-
12
Oct
-12
Jan
-13
Ap
r-1
3
Jul-
13
Oct
-13
Jan
-14
Ap
r-1
4
Jul-
14
Equity Sales Short Sale REO
SOURCE: CALIFORNIA ASSOCIATION OF REALTORS®
0
50,000
100,000
150,000
200,000
250,000
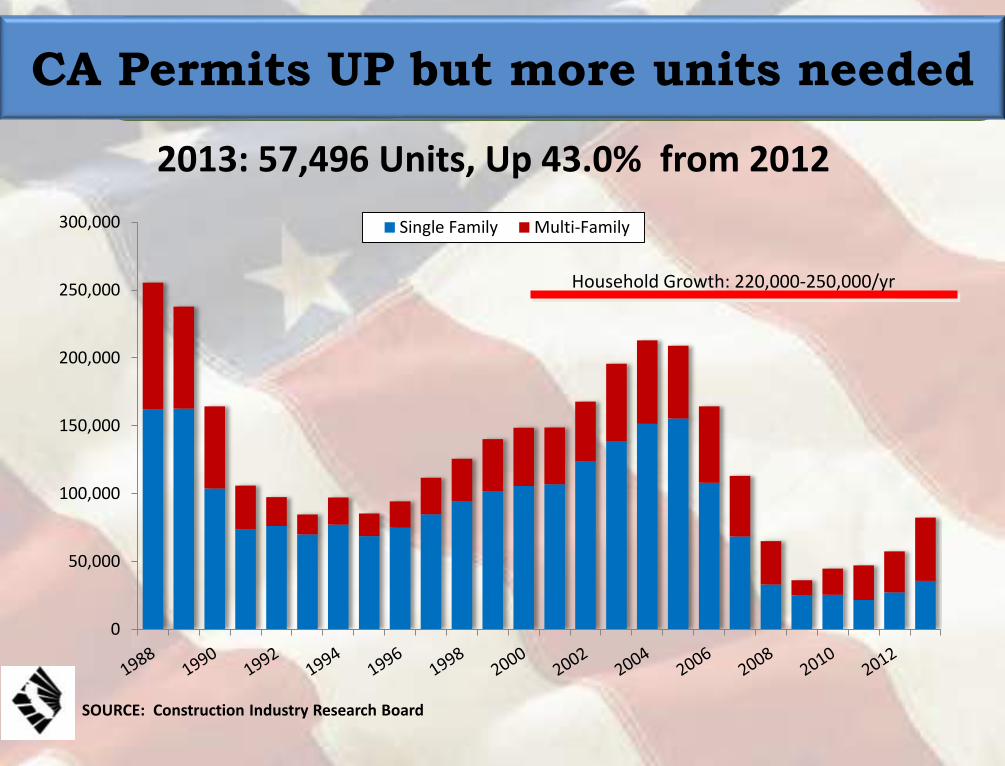
300,000 Single Family Multi-Family
CA Permits UP but more units needed
2013: 57,496 Units, Up 43.0% from 2012
Household Growth: 220,000-250,000/yr
SOURCE: Construction Industry Research Board
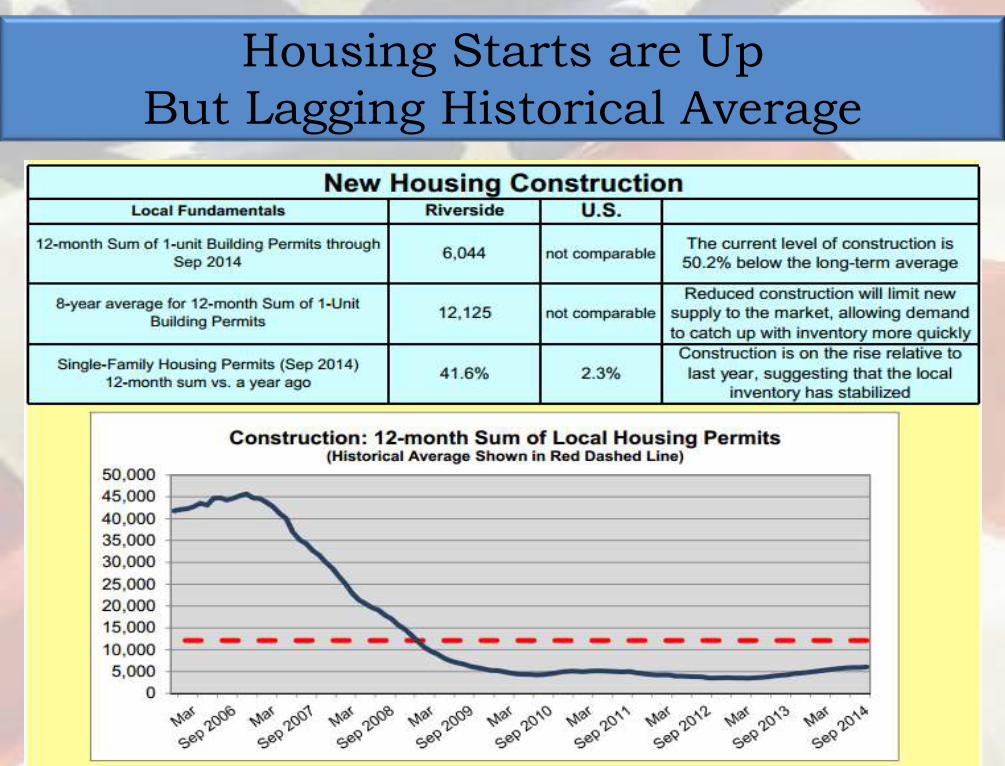
Housing Starts are Up
But Lagging Historical Average
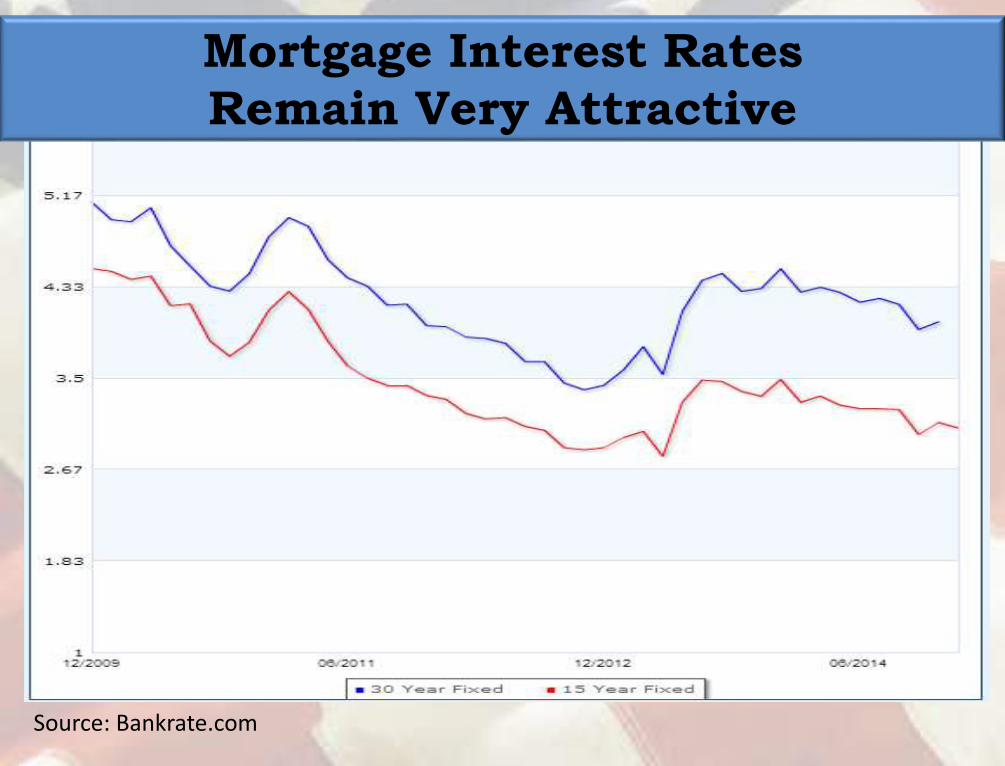
Source: Bankrate.com
Mortgage Interest Rates
Remain Very Attractive

Unemployment Declines
Job Growth Continues
Source: Bureau of Labor Statistics
Riverside County
15.2
8.2
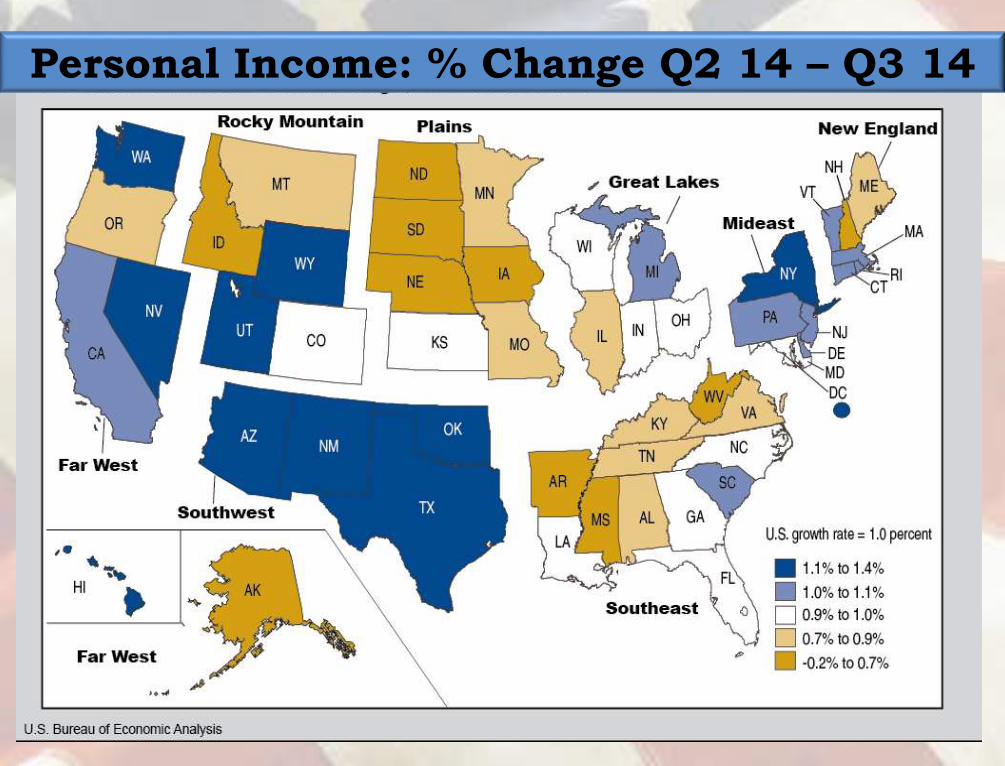
Personal Income: % Change Q2 14 – Q3 14
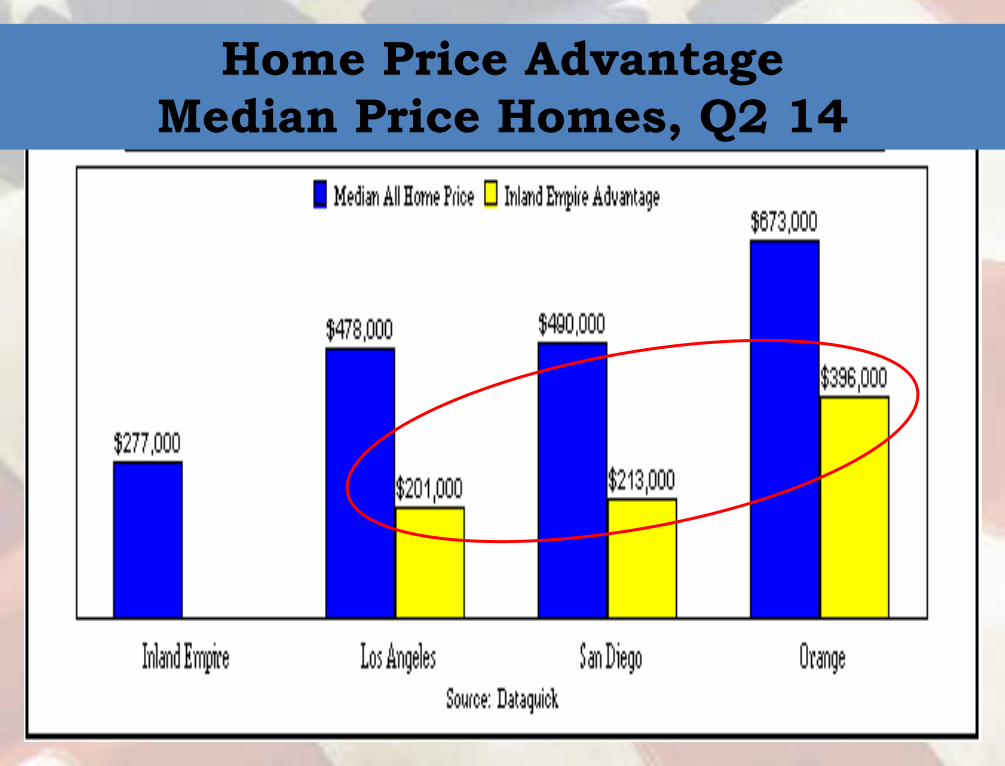
Home Price Advantage
Median Price Homes, Q2 14
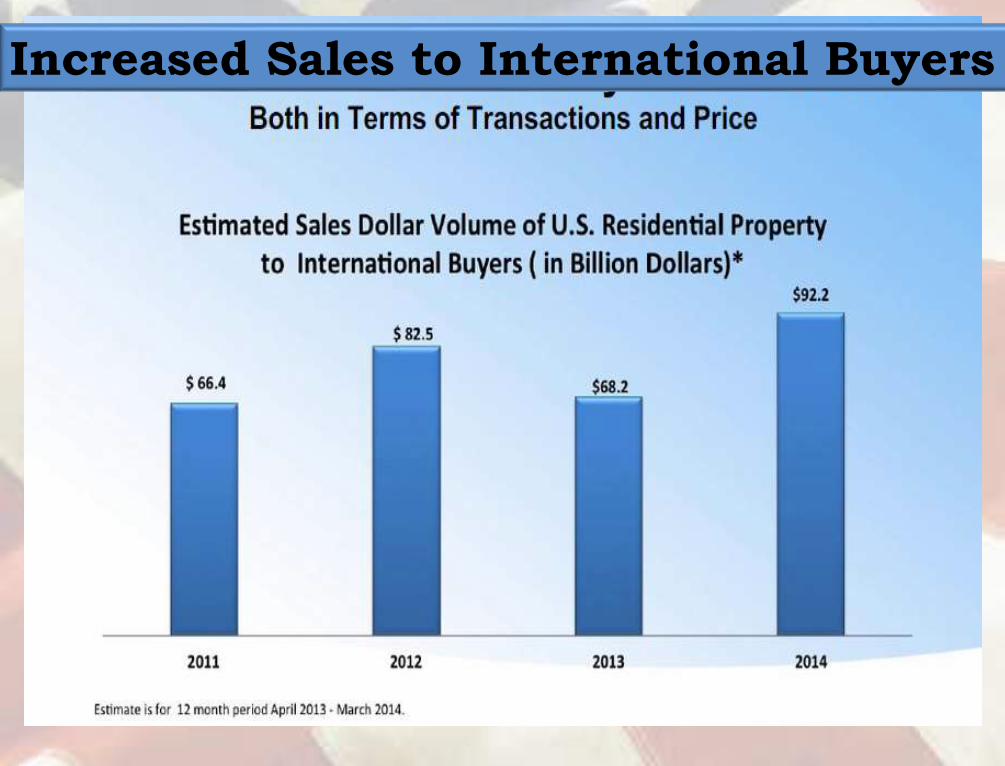
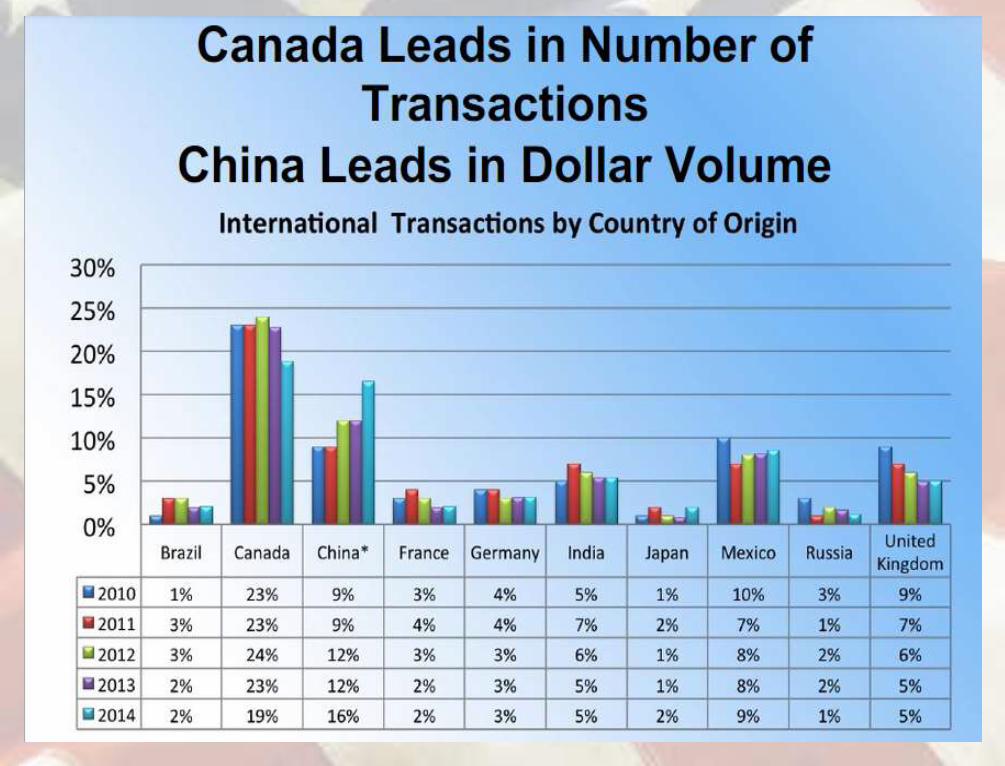
Increased Sales to International Buyers

Benefit of Ownership
Total Equity Appreciation

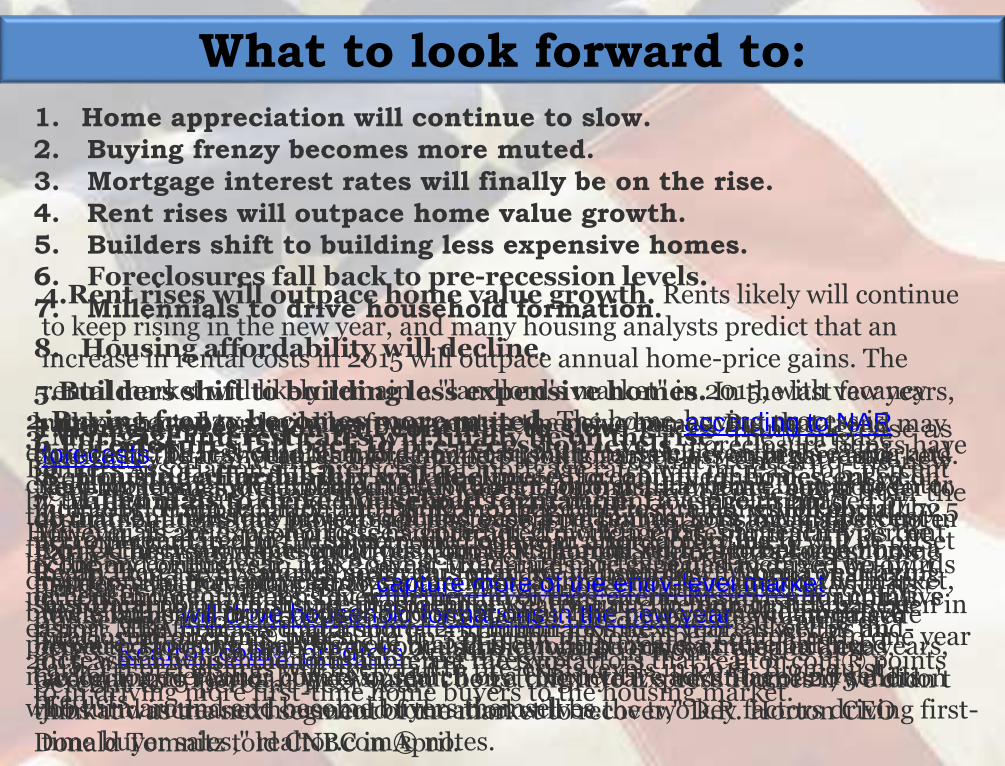
What to look forward to:
3. Mortgage interest rates will finally be on the rise.
5. Builders shift to building less expensive homes.
6. Foreclosures fall back to pre-recession levels.
1.Home appreciation will continue to slow. Prices didn't increase as
fast this year, and they are expected to stick to that trend into the new
year. "Easing housing inventory levels and the exit of investors from the
market are helping to put the brakes on home-price escalation,"
Forbes.com reports. "At a deeper level, this change represents a
fundamental shift in the market: We've moved out of rapid recovery
phase and into a new normal." Gone are the double-digit gains of
2013. Realtor.com® predicts an annual gain in home prices of 4
percent to 5 percent next year.
2.Buying frenzy becomes more muted. The home-buying process is expected to be less chaotic in the new year, with for-sale inventories easing and credit loosening, which could make it easier for first-time home buyers to enter the market. Investors have also pulled back in many markets. NAR statistics from October show that individual investors purchased 15 percent of homes, a drop from 19 percent year-over-year. Also, as more homes come on the market, buyers will have more choices and sellers may face more of the competitive pressure. Housing analysts note that this can help create a more balanced market for everyone: buyers in search of a competitive advantage and sellers who turn around and become buyers themselves.
3.Mortgage interest rates will finally be on the rise. The Mortgage Bankers Association still predicts that mortgage rates will increase to 5 percent by the end of 2015. Freddie Mac expects a 4.5 percent average in 2015. However, in 2013, economists had predicted mortgage rates to reach 5 percent by the end of this year. The 30-year fixed-rate mortgage has averaged below 4 percent in recent weeks. But with the end of the Federal Reserve's quantitative easing, MBA believes that a short-term fund rate hike is more likely by mid-2015, which would then push interest rates up.
4.Rent rises will outpace home value growth. Rents likely will continue to keep rising in the new year, and many housing analysts predict that an increase in rental costs in 2015 will outpace annual home-price gains. The rental market will likely remain a "landlord's market" in 2015, with vacancy rates expected to stay below 5 percent in the new year, according to NAR
forecasts. That should lead to demand pushing rents up even higher and keeping them above inflation, NAR Chief Economist Lawrence Yun notes. Apartment rents are projected to increase 4 percent in 2014 and 4.1 percent in 2015. The rise in rents could push more Millennial renters to become home owners. Realtor.com® analysts predict that households headed by Millennials will drive household formations in the new year. Millennials are expected to drive two-thirds of household formations over the next five years, according to realtor.com®'s predictions. "Next year's addition of 2.75 million jobs and increased household formation will be the two key factors driving first-time buyer sales," realtor.com® notes.
5.Builders shift to building less expensive homes. In the last few years, builders have been building fewer, more expensive homes. But that trend may change in the new year, as more builders look to target less-expensive markets. New-home sales are expected to top the 500,000 mark in 2015, but in order to do that, builders may have to sell less expensive homes, housing analysts note. Earlier this year, representatives from D.R. Horton, the nation's largest home builder, said they planned to capture more of the entry-level market with its newly launched brand called Express Homes. The properties will be priced between $120,000 and $150,000, and they will be concentrated in Texas, Georgia, and Florida. "We wouldn't be getting into Express Homes if we didn't think it was the next segment of the market to recover," D.R. Horton CEO Donald Tomnitz told CNBC in April.
6.Foreclosures fall back to pre-recession levels. Foreclosure filings have been on the decline this year and are expected to continue their descent well into 2015. From January through November, foreclosure filings fell about 172 percent compared to the same period one year prior, according to RealtyTrac. "Every month so far this year, we've been down from a year ago," says Daren Blomquist, vice president of RealtyTrac. The only uptick has been in foreclosure auctions, which are up 5 percent in November compared to one year earlier. Foreclosures will likely fall to pre-crisis levels in 2015, Blomquistpredicts.
7. Millennials to drive household formation. Households headed by Millennials are expected to see significant growth in 2015, particularly as the economy continues to make gains. Millennials are expected to drive two-thirds of household formations over the next five years, according to realtor.com®'sreport. The forecasted addition of 2.5 million jobs next year, as well as an increase in household formation, are the two factors that realtor.com® points to in driving more first-time home buyers to the housing market.
1. Home appreciation will continue to slow.
2. Buying frenzy becomes more muted.
4. Rent rises will outpace home value growth.
7. Millennials to drive household formation.
8. Housing affordability will decline.
8. Housing affordability will decline. Affordability for homes, based on home-price appreciation and rising mortgage interest rates, will likely fall by 5 to 10 percent in 2015. However, the decline in affordability likely will be offset by an increase in salaries next year for many households. "When considering historical norms, housing affordability will continue to remain strong next year," realtor.com® notes.
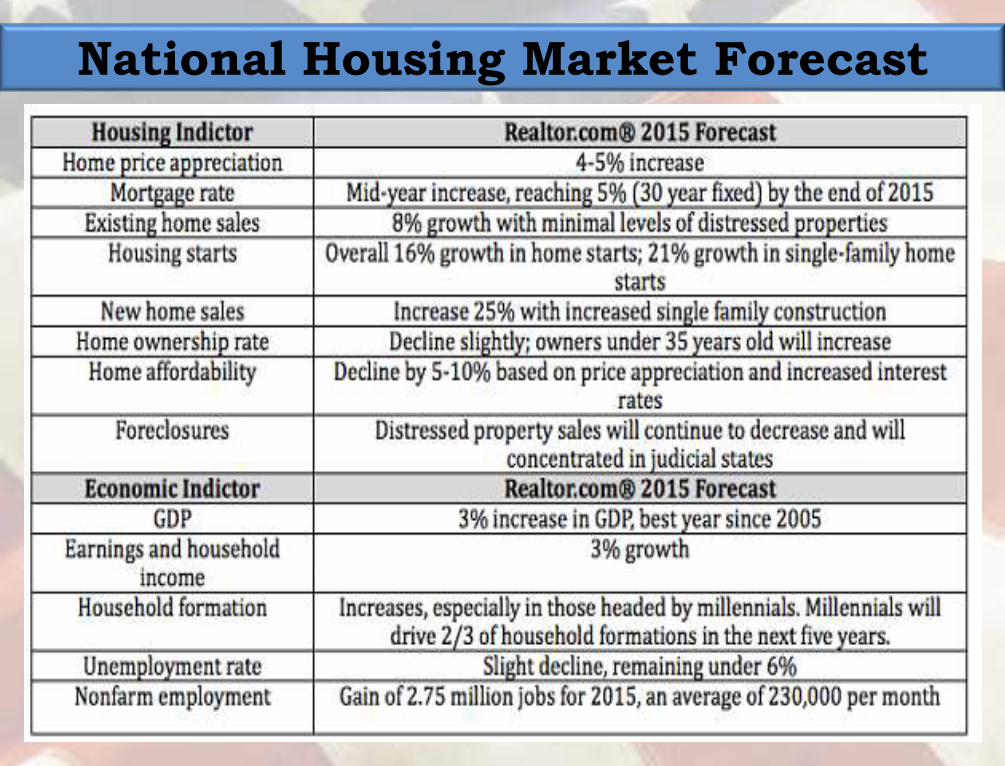
National Housing Market Forecast
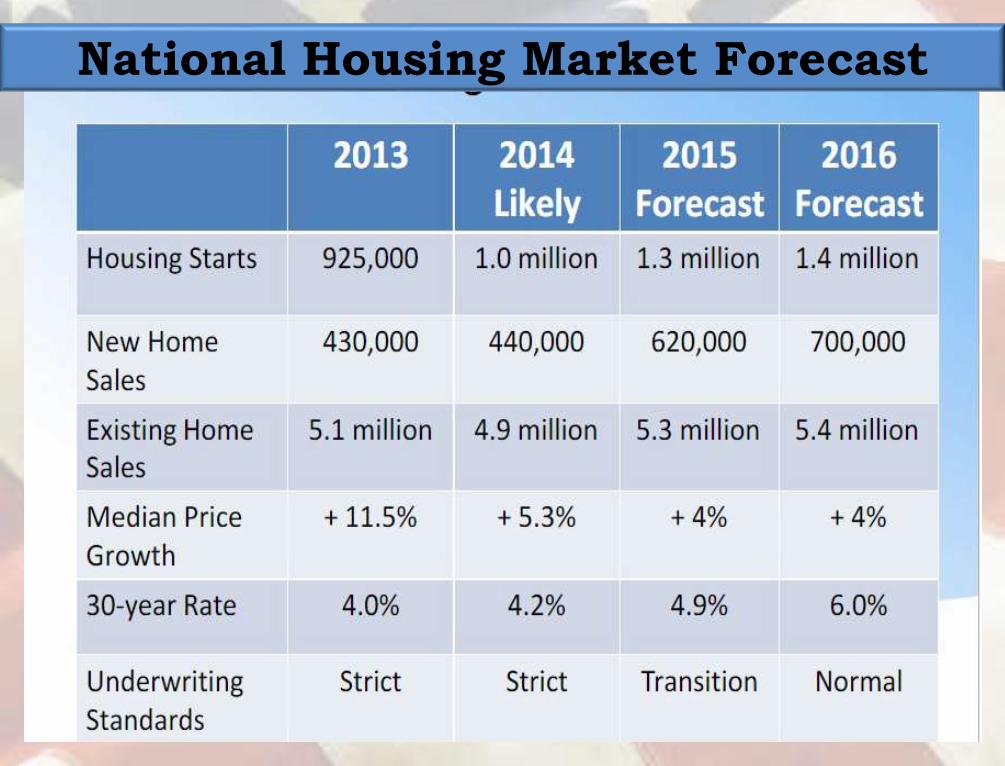
National Housing Market Forecast
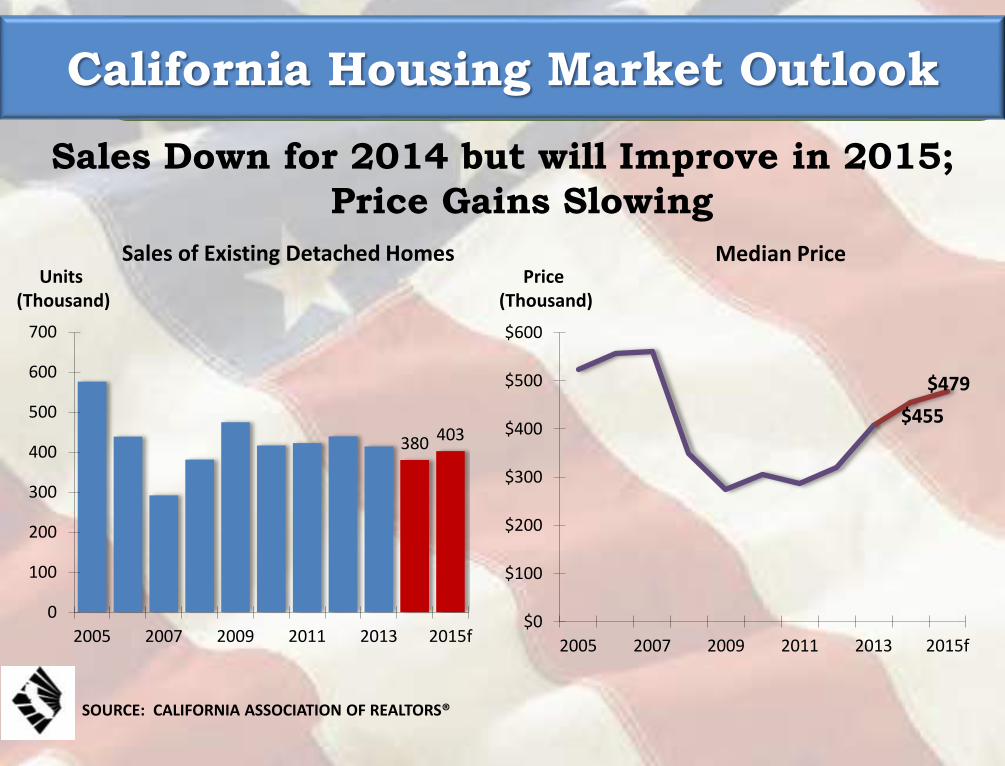
California Housing Market Outlook
Sales Down for 2014 but will Improve in 2015;
Price Gains Slowing
Units (Thousand)
380 403
0
100
200
300
400
500
600
700
2005 2007 2009 2011 2013 2015f
Tho
usa
nd
s
Sales of Existing Detached Homes
$455
$479
$0
$100
$200
$300
$400
$500
$600
2005 2007 2009 2011 2013 2015f
Tho
usa
nd
s
Median PricePrice
(Thousand)
SOURCE: CALIFORNIA ASSOCIATION OF REALTORS®

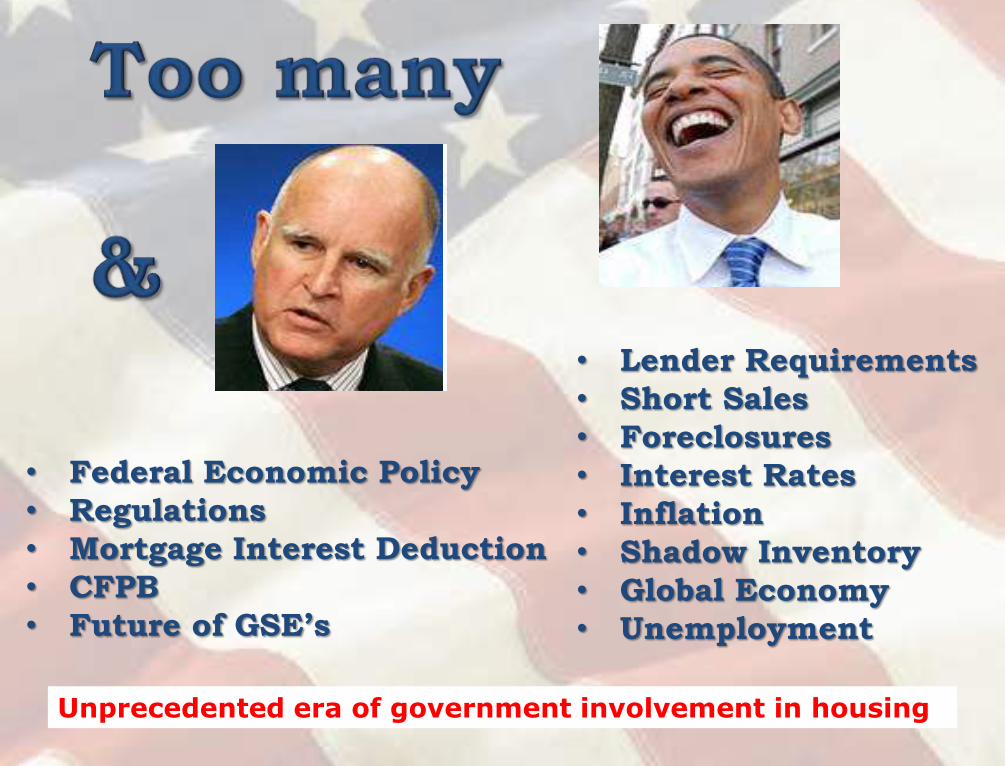
• Federal Economic Policy
• Regulations
• Mortgage Interest Deduction
• CFPB
• Future of GSE’s
• Lender Requirements
• Short Sales
• Foreclosures
• Interest Rates
• Inflation
• Shadow Inventory
• Global Economy
• Unemployment
Unprecedented era of government involvement in housing

Sovereign
Debt
Crisis in
EuroZone
Oil Price Spikes
Arab Spring
Political
Change
on
Capitol
Hill
Debt Limit
Ceiling &
Downgrade
of US Debt
Stock
Market
Volatility


The Realtor® HomeWashington D.C.
The National Association of REALTORS®, “The Voice for
Real Estate,” is America’s largest trade association.

Thanks to…