1 1 slide © 2006 thomson/south-western chapter 8 interval estimation population mean: known...
TRANSCRIPT

1 1 Slide
Slide
© 2006 Thomson/South-Western© 2006 Thomson/South-Western
Chapter 8Chapter 8Interval EstimationInterval Estimation
Population Mean: Population Mean: Known Known Population Mean: Population Mean: Unknown Unknown Determining the Sample SizeDetermining the Sample Size Population ProportionPopulation Proportion

2 2 Slide
Slide
© 2006 Thomson/South-Western© 2006 Thomson/South-Western
The general form of an interval estimate of aThe general form of an interval estimate of a population mean ispopulation mean is
The general form of an interval estimate of aThe general form of an interval estimate of a population mean ispopulation mean is
Margin of Errorx Margin of Errorx
Margin of Error and the Interval EstimateMargin of Error and the Interval Estimate

3 3 Slide
Slide
© 2006 Thomson/South-Western© 2006 Thomson/South-Western
/2/2 /2/21 - of all values1 - of all valuesxx
Sampling distribution of
Sampling distribution of xx
xx
z x /2z x /2z x /2z x /2
[------------------------- -------------------------][------------------------- -------------------------]
[------------------------- -------------------------][------------------------- -------------------------]
[------------------------- -------------------------][------------------------- -------------------------]
xxxx
xx
intervalintervaldoes notdoes notinclude include
intervalintervalincludes includes
intervalintervalincludes includes
Interval Estimate of a Population Mean:Interval Estimate of a Population Mean: Known Known

4 4 Slide
Slide
© 2006 Thomson/South-Western© 2006 Thomson/South-Western
Interval Estimate ofInterval Estimate of
Interval Estimate of a Population Mean:Interval Estimate of a Population Mean: Known Known
x zn
/2x zn
/2
where: is the sample meanwhere: is the sample mean 1 -1 - is the confidence coefficient is the confidence coefficient zz/2 /2 is the is the zz value providing an area of value providing an area of /2 in the upper tail of the standard /2 in the upper tail of the standard
normal probability distributionnormal probability distribution is the population standard deviationis the population standard deviation nn is the sample size is the sample size
xx

5 5 Slide
Slide
© 2006 Thomson/South-Western© 2006 Thomson/South-Western
Interval Estimate of a Population Mean:Interval Estimate of a Population Mean: Known Known
Adequate Sample SizeAdequate Sample Size
In most applications, a sample size of In most applications, a sample size of nn = 30 is = 30 is adequate.adequate. In most applications, a sample size of In most applications, a sample size of nn = 30 is = 30 is adequate.adequate.
If the population distribution is highly skewed orIf the population distribution is highly skewed or contains outliers, a sample size of 50 or more iscontains outliers, a sample size of 50 or more is recommended.recommended.
If the population distribution is highly skewed orIf the population distribution is highly skewed or contains outliers, a sample size of 50 or more iscontains outliers, a sample size of 50 or more is recommended.recommended.

6 6 Slide
Slide
© 2006 Thomson/South-Western© 2006 Thomson/South-Western
SSDD
Interval Estimate of Population Mean:Interval Estimate of Population Mean: Known Known
Example: Discount SoundsExample: Discount SoundsDiscount Sounds has 260 retail outlets Discount Sounds has 260 retail outlets
throughout the United States. The firmthroughout the United States. The firmis evaluating a potential location for ais evaluating a potential location for anew outlet, based in part, on the meannew outlet, based in part, on the meanannual income of the individuals inannual income of the individuals inthe marketing area of the new location.the marketing area of the new location.
A sample of size A sample of size nn = 36 was taken; = 36 was taken;the sample mean income is $31,100. Thethe sample mean income is $31,100. Thepopulation is not believed to be highly skewed. The population is not believed to be highly skewed. The population standard deviation is estimated to be $4,500,population standard deviation is estimated to be $4,500,and the confidence coefficient to be used in the interval and the confidence coefficient to be used in the interval estimate is .95.estimate is .95.

7 7 Slide
Slide
© 2006 Thomson/South-Western© 2006 Thomson/South-Western
95% of the sample means that can be observed95% of the sample means that can be observed
are within are within ++ 1.96 of the population mean 1.96 of the population mean . . x xThe margin of error is: The margin of error is:
/ 2
4,5001.96 1,470
36z
n
/ 2
4,5001.96 1,470
36z
n
Thus, at 95% confidence, the margin of errorThus, at 95% confidence, the margin of error is $1,470. is $1,470.
SSDD
Interval Estimate of Population Mean:Interval Estimate of Population Mean: Known Known

8 8 Slide
Slide
© 2006 Thomson/South-Western© 2006 Thomson/South-Western
Interval estimate of Interval estimate of is: is:
Interval Estimate of Population Mean:Interval Estimate of Population Mean: Known Known
SSDD
We are We are 95% confident95% confident that the interval contains the that the interval contains the
population mean.population mean.
$31,100 $31,100 ++ $1,470 $1,470oror
$29,630 to $32,570$29,630 to $32,570

9 9 Slide
Slide
© 2006 Thomson/South-Western© 2006 Thomson/South-Western
Interval Estimation of a Population Mean:Interval Estimation of a Population Mean: Unknown Unknown
If an estimate of the population standard deviation If an estimate of the population standard deviation cannot be developed prior to sampling, we use cannot be developed prior to sampling, we use the sample standard deviation the sample standard deviation ss to estimate to estimate . .
This is the This is the unknown unknown case. case. In this case, the interval estimate for In this case, the interval estimate for is based is based
on the on the tt distribution. distribution. (We’ll assume for now that the population is (We’ll assume for now that the population is
normally distributed.)normally distributed.)
10 10 Slide
Slide
© 2006 Thomson/South-Western© 2006 Thomson/South-Western
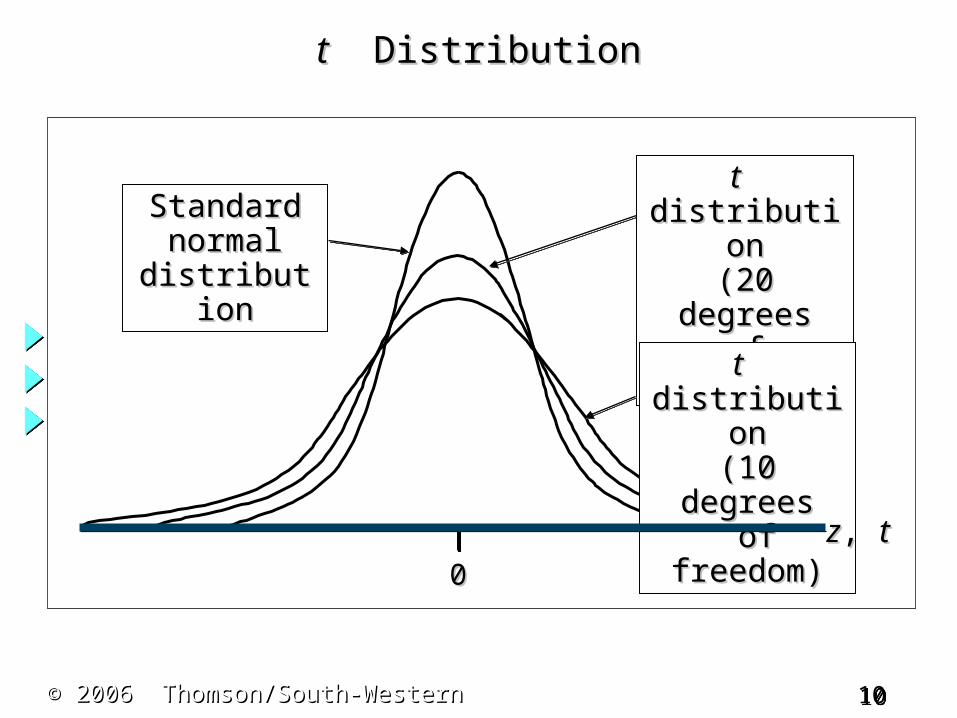
tt Distribution Distribution
StandardStandardnormalnormal
distributiondistribution
tt distributiondistribution(20 degrees(20 degreesof freedom)of freedom)
tt distributiondistribution(10 degrees(10 degrees
of of freedom)freedom)
00zz, , tt

11 11 Slide
Slide
© 2006 Thomson/South-Western© 2006 Thomson/South-Western
tt Distribution Distribution
Degrees Area in Upper Tail
of Freedom .20 .10 .05 .025 .01 .005
. . . . . . .
50 .849 1.299 1.676 2.009 2.403 2.678
60 .848 1.296 1.671 2.000 2.390 2.660
80 .846 1.292 1.664 1.990 2.374 2.639
100 .845 1.290 1.660 1.984 2.364 2.626
.842 1.282 1.645 1.960 2.326 2.576
Degrees Area in Upper Tail
of Freedom .20 .10 .05 .025 .01 .005
. . . . . . .
50 .849 1.299 1.676 2.009 2.403 2.678
60 .848 1.296 1.671 2.000 2.390 2.660
80 .846 1.292 1.664 1.990 2.374 2.639
100 .845 1.290 1.660 1.984 2.364 2.626
.842 1.282 1.645 1.960 2.326 2.576
Standard Standard normalnormalzz values values
12 12 Slide
Slide
© 2006 Thomson/South-Western© 2006 Thomson/South-Western
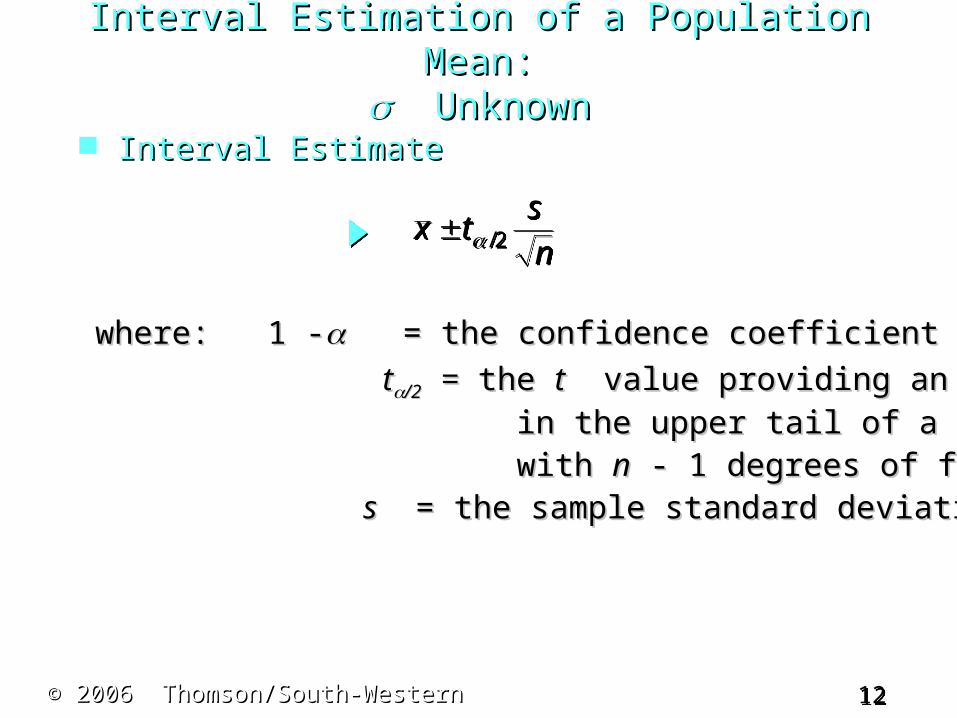
Interval EstimateInterval Estimate
x tsn
/2x tsn
/2
where: 1 -where: 1 - = the confidence coefficient = the confidence coefficient
tt/2 /2 == the the tt value providing an area of value providing an area of /2/2 in the upper tail of a in the upper tail of a t t distribution distribution with with nn - 1 degrees of freedom - 1 degrees of freedom ss = the sample standard deviation = the sample standard deviation
Interval Estimation of a Population Mean:Interval Estimation of a Population Mean: Unknown Unknown

13 13 Slide
Slide
© 2006 Thomson/South-Western© 2006 Thomson/South-Western
A reporter for a student newspaper is A reporter for a student newspaper is writing anwriting anarticle on the cost of off-campusarticle on the cost of off-campushousing. A sample of 16housing. A sample of 16efficiency apartments within aefficiency apartments within ahalf-mile of campus resulted inhalf-mile of campus resulted ina sample mean of $650 per month and a samplea sample mean of $650 per month and a samplestandard deviation of $55.standard deviation of $55.
Interval Estimation of a Population Mean:Interval Estimation of a Population Mean: Unknown Unknown
Example: Apartment RentsExample: Apartment Rents

14 14 Slide
Slide
© 2006 Thomson/South-Western© 2006 Thomson/South-Western
Let us provide a 95% confidence interval Let us provide a 95% confidence interval estimate of the mean rent perestimate of the mean rent permonth for the population of month for the population of efficiency apartments within aefficiency apartments within ahalf-mile of campus. We willhalf-mile of campus. We willassume this population to be normally assume this population to be normally distributed.distributed.
Interval Estimation of a Population Mean:Interval Estimation of a Population Mean: Unknown Unknown
Example: Apartment RentsExample: Apartment Rents

15 15 Slide
Slide
© 2006 Thomson/South-Western© 2006 Thomson/South-Western
At 95% confidence, At 95% confidence, = .05, and = .05, and /2 = .025./2 = .025.
Degrees Area in Upper Tail
of Freedom .20 .100 .050 .025 .010 .005
15 .866 1.341 1.753 2.131 2.602 2.947
16 .865 1.337 1.746 2.120 2.583 2.921
17 .863 1.333 1.740 2.110 2.567 2.898
18 .862 1.330 1.734 2.101 2.520 2.878
19 .861 1.328 1.729 2.093 2.539 2.861
. . . . . . .
Degrees Area in Upper Tail
of Freedom .20 .100 .050 .025 .010 .005
15 .866 1.341 1.753 2.131 2.602 2.947
16 .865 1.337 1.746 2.120 2.583 2.921
17 .863 1.333 1.740 2.110 2.567 2.898
18 .862 1.330 1.734 2.101 2.520 2.878
19 .861 1.328 1.729 2.093 2.539 2.861
. . . . . . .
In the In the tt distribution table we see that distribution table we see that tt.025.025 = 2.131. = 2.131.tt.025.025 is based on is based on nn 1 = 16 1 = 16 1 = 15 degrees of freedom. 1 = 15 degrees of freedom.
Interval Estimation of a Population Mean:Interval Estimation of a Population Mean: Unknown Unknown

16 16 Slide
Slide
© 2006 Thomson/South-Western© 2006 Thomson/South-Western
x tsn
.025x tsn
.025
We are 95% confident that the mean rent per monthWe are 95% confident that the mean rent per monthfor the population of efficiency apartments within afor the population of efficiency apartments within ahalf-mile of campus is between $620.70 and $679.30.half-mile of campus is between $620.70 and $679.30.
Interval EstimateInterval Estimate
Interval Estimation of a Population Mean:Interval Estimation of a Population Mean: Unknown Unknown
55650 2.131 650 29.30
16
55650 2.131 650 29.30
16

17 17 Slide
Slide
© 2006 Thomson/South-Western© 2006 Thomson/South-Western
Summary of Interval Estimation Summary of Interval Estimation ProceduresProcedures
for a Population Meanfor a Population Mean
Can theCan thepopulation standardpopulation standard
deviation deviation be assumed be assumed known ?known ?
Use the sampleUse the samplestandard deviationstandard deviation
ss to estimate to estimate
UseUse
YesYes NoNo
/ 2
sx t
n / 2
sx t
nUseUse
/ 2x zn
/ 2x z
n
KnownKnownCaseCase
UnknownUnknownCaseCase

18 18 Slide
Slide
© 2006 Thomson/South-Western© 2006 Thomson/South-Western
Let Let EE = the desired margin of error. = the desired margin of error. Let Let EE = the desired margin of error. = the desired margin of error.
EE is the amount added to and subtracted from the is the amount added to and subtracted from the point estimate to obtain an interval estimate.point estimate to obtain an interval estimate. EE is the amount added to and subtracted from the is the amount added to and subtracted from the point estimate to obtain an interval estimate.point estimate to obtain an interval estimate.
Sample Size for an Interval EstimateSample Size for an Interval Estimateof a Population Meanof a Population Mean

19 19 Slide
Slide
© 2006 Thomson/South-Western© 2006 Thomson/South-Western
Sample Size for an Interval EstimateSample Size for an Interval Estimateof a Population Meanof a Population Mean
E zn
/2E zn
/2
nz
E
( )/ 22 2
2n
z
E
( )/ 22 2
2
Margin of ErrorMargin of Error
Necessary Sample SizeNecessary Sample Size
20 20 Slide
Slide
© 2006 Thomson/South-Western© 2006 Thomson/South-Western
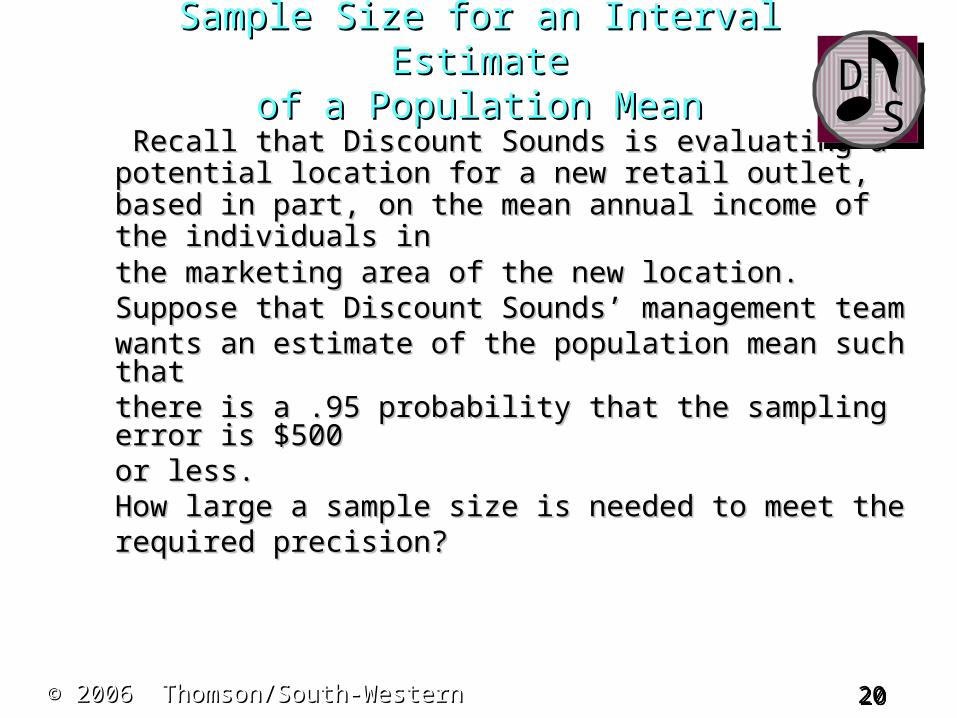
Recall that Discount Sounds is evaluating a Recall that Discount Sounds is evaluating a potential location for a new retail outlet, based in potential location for a new retail outlet, based in part, on the mean annual income of the individuals part, on the mean annual income of the individuals ininthe marketing area of the new location.the marketing area of the new location.
Suppose that Discount Sounds’ management Suppose that Discount Sounds’ management teamteamwants an estimate of the population mean such thatwants an estimate of the population mean such thatthere is a .95 probability that the sampling error is there is a .95 probability that the sampling error is $500$500or less.or less.
How large a sample size is needed to meet How large a sample size is needed to meet thetherequired precision?required precision?
SSDD
Sample Size for an Interval EstimateSample Size for an Interval Estimateof a Population Meanof a Population Mean

21 21 Slide
Slide
© 2006 Thomson/South-Western© 2006 Thomson/South-Western
At 95% confidence, At 95% confidence, zz.025.025 = 1.96. Recall that = 1.96. Recall that = 4,500.= 4,500.
zn
/2 500zn
/2 500
2 2
2
(1.96) (4,500)311.17 312
(500)n
2 2
2
(1.96) (4,500)311.17 312
(500)n
Sample Size for an Interval EstimateSample Size for an Interval Estimateof a Population Meanof a Population Mean
SSDD
A sample of size 312 is needed to reach a desiredA sample of size 312 is needed to reach a desired
precision of precision of ++ $500 at 95% confidence. $500 at 95% confidence.

22 22 Slide
Slide
© 2006 Thomson/South-Western© 2006 Thomson/South-Western
The general form of an interval estimate of aThe general form of an interval estimate of a population proportion ispopulation proportion is
The general form of an interval estimate of aThe general form of an interval estimate of a population proportion ispopulation proportion is
Margin of Errorp Margin of Errorp
Interval EstimationInterval Estimationof a Population Proportionof a Population Proportion

23 23 Slide
Slide
© 2006 Thomson/South-Western© 2006 Thomson/South-Western
Interval EstimationInterval Estimationof a Population Proportionof a Population Proportion
The sampling distribution of plays a key role inThe sampling distribution of plays a key role in computing the margin of error for this intervalcomputing the margin of error for this interval estimate.estimate.
The sampling distribution of plays a key role inThe sampling distribution of plays a key role in computing the margin of error for this intervalcomputing the margin of error for this interval estimate.estimate.
pp
The sampling distribution ofThe sampling distribution of can be approximated can be approximated by a normal distribution whenever by a normal distribution whenever npnp >> 5 and 5 and nn(1 – (1 – pp) ) >> 5. 5.
The sampling distribution ofThe sampling distribution of can be approximated can be approximated by a normal distribution whenever by a normal distribution whenever npnp >> 5 and 5 and nn(1 – (1 – pp) ) >> 5. 5.
pp

24 24 Slide
Slide
© 2006 Thomson/South-Western© 2006 Thomson/South-Western
/2/2 /2/2
Interval EstimationInterval Estimationof a Population Proportionof a Population Proportion
Normal Approximation of Sampling Distribution Normal Approximation of Sampling Distribution of of
pp
Samplingdistribution of
Samplingdistribution of pp
(1 )p
p p
n
(1 )p
p p
n
pppp
/ 2 pz / 2 pz / 2 pz / 2 pz
1 - of all values1 - of all valuespp

25 25 Slide
Slide
© 2006 Thomson/South-Western© 2006 Thomson/South-Western
Interval EstimateInterval Estimate
Interval EstimationInterval Estimationof a Population Proportionof a Population Proportion
p zp pn
/
( )2
1p z
p pn
/
( )2
1
where: 1 -where: 1 - is the confidence coefficient is the confidence coefficient
zz/2 /2 is the is the zz value providing an area of value providing an area of
/2 in the upper tail of the standard/2 in the upper tail of the standard
normal probability distributionnormal probability distribution
is the sample proportionis the sample proportionpp

26 26 Slide
Slide
© 2006 Thomson/South-Western© 2006 Thomson/South-Western
Political Science, Inc. (PSI)Political Science, Inc. (PSI)specializes in voter polls andspecializes in voter polls andsurveys designed to keepsurveys designed to keeppolitical office seekers informedpolitical office seekers informedof their position in a race. of their position in a race.
Using telephone surveys, PSI interviewers Using telephone surveys, PSI interviewers askaskregistered voters who they would vote for if theregistered voters who they would vote for if theelection were held that day. election were held that day.
Interval EstimationInterval Estimationof a Population Proportionof a Population Proportion
Example: Political Science, Inc.Example: Political Science, Inc.

27 27 Slide
Slide
© 2006 Thomson/South-Western© 2006 Thomson/South-Western
In a current election campaign, In a current election campaign, PSI has just found that 220PSI has just found that 220registered voters, out of 500registered voters, out of 500contacted, favor a particularcontacted, favor a particular
candidate.candidate.PSI wants to develop a 95% confidence PSI wants to develop a 95% confidence
interval interval estimate for the proportion of the population ofestimate for the proportion of the population ofregistered voters that favor the candidate.registered voters that favor the candidate.
Interval EstimationInterval Estimationof a Population Proportionof a Population Proportion
Example: Political Science, Inc.Example: Political Science, Inc.

28 28 Slide
Slide
© 2006 Thomson/South-Western© 2006 Thomson/South-Western
p zp pn
/
( )2
1p z
p pn
/
( )2
1
where: where: nn = 500, = 220/500 = .44, = 500, = 220/500 = .44, zz/2 /2 = = 1.961.96pp
Interval EstimationInterval Estimationof a Population Proportionof a Population Proportion
PSI is 95% confident that the proportion of all votersPSI is 95% confident that the proportion of all voters
that favor the candidate is between .3965 and .4835.that favor the candidate is between .3965 and .4835.
.44(1 .44).44 1.96
500
.44(1 .44)
.44 1.96500
= .44 + .0435= .44 + .0435

29 29 Slide
Slide
© 2006 Thomson/South-Western© 2006 Thomson/South-Western
Solving for the necessary sample size, we Solving for the necessary sample size, we getget
Margin of ErrorMargin of Error
Sample Size for an Interval EstimateSample Size for an Interval Estimateof a Population Proportionof a Population Proportion
/ 2
(1 )p pE z
n
/ 2
(1 )p pE z
n
2/ 2
2
( ) (1 )z p pn
E
2
/ 22
( ) (1 )z p pn
E
However, will not be known until after we However, will not be known until after we have selected the sample. We will use the have selected the sample. We will use the planning valueplanning value
pp** for . for .
pp
pp

30 30 Slide
Slide
© 2006 Thomson/South-Western© 2006 Thomson/South-Western
Sample Size for an Interval EstimateSample Size for an Interval Estimateof a Population Proportionof a Population Proportion
The planning value The planning value pp** can be chosen by: can be chosen by:
1. Using the sample proportion from a 1. Using the sample proportion from a previous sample of the same or similar previous sample of the same or similar units, orunits, or
2. Selecting a preliminary sample and 2. Selecting a preliminary sample and using the sample proportion from this using the sample proportion from this sample.sample.
2 * */ 2
2
( ) (1 )z p pn
E
2 * *
/ 22
( ) (1 )z p pn
E
Necessary Sample SizeNecessary Sample Size

31 31 Slide
Slide
© 2006 Thomson/South-Western© 2006 Thomson/South-Western
Suppose that PSI would like a .99 probabilitySuppose that PSI would like a .99 probabilitythat the sample proportion is within + .03 of the that the sample proportion is within + .03 of the population proportion.population proportion.
How large a sample size is needed to meet the How large a sample size is needed to meet the required precision? (A previous sample of similar required precision? (A previous sample of similar units yielded .44 for the sample proportion.)units yielded .44 for the sample proportion.)
Sample Size for an Interval EstimateSample Size for an Interval Estimateof a Population Proportionof a Population Proportion

32 32 Slide
Slide
© 2006 Thomson/South-Western© 2006 Thomson/South-Western
At 99% confidence, At 99% confidence, zz.005.005 = 2.576. Recall that = 2.576. Recall that = .44.= .44.
pp
A sample of size 1817 is needed to reach a desiredA sample of size 1817 is needed to reach a desired
precision of precision of ++ .03 at 99% confidence. .03 at 99% confidence.
2 2/ 2
2 2
( ) (1 ) (2.576) (.44)(.56) 1817
(.03)
z p pn
E
2 2
/ 2
2 2
( ) (1 ) (2.576) (.44)(.56) 1817
(.03)
z p pn
E
Sample Size for an Interval EstimateSample Size for an Interval Estimateof a Population Proportionof a Population Proportion
/ 2
(1 ).03
p pz
n
/ 2
(1 ).03
p pz
n

33 33 Slide
Slide
© 2006 Thomson/South-Western© 2006 Thomson/South-Western
Note:Note: We used .44 as the best estimate of We used .44 as the best estimate of pp in in thethepreceding expression. If no information is preceding expression. If no information is availableavailableabout about pp, then .5 is often assumed because it , then .5 is often assumed because it providesprovidesthe highest possible sample size. If we had the highest possible sample size. If we had usedusedpp = .5, the recommended = .5, the recommended nn would have been would have been 1843.1843.
Sample Size for an Interval EstimateSample Size for an Interval Estimateof a Population Proportionof a Population Proportion