1 1 global ecology. 2 2 outline atmospheric envelope greenhouse effect el nino effects tropical...
TRANSCRIPT

11
Global Ecology
22
Outline Atmospheric Envelope Greenhouse Effect El Nino
Effects Tropical Deforestation Human Influence on Atmospheric Composition Depletion and Recovery of the Ozone Layer

33
Atmospheric Envelope
Clean, dry air at the earth’s surface is approx: 78.08 % Nitrogen 20.94 % Oxygen 0.93 % Argon .003 % Carbon Dioxide .00005 % Ozone
Water vapor and trace elemental gases (Ne, Methane)

44
Atmospheric Envelope
Troposphere- earth surface to 9-16 km Stratosphere- from troposphere to 50 km
Atmosphere modifies earth’s environment i.e ozone in Atm. reduces amount of UV light Also helps keep the earth surface warm- greenhouse
effect
55
Greenhouse Effect
Heat is trapped near the earth’s surface by greenhouse gases: (Water Vapor, Carbon Dioxide, Methane, Ozone,
Nitrous Oxide, and CFC’s) Absorb infrared and reemit most back to
earth. 30 % Solar energy reflected back by clouds,
particulate matter, etc. 70 % Absorbed by atmosphere/surface.

66Greenhouse Effect

77

88
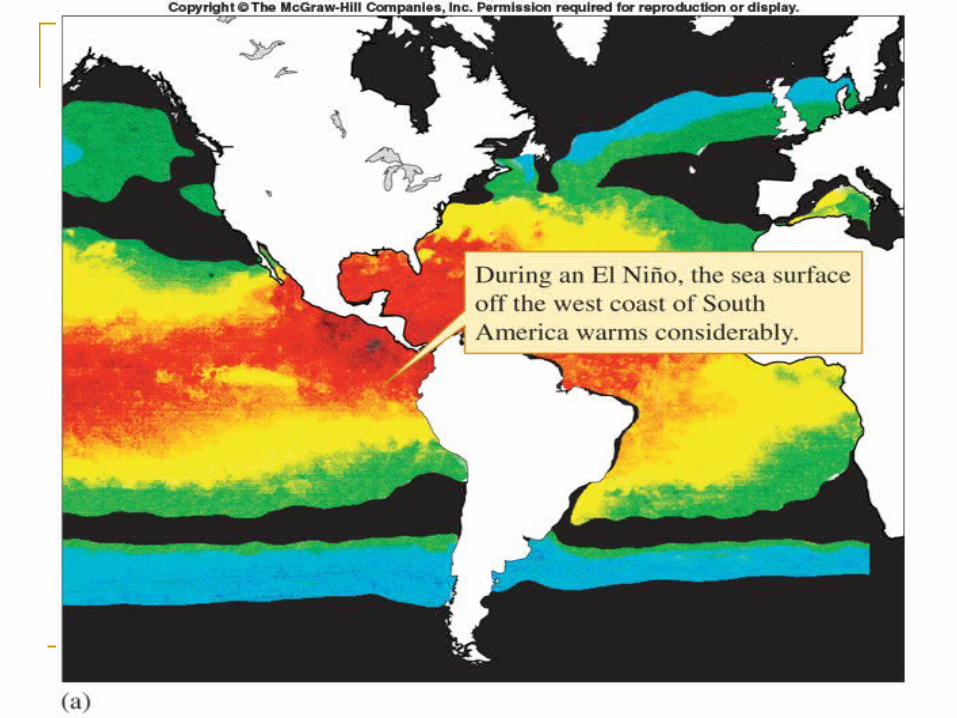
A Global SystemThe El Nino Southern Oscillation, a large-
scale atmospheric and oceanic phenomenon, influences ecological systems
on a global scale.
99
During El Nino, a warm current appears off the coast of Peru. Generally during Christmas season (El Nino refers to the
Christ child). Southern Oscillation refers to oscillation in
atmospheric pressure that extends across the Pacific Ocean.
El Nino animation Beginning El Nino Peru during El Nino Recovery of El Nino

1010

1111
El Nino Today
During mature phase, the sea surface in eastern tropical Pacific is much warmer than average and barometric pressure over the eastern Pacific is lower than average. Promotes formation of storms over eastern
Pacific, and increased precipitation to much of North America.
El Nino and La Nina video

1212
1313
El Nino Today
During El Nino, sea surface in western Pacific is cooler than average and barometric pressure is higher than average. Produces drought over western Pacific.
La Nina: Periods of lower sea surface temperatures and higher than average pressure in eastern tropical Pacific. Drought to much of North America. Higher than average precipitation in western
Pacific.
1414
1515

1616
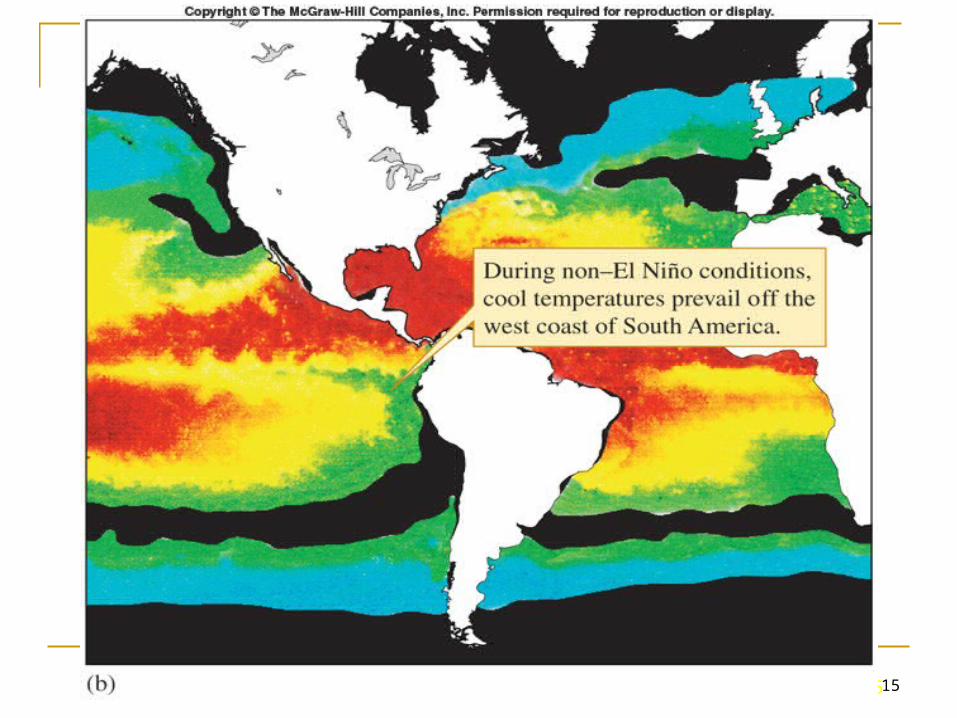
El Nino and Marine Populations Under average conditions, coastal waters are
relatively cool along most of the east coast of S. America. Tongue of cool water extends westward.
Cool water brought to surface by upwelling. During mature phase, warm surface water shuts
off, reducing nutrient supply, and reducing phytoplankton production. Reproductive failure, migration, death.

1717El Nino and Great Salt Lake
Strong El-Nino of 1982-83 was source of many storms deep into interior of N. America. Increased precipitation with Great Salt Lake basin.
1983-87 lake rose 3.7 m. Wurtsbaugh and Smith Berry found lake salinity
dropped by 50 g/l and the lake was invaded by predaceous insect Trichocorixa verticalis.

1818
El Nino and Great Salt Lake
Predator reduced population of brine shrimp from 12,000 to 74 per m3. Phytoplankton biomass
increased significantly. By 1990, lake level fell 2.8 m,
and salinity returned to 100 g/l. All ecosystem changes were
reversed.

1919
El Nino and Kangaroo Populations Red Kangaroo (Macropus rufus) occupies most
of Australia’s semiarid interior. During wet period with plenty of food, females
will simultaneously have a “joey” (juvenile) following, a younger offspring in the pouch, and an embryo waiting to enter the pouch.
Under marginal conditions, most young die soon after leaving the pouch.
If food becomes scarce, females stop lactating and young die in embryo stage.

2020
El Nino and Kangaroo Populations Kangaroos breed quickly and young enter the
pouch within 60 days of onset of significant rainfall.
By reproducing large numbers of offspring under favorable conditions, kangaroos increase the number of adults that will face El Nino induced droughts.
Cairns and Grigg found a tight coupling of M. rufus populations to El Nino.

2121
Human Activity and Global Nitrogen Cycle As human civilization developed intensive
agriculture and industrial processes, we began to manipulate nitrogen cycle on massive scale. Vitousek
N - fixing bacteria/plants 100 Tg/yr Marine environments 5-20 Tg/yr Lightning 10 Tg/yr Human sources 130 Tg/yr

2222
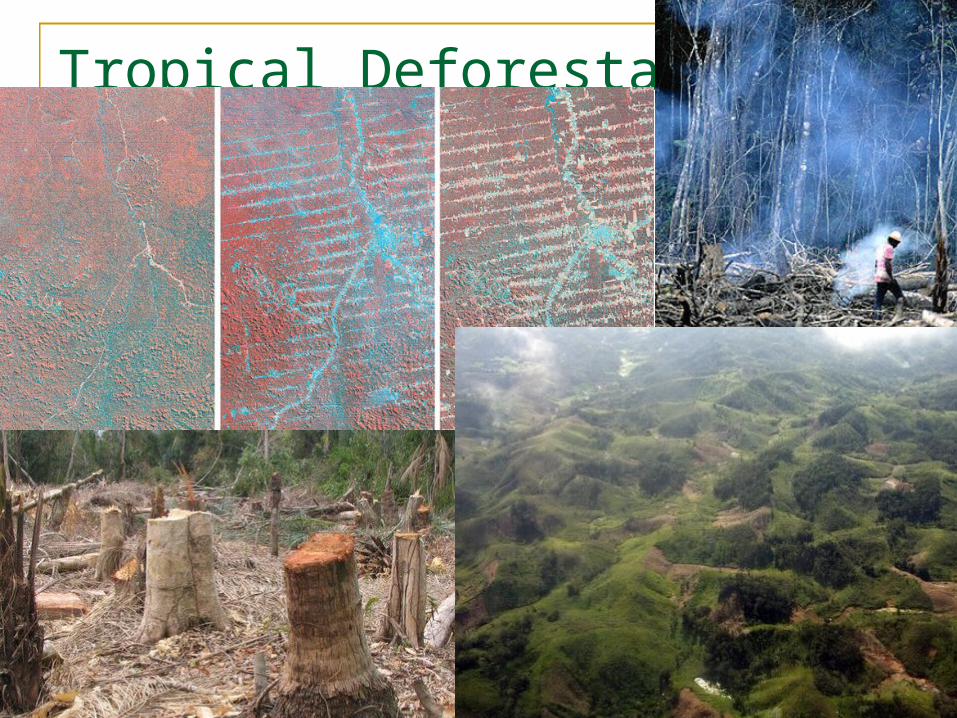
Tropical Deforestation
Support at least half of earth’s species. Skole and Tucker reported tropical forests
occur in 73 countries and once covered 11,610,360 km2. Brazil contains 1/3 of total.
Highest deforestation rate. Estimated by 1978, 78,000 km2 deforested. Annual rate of deforestation 1978-1988 was
15,000 km2.
2323
Tropical Deforestation
2424
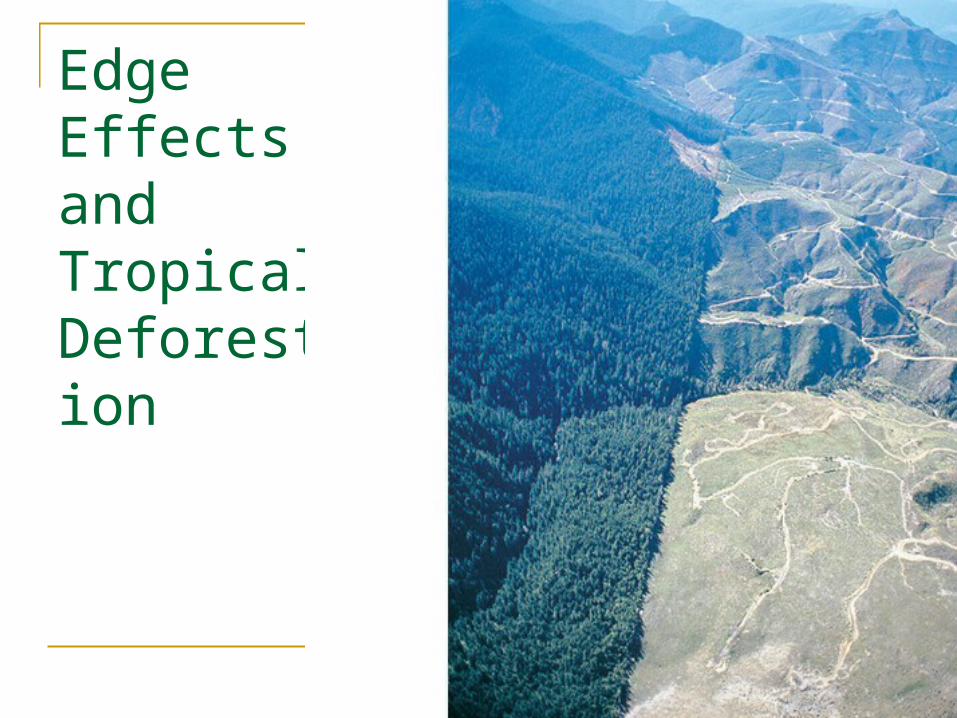
Edge Effects and Tropical Deforestation When a forest fragment is isolated due to
cutting, its edge is exposed to greater amounts of solar radiation and wind. Physical environment along forest edges is hotter
and drier and solar intensity is higher. Fragmentation decreases diversity of many animal
groups.
2525
Edge Effects and Tropical Deforestation
2626
Human Influence on Atmospheric Composition
Record of atmospheric composition during last 160,000 years was extracted from ice cores in Greenland and Iceland. Samples of atmosphere trapped in ice.
Core indicated two very large fluctuations in atmospheric CO2 concentrations. 140,000 years ago. 13,000 years ago.
2727
Human Influence on Atmospheric Composition
2828
Human Influence on Atmospheric Composition
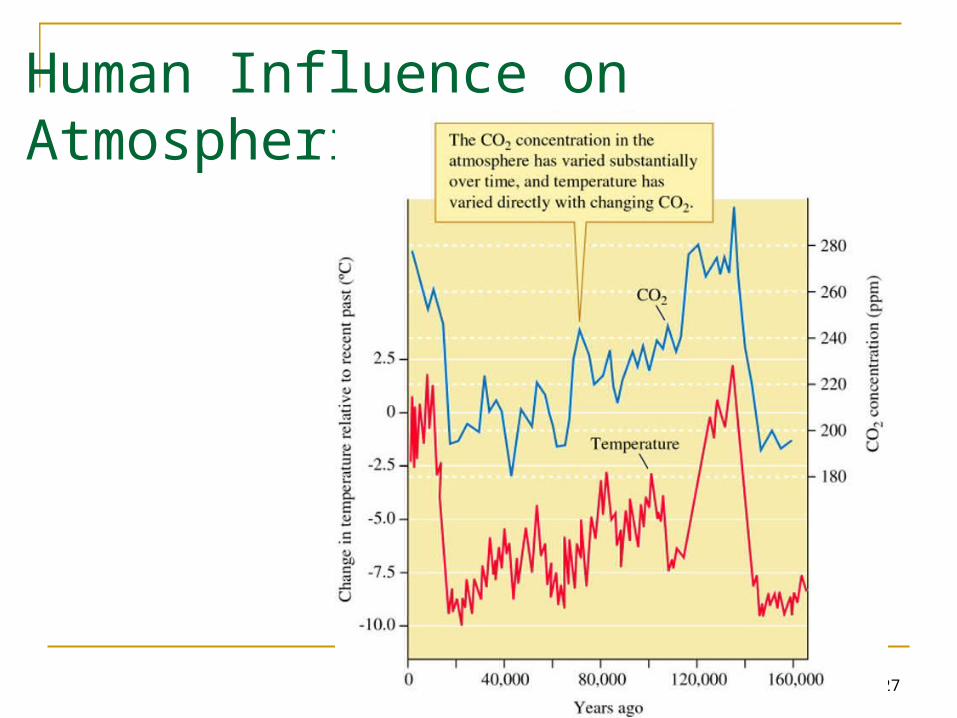
Periods of low CO2 correspond to low temperatures experienced during ice ages, while high levels correspond to interglacial periods.
During 19th and 20th centuries, concentration of atmospheric CO2 increased dramatically.

2929
3030
Human Influence on Atmospheric Composition
Fossil fuel burning alone produces more than enough CO2 to account for recent atmospheric concentrations. Three major periods of interruptions:
World War I Great Depression World War II

3131
Depletion and Recovery of the Ozone Layer
In 1985, British Antarctic Survey discovered major reduction in atmospheric ozone (O3) in stratosphere.
Ozone absorbs potentially harmful UV or radiation Attention focused on stopping chlorofluorocarbons
(CFCs). 1987 Montreal Protocol
Largest hole to date in 2000. 2003 saw first reported evidence the ozone layer is
recovering.

3232